Publications
2009 California Green Innovation Index
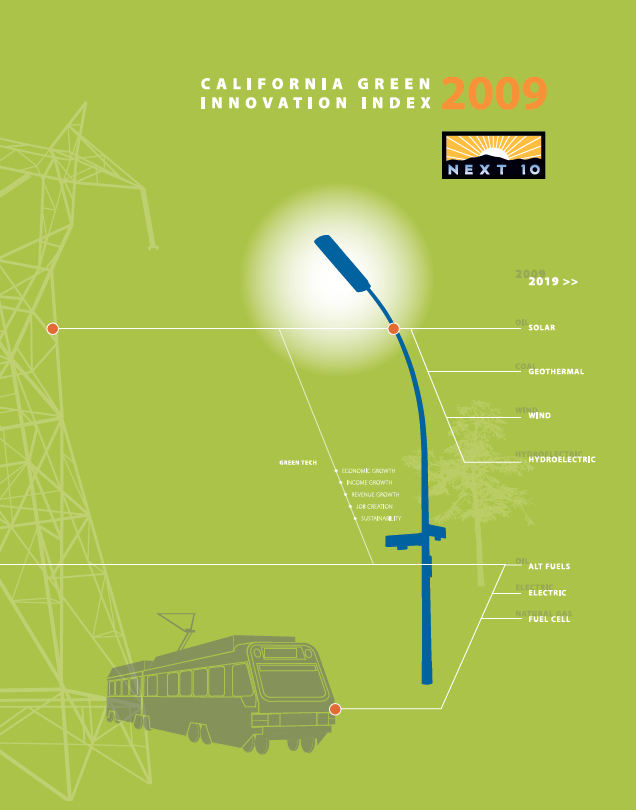
The 2009 California Green Innovation Index, produced by Next 10 and authored by Collaborative Economics, provides a deep analysis of key economic and environmental indicators that will help us better understand the role green innovation plays in reducing greenhouse gas emissions while strengthening the economy.
Research included in this Index provides further evidence of the powerful economic stimulus clean energy policy can provide. California’s energy productivity, that is, the amount of Gross Domestic Product produced per unit of energy, is 68 percent more productive than the rest of the nation. New data presented shows that while total jobs increased by just one percent statewide, green jobs have increased by ten percent since 2005.
Clean technology investment in California nearly doubled in 2008, reaching an all-time high of $3.3 billion and capturing 57 percent of the national total. Los Angeles, San Francisco, and Sacramento together accounted for over 20 percent of the nation's hybrid vehicle registrations in 2007. California is a national leader in solar, wind and battery patents.
Next 10 owns the rights to this publication. Any usage of content from this publication is subject to our Terms of Use.
Key findings of the Index include:
- From 2002 to 2007, California led all states in patent registrations for green technologies, increasing the state's total number by 70 percent over a similar period in the early nineties.
- Despite slowing in overall venture capital investment, clean technology investment in California hit an all-time high in 2008 of $3.3 billion, increasing nearly $1.5 billion over 2007 and over seven times the total clean tech investment in 2005.
- Since 2005, green jobs have grown by ten percent, while statewide jobs have increased by only one percent. By green segment, job growth has been strongest in Advanced Materials (28%), followed by Transportation (23%), Air & Environment (22%), and Green Building (20%), with 20 percent of those jobs generated in manufacturing.
- OVer 1.5 million jobs have been created as a result of energy efficiency policies forged by California over the last 35 years, generating $45 billion in payroll.
- California's energy productivity is 68 percent higher than that of the rest of the country. Measured as the ratio of energy consumed (inputs) to GDp (economic output), growth in energy productivity equates to more dollars of GDP generated per unit of energy consumed.
- Nationally, California is the top-ranking state in alternative fuel vehicle (AFV) registrations (excluding Flex Fuel Vehicles) with the number of newly-registered AFVs more than four times higher than any other state. However, according to the most recent data, the U.S. as a whole had higher average fuel economy of passenger vehicles (20.1 mpg) than California (19.9 mpg) in 2006.
- In 2007, three of the top ten hybrid metropolitan markets were in California—Los Angeles (#1), San Francisco (#2), and Sacramento (#9) metropolitan areas accounted for over 20 percent of new hybrid registrations in the U.S.
- Power generation from renewable sources increased by 19 percent in California from 2002 to 2007, while total energy generation grew by only 11 percent. Since 2003, the wind power generated for California increased 95 percent.
- Since 2001, vehicle miles traveled (VMT) per capita in California dropped two percent with half of this progress achieved between 2006 and 2007 alone. During this same time period, VMT per capita in the rest of the nation increased three percent. Relative to 2002, while gasoline prices in 2008 climbed 92 percent higher, total California sales dropped back to 2002 levels and gasoline sales per capita dropped 10 percent.
- California increased grid-connected photovoltaic (PV) solar capacity by 41 percent from 2006 to 2007.
- Public transportation expanded 22 percent from 2005 to 2006, adding over 100.5 million transit service miles.
Trends identified in the 2008 Index that continued in the 2009 Index include:
- Californians, per capita, pay lower utility bills and spend billions less of their state economy as a whole on electricity than the rest of the country due to energy efficiency innovation.
- California's Carbon Economy continues a gradual downward trend in the direction of a carbon-free economy, de-linking economic growth from GHG emissions. While GDP per capita has increased by 28 percent in 16 years (1990-2006), gross emissions per capita are 10 percent lower than in 1990.
- The average monthly residential electric bill in California is less than half of the average monthly bill in Texas, representing a total savings for Californians of nearly $25 billion in 2007. As a fraction of the state economy, Texas' overall electricity bill is almost double California's bill.
Though many of the 2009 Index findings confirm continued progress, major indices underscore the difficult challenges ahead:
- Even while per capita VMT and emissions have scaled back to 1995 levels, total VMT and transportation GHG emissions have increased 20 percent since that year.
- While slowing in growth since 2001, total GHG emissions in California continued to rise by four percent from 2003 to 2006.
- Total electricity consumption in California continues to rise, though 2006 to 2007 represents the smallest annual increase since 2002.
- Commercial electricity consumption continues to rise, increasing overall from 2004 to 2005 by three percent, and per square foot by one percent. Large-scale data centers, or server farms, are not included in this number.
- The number of working Californians using alternatives to driving alone has remained fairly static between 26 and 28 percent since 2000.