Publications
California State and Regional Economic & Demographic Snapshot
California is composed of distinct regions with different economies and populations. Each region is trying to create jobs that match the skills of its population. In addition to recovery from the recession, each region is facing longer term structural issues arising from a growing mismatch between job demand and labor supply.
To shed light on what is happening in California’s regions, Next 10 produced 13 regional Economic & Demographic Snapshots, as well as a Snapshot for the State of California. These Snapshots summarize key regional demographic and economic trends, including population demographics, education attainment, household income, employment change by industry, unemployment levels, and job gains and losses.
Snapshots for the individual regions are available on the Additional Resources tab. Regions include:
- Bay Area
- Butte
- Fresno
- Inland Empire
- Los Angeles
- Orange
- Redwood Coast
- Sacramento
- San Diego
- San Luis Obispo
- Sierra Nevada
- Silicon Valley
- Sonoma
The Economic & Demographic Snapshots were originally developed for the first California Economic Summit, which was hosted by the California Stewardship Network, including Doug Henton and Julie Meier Wright, and California Forward.
California statewide highlights:
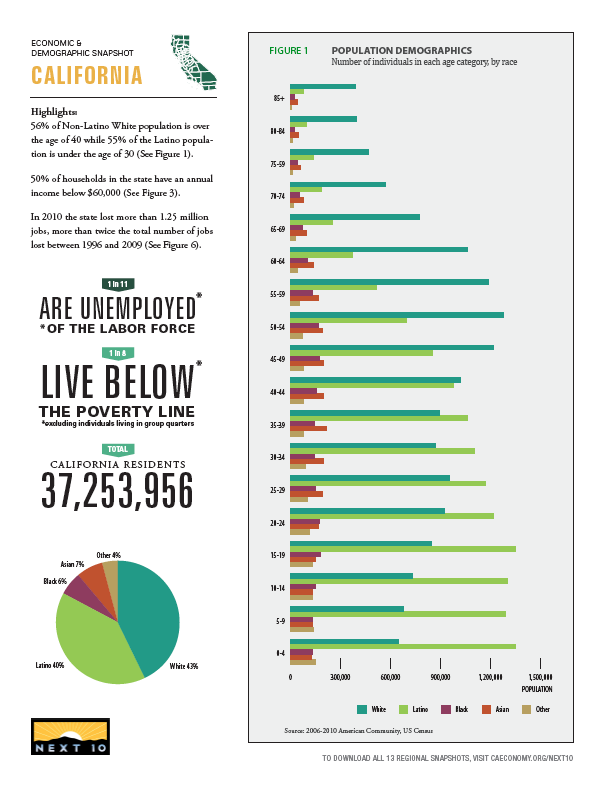
- 56 percent of the non-Latino White population is over the age of 40 while 55 percent of the Latino population is under the age of 30 (see Figure 1).
- 50 percent of the households in the state have an annual income below $60,000 (see Figure 3).
- In 2010, the state lost more than 1.25 million jobs, more than twice the total number of jobs lost between 1996 and 2009 (see Figure 6).
- 1 in 11 of the labor force are unemployed.
- 1 in 8 live below the poverty line (excluding individuals living in group quarters).
- The recent economic downturn hit California's economy significantly, with the unemployment rate in 2010 reaching 12 percent, the highest unemployment rate recorded in decades (see Figure 5). As of March 2012, California's unemployment rate was 11.5 percent.
- The most affected sector in terms of the percent change in employment was Government, cutting down more than 30 percent of employment between 2007 and 2011 (see Figure 4).
- Education and Health Services was the only sector that experienced a consistent increase in employment between 2007 and 2011 (see Figure 4).