Publications
Current State of the California Housing Market
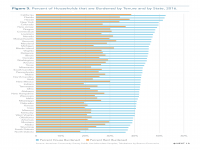
A trio of new studies suggest deepening divisions in California's economy, depending on residents' income and where they live. Some familiar trends continue.
Over the decade ending in 2016, more people moved out of California than moved in, and the state still has the highest housing costs in the nation. Job growth is up across low-, mid- and high-income earners, but while wages have increased across all categories, low-income earners haven’t seen their paychecks increase at a comparable pace in recent years. Well-educated, high-income earners continue to move to California, even as growth in high-wage employment has slowed. As housing prices near an all-time high, Californians with low-paying jobs are leaving the state in search of more affordable lives, despite a growing number of available low-paying jobs.
Regional differences add another layer of complication. For example, in the Bay Area, the number of high-wage jobs continues to grow, and high-wage workers continue to move in, but in Southern California, shares of high- and middle-wage employment have declined. Southern California and rural areas are losing more residents, on average, than other parts of the state.
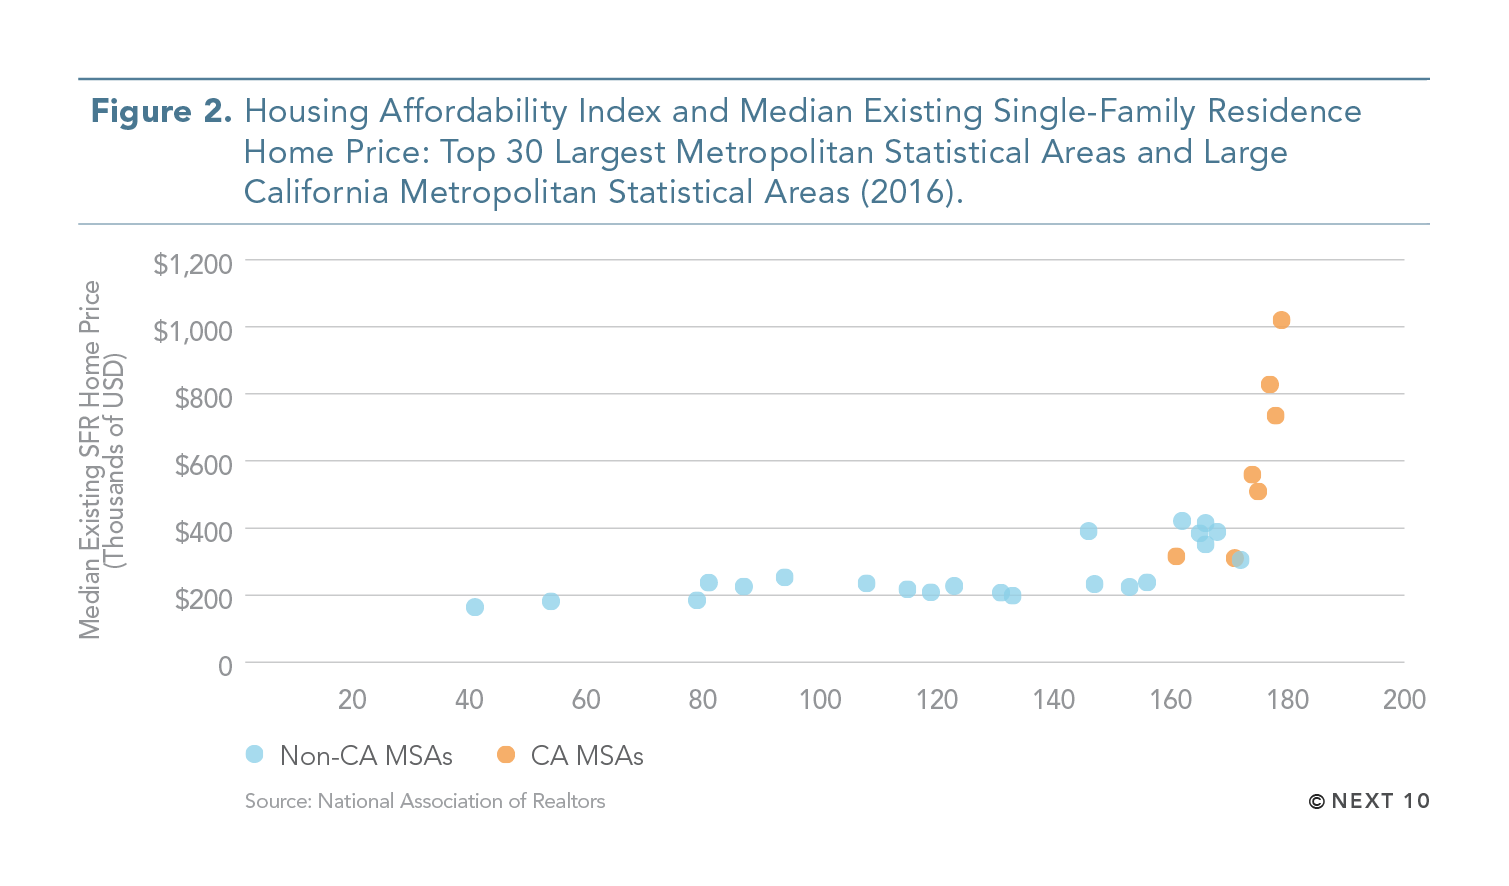
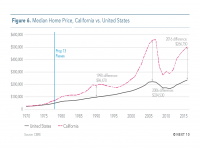
In 2016, the median home price in California was more than double that of the median home price in the U.S. as a whole, with a difference in cost of more than $265,000. This is down from the 2006 difference of $334,530, but California home prices remain the highest in the nation.
Next 10 owns the rights to this publication. Any usage of content from this publication is subject to our Terms of Use.
- California has the highest home prices of any state.
- In 2016, the median California home price was $266,750 greater than the median home price in the U.S. as a whole.
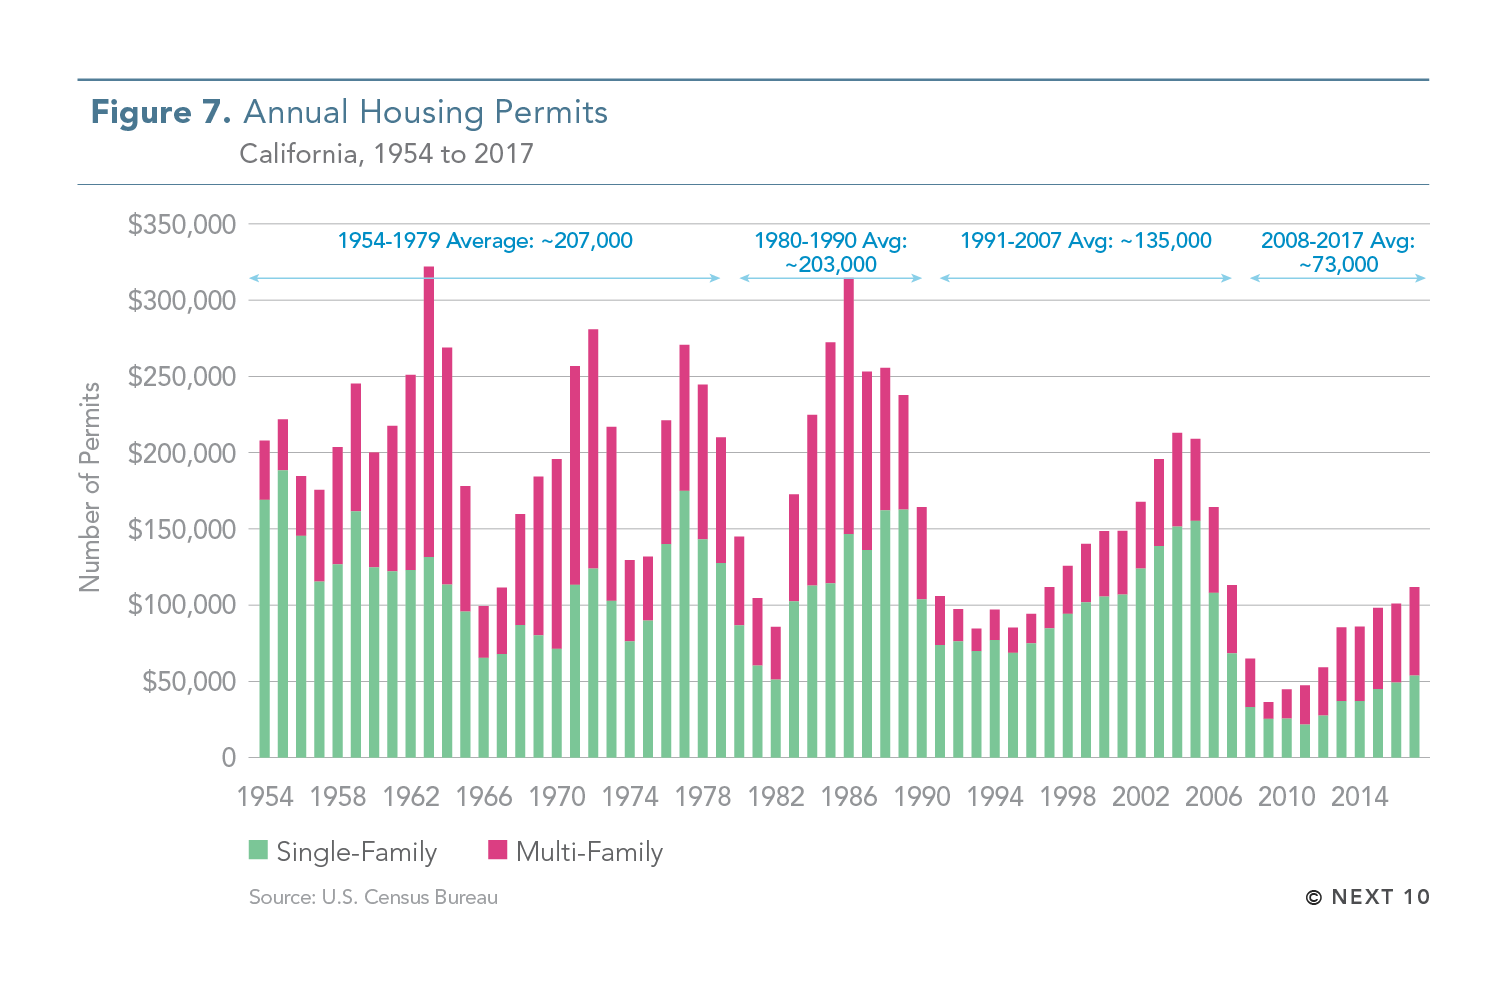
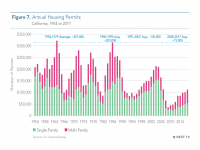
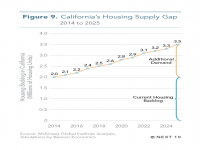
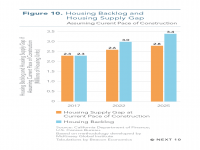
- Post-recession housing construction has been slow.
- From 2008 to 2017, an average of 73,000 new housing permits were issued per year – far lower than the average of 135,000 permits issued annually between 1991 and 2007.
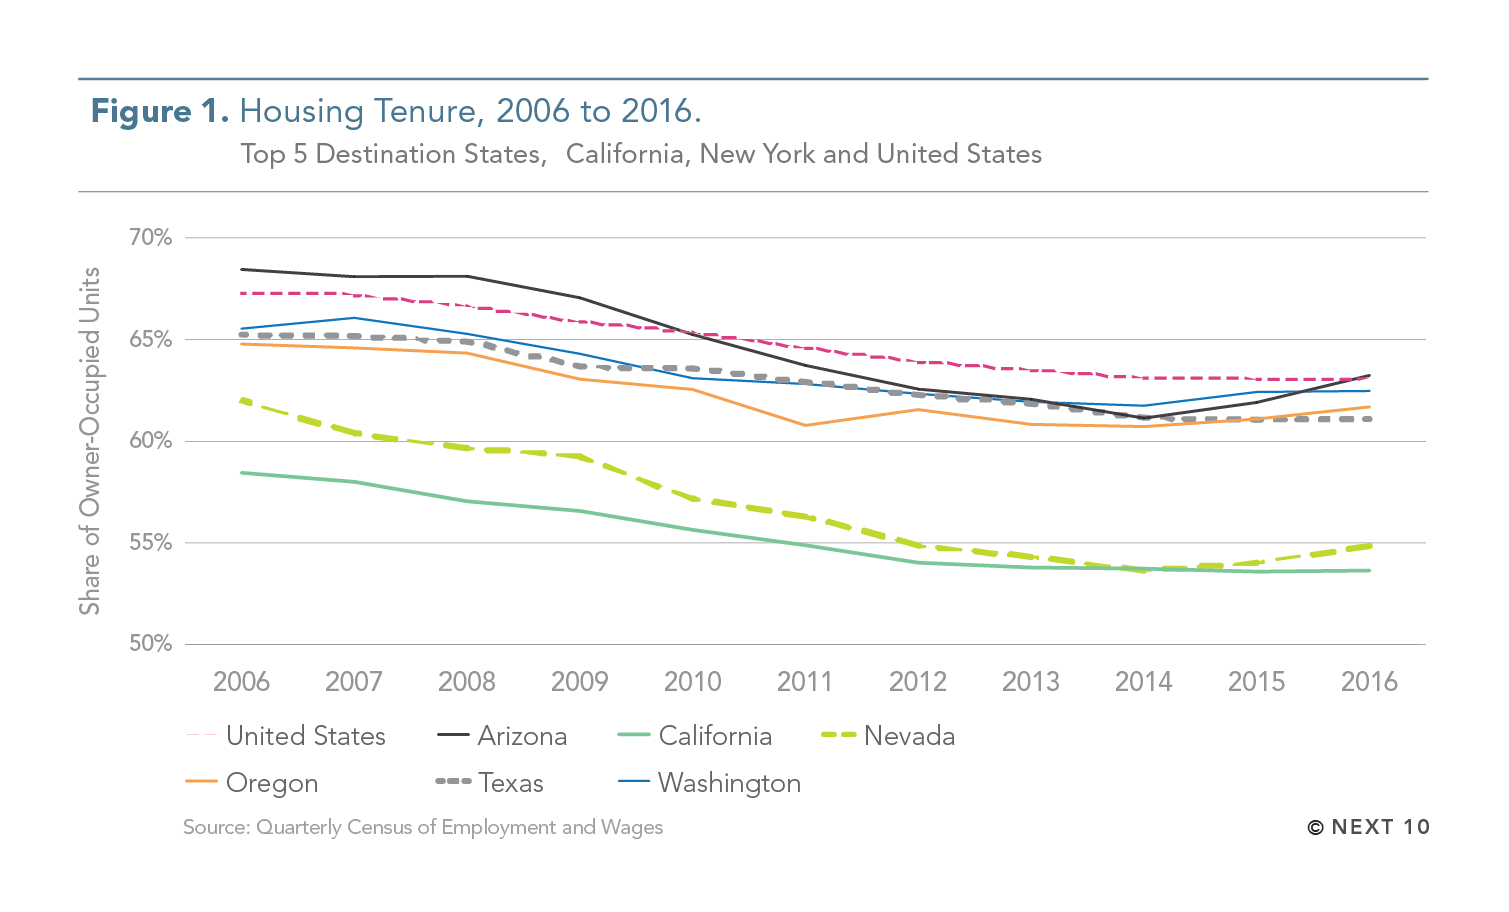
- California has the nation’s second-lowest rate of homeownership and worst rate of rental housing over-crowdedness in the country.
- Housing costs for homeowners with mortgages are the second-worst in the nation, and housing costs for renters are the third-worst.
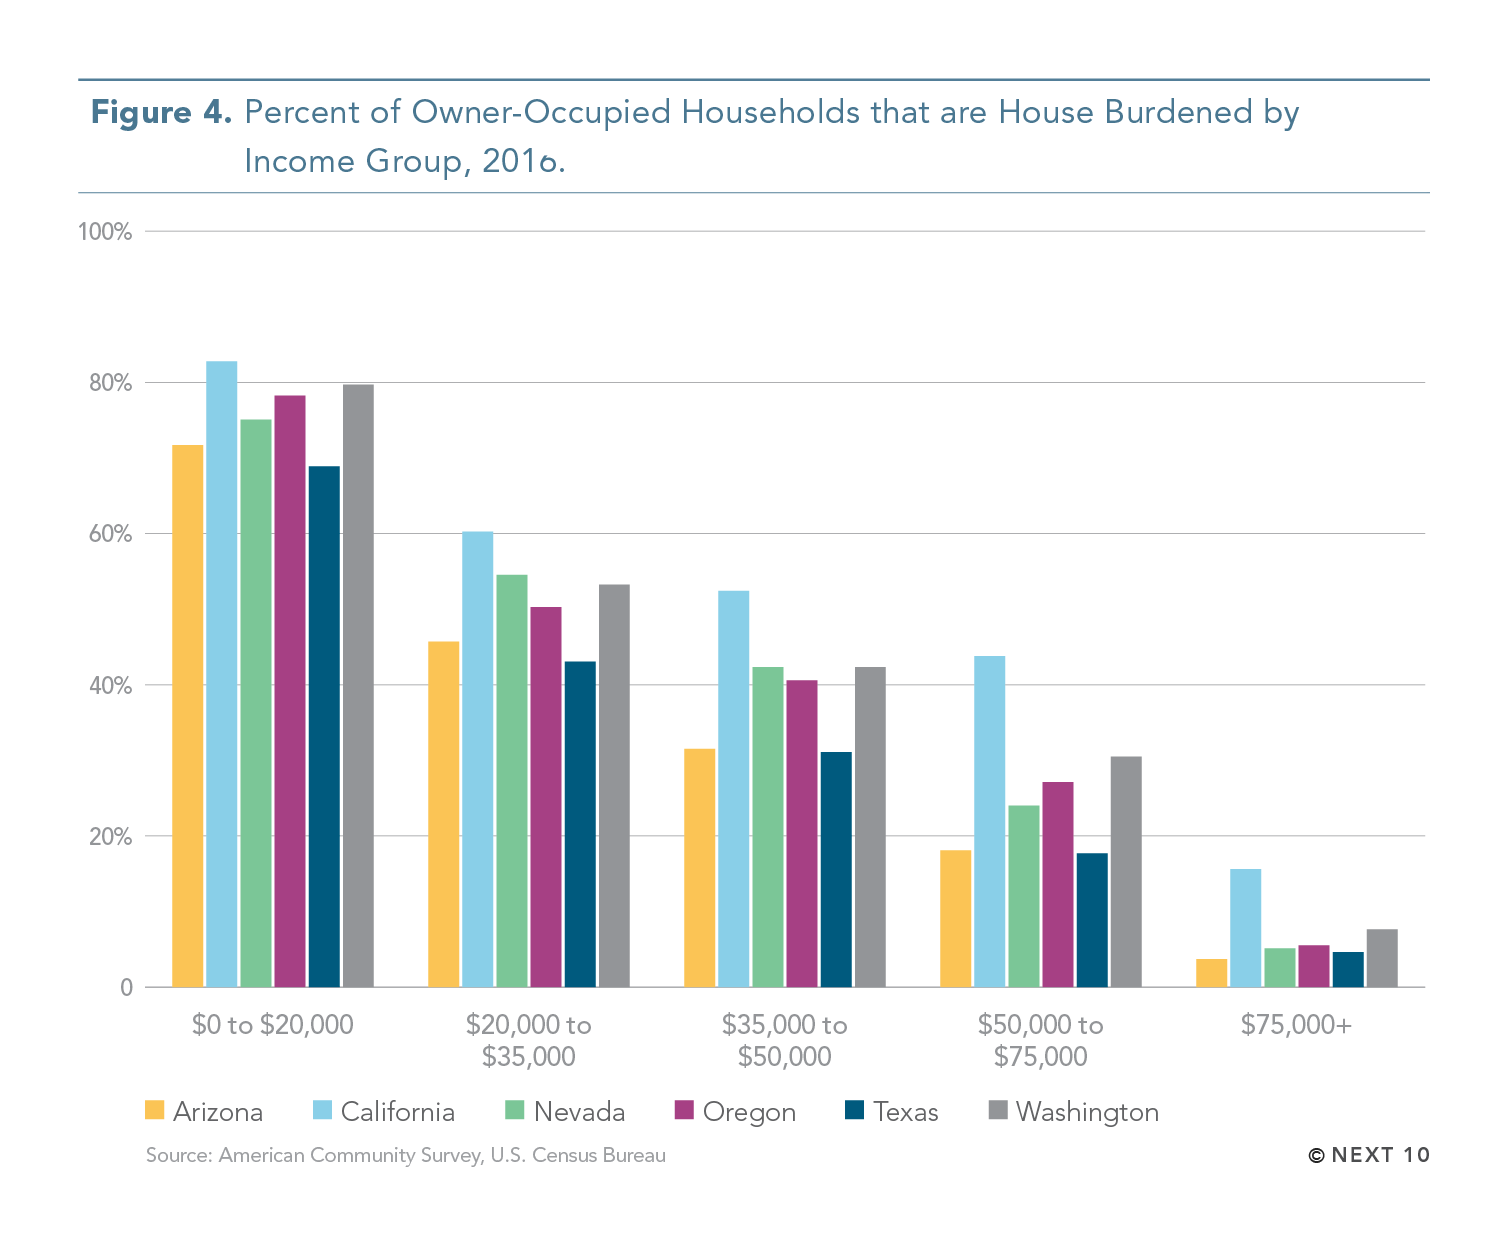
- For homeowners in California, the share of income spent on housing was 21.9 percent in 2016, down from 22.5 percent in 2014.
- California homeowners spend more on housing than homeowners in any other state except New Jersey.
- For renters, housing costs have decreased from 33.6 percent of income in 2014 to 32.8 percent of income in 2016.
- California ranks 48th of 50 states for this metric.
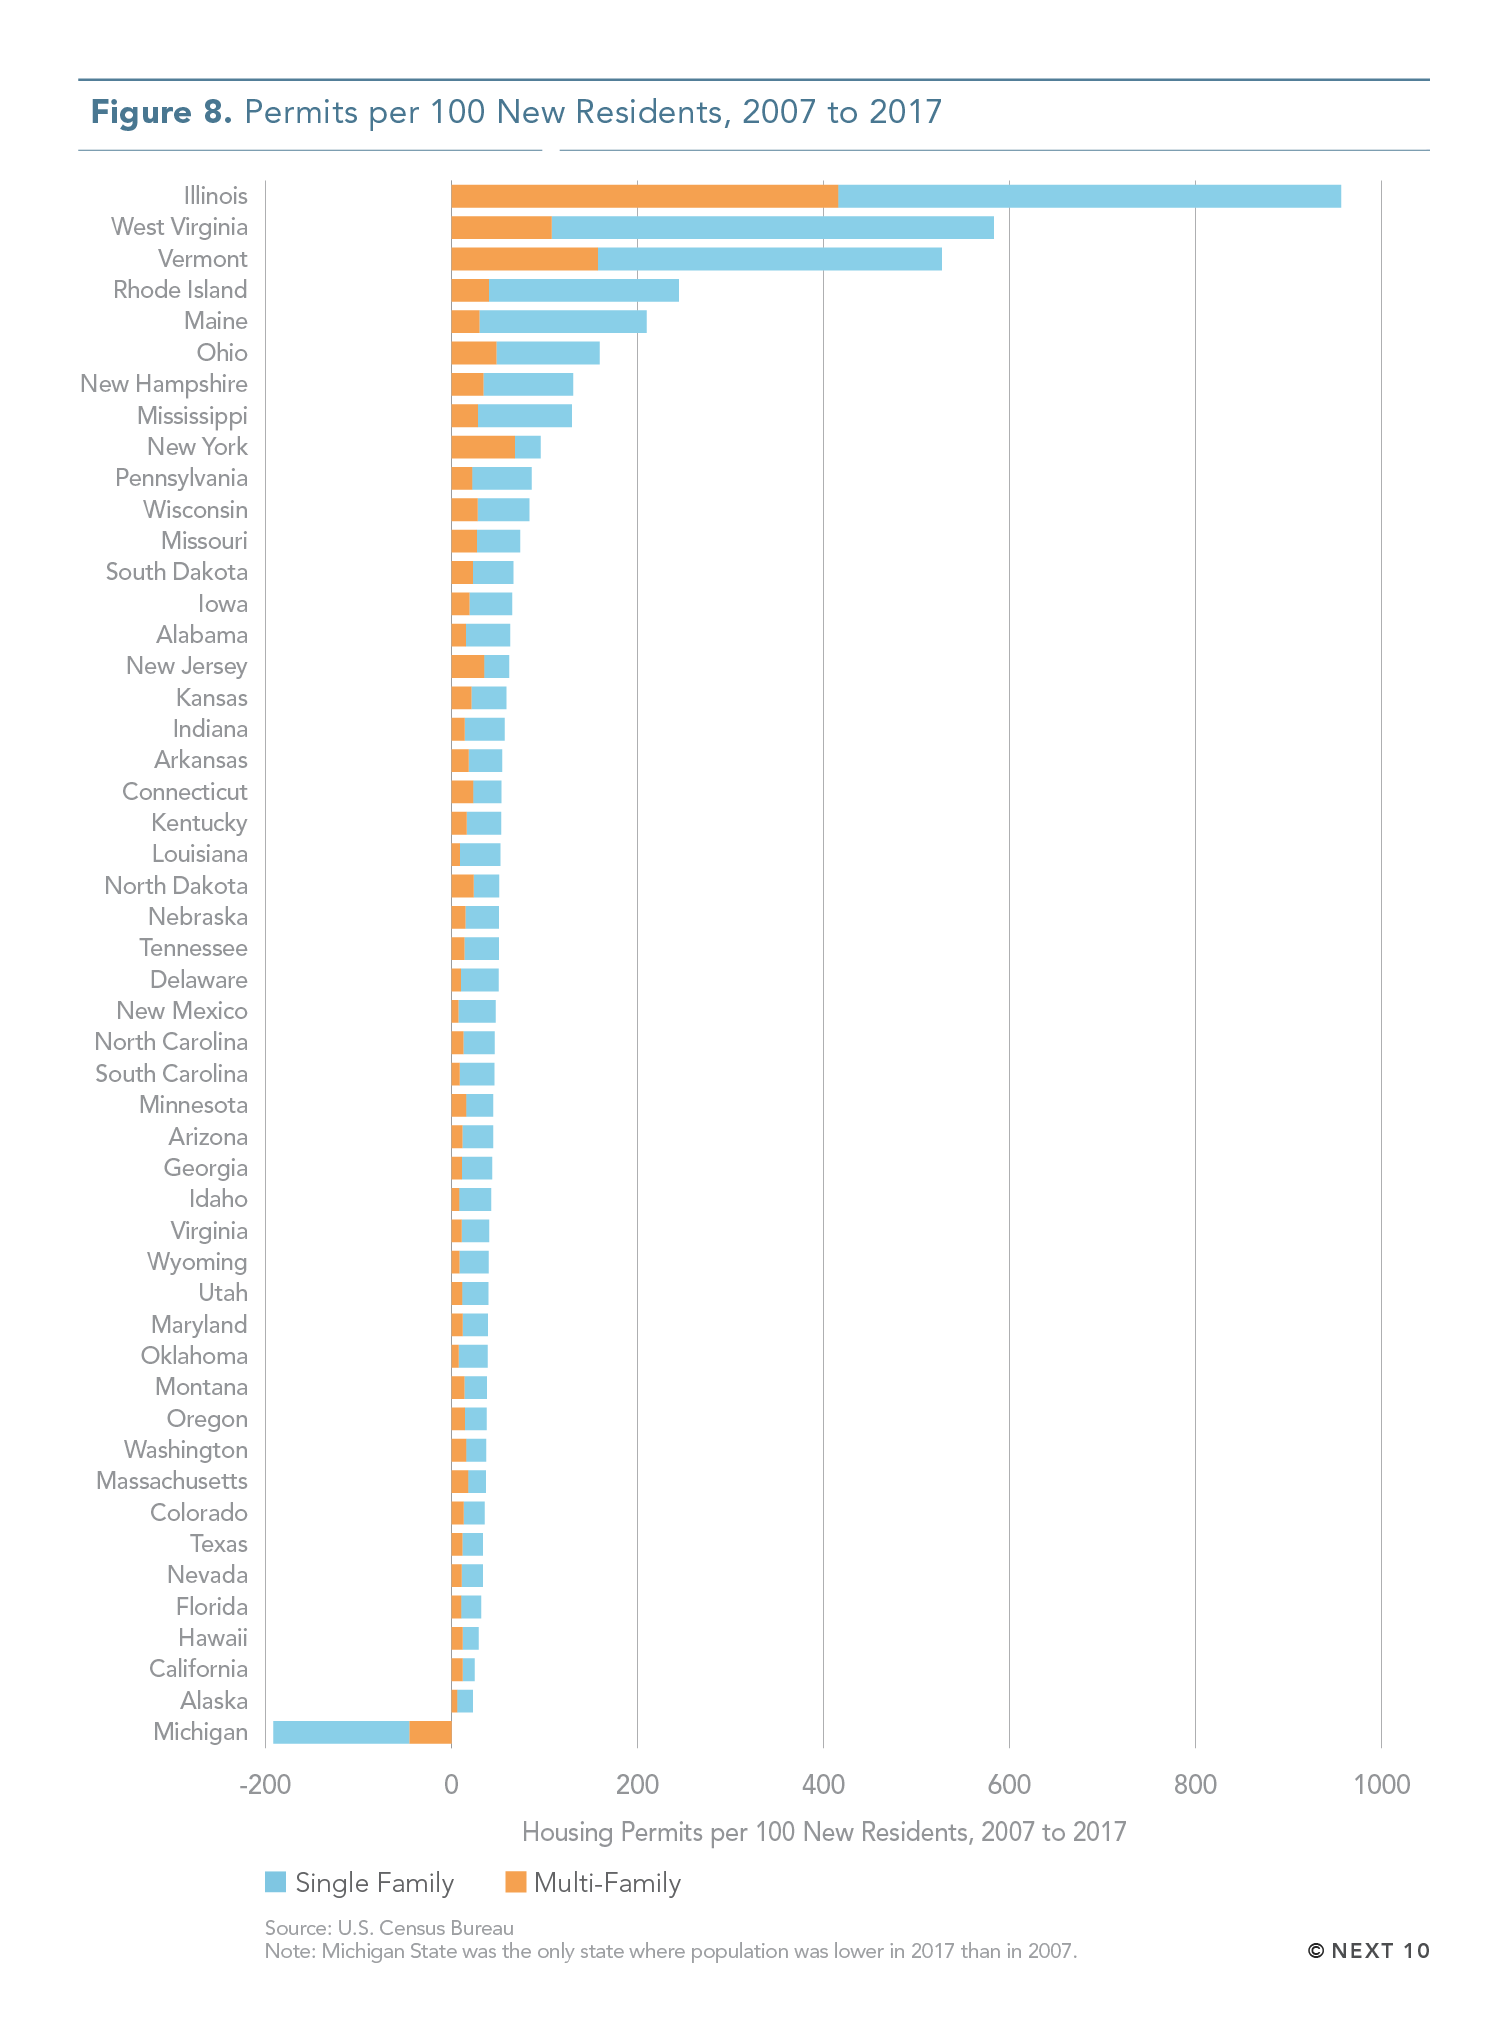
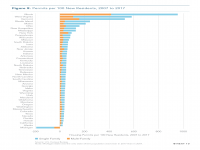
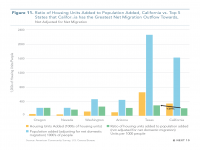
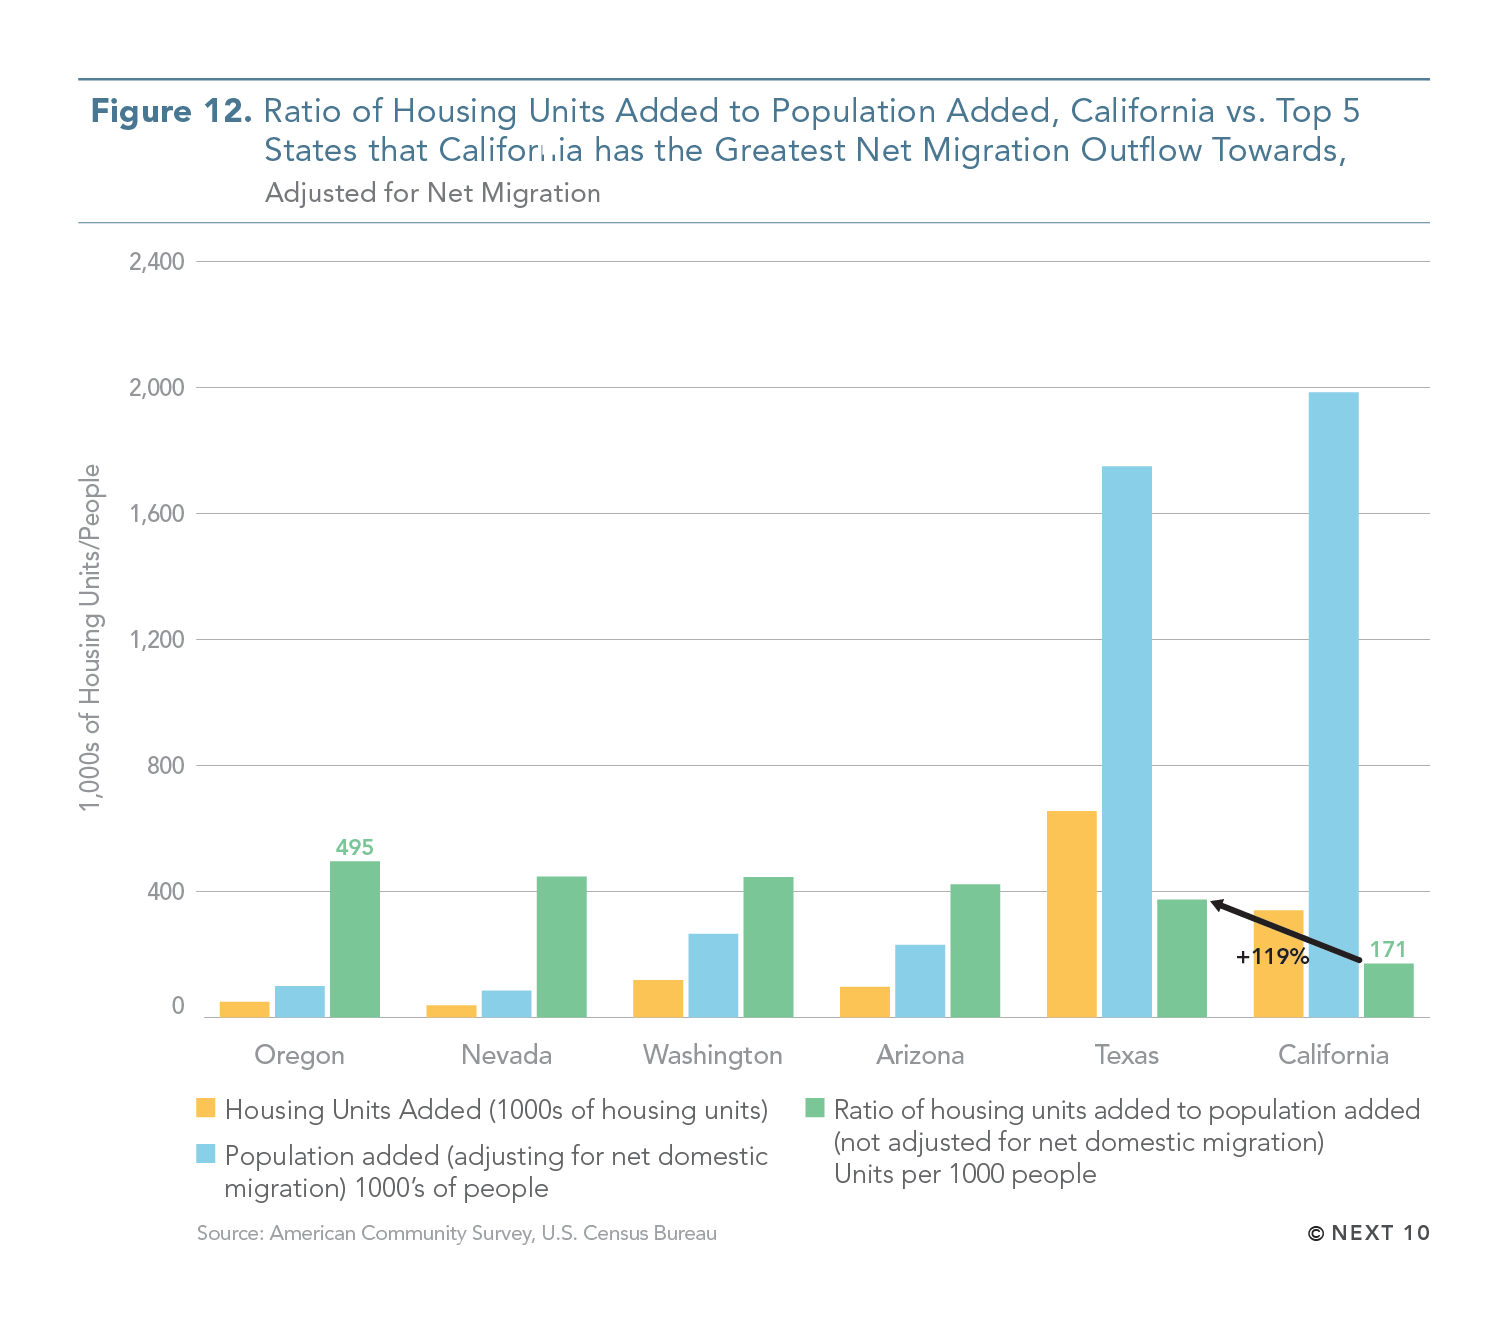
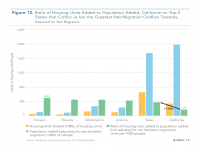
- From 2007 to 2017, only 24.7 housing permits were filed for every 100 new California residents.
- The U.S. average is 43.1 permits per 100 new residents.
- California is permitting roughly the same number of housing units as Florida, despite having approximately 18 million more residents.
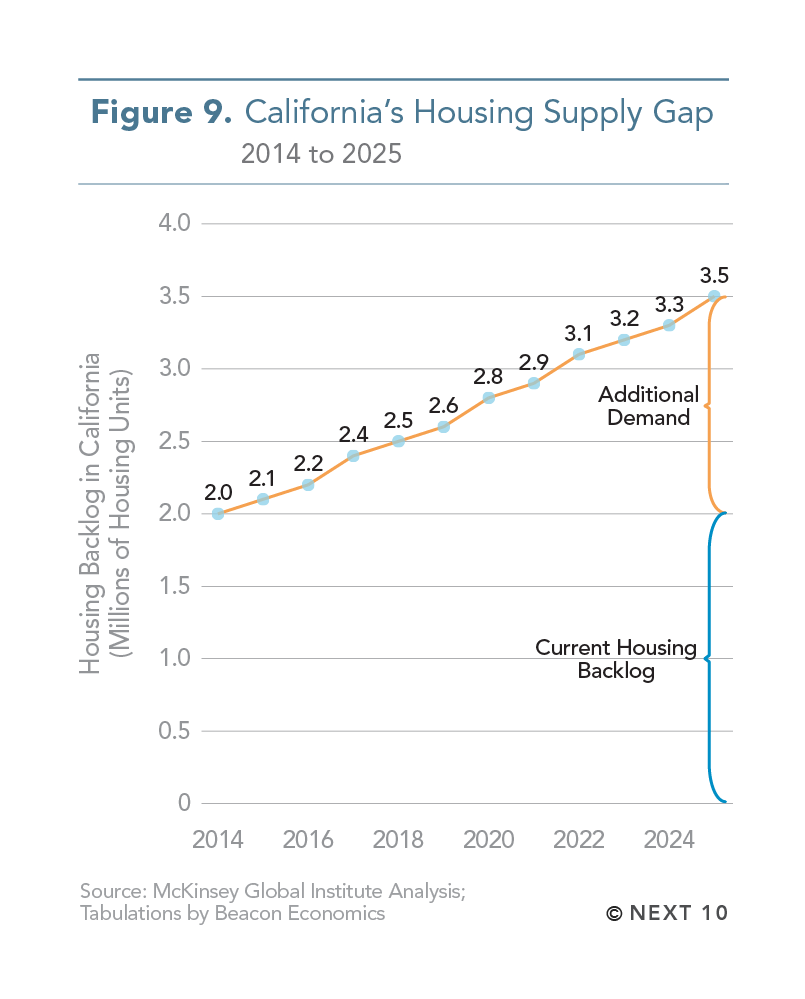
- The housing stock gap is actually being helped by the number of residents leaving the state, and the housing shortage would be even worse if there was no domestic migration.
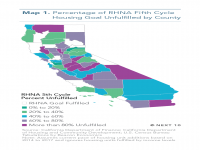
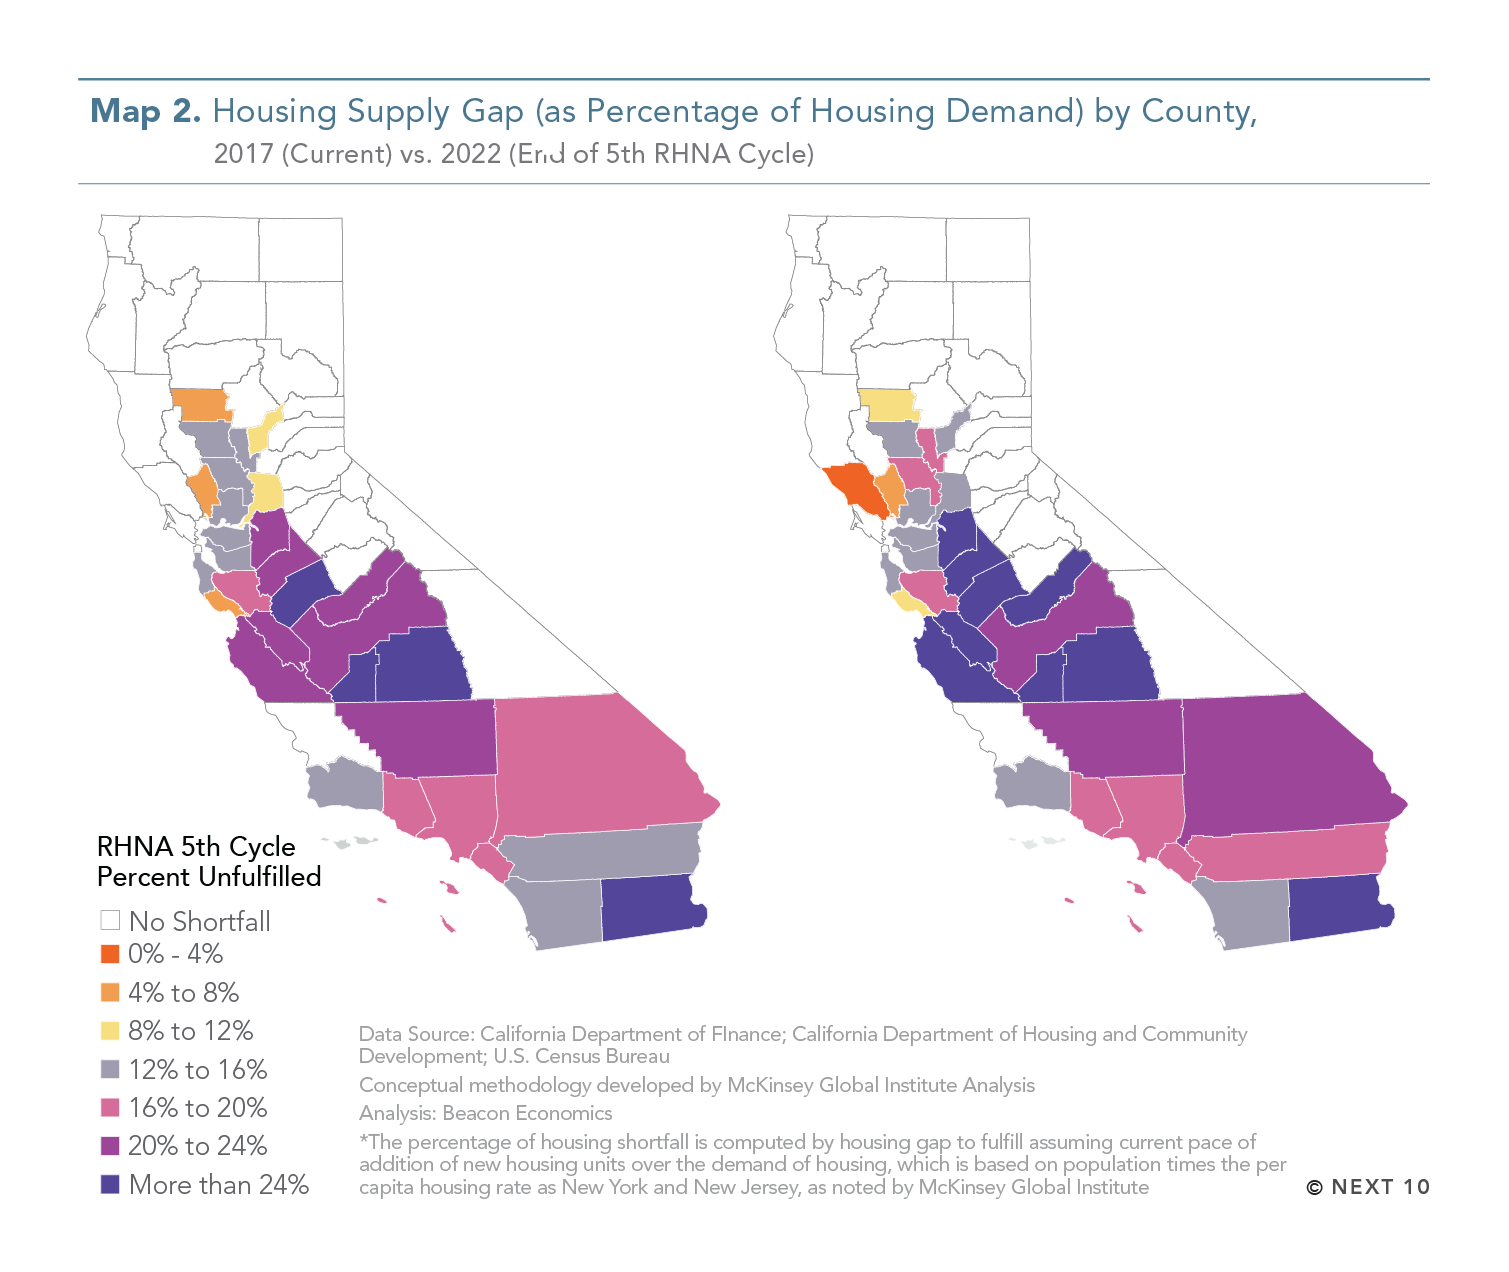
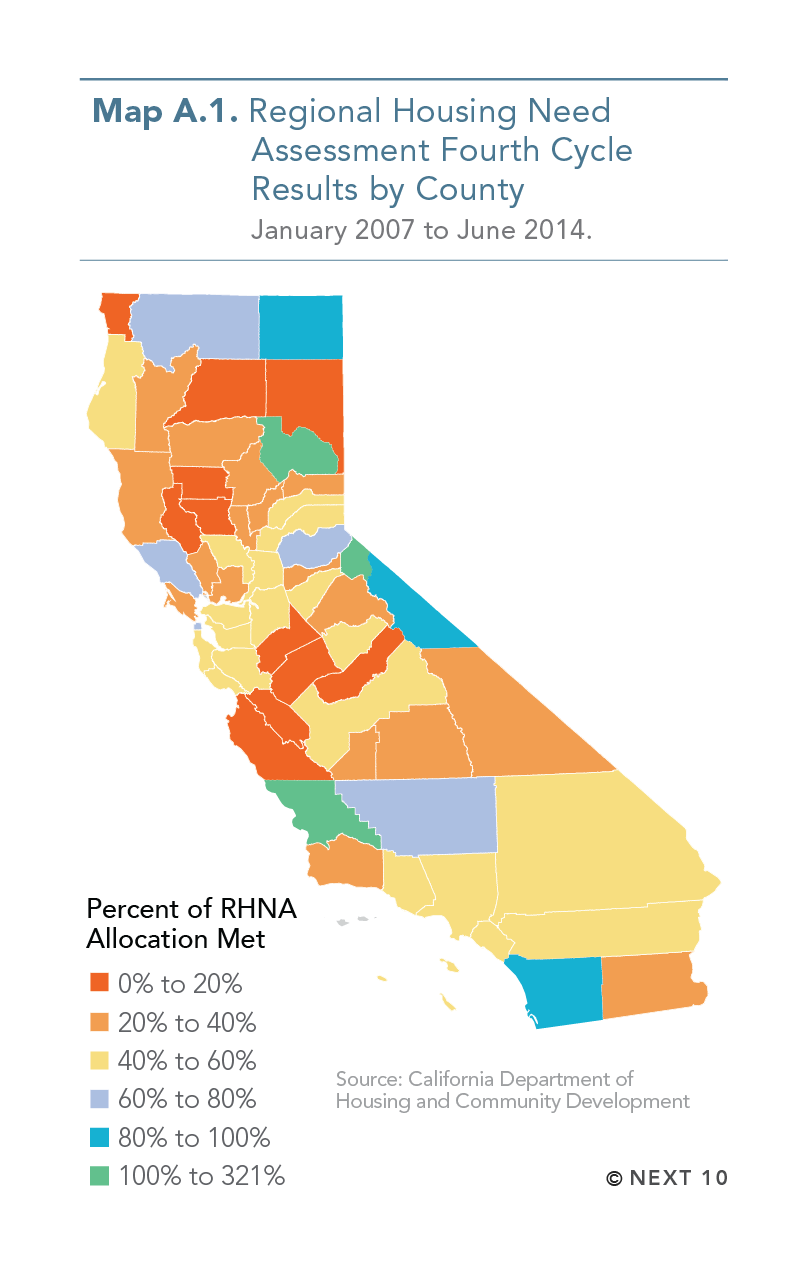
- Most jurisdictions are far behind the housing goals set by the 5th cycle of California’s Regional Housing Needs Assessment (RHNA).
- Agricultural areas, including the Central Valley and Imperial County, are particularly far behind.
Next 10 owns the copyright to all graphics in this section, and they are available for download and limited use, subject to our Terms of Use. Please contact Next 10 at info@next10.org with any questions.