Publications
Paying for Electricity in California: How Residential Rate Design Impacts Equity and Electrification
Half to two-thirds of the electricity rates paid by California residents are, in effect, a “tax” on electricity that disproportionately burdens lower-income households and discourages adoption of electric vehicles, heat pumps, and other clean technologies. This is a finding of Paying for Electricity in California: How Residential Rate Design Impacts Equity and Electrification, a new report from Next 10 and the Energy Institute at the UC Berkeley Haas School of Business. It is a follow up of the 2021 report Designing Electricity Rates for An Equitable Energy Transition.
The report takes a detailed look at the utility bills of more than 11 million California households served by the state’s three largest investor-owned utilities (IOUs)—San Diego Gas & Electric (SDG&E), Pacific Gas & Electric (PG&E), and Southern California Edison (SCE)—and concludes that utilities in California are covering many costs beyond the direct cost of supplying electricity through higher electricity prices.
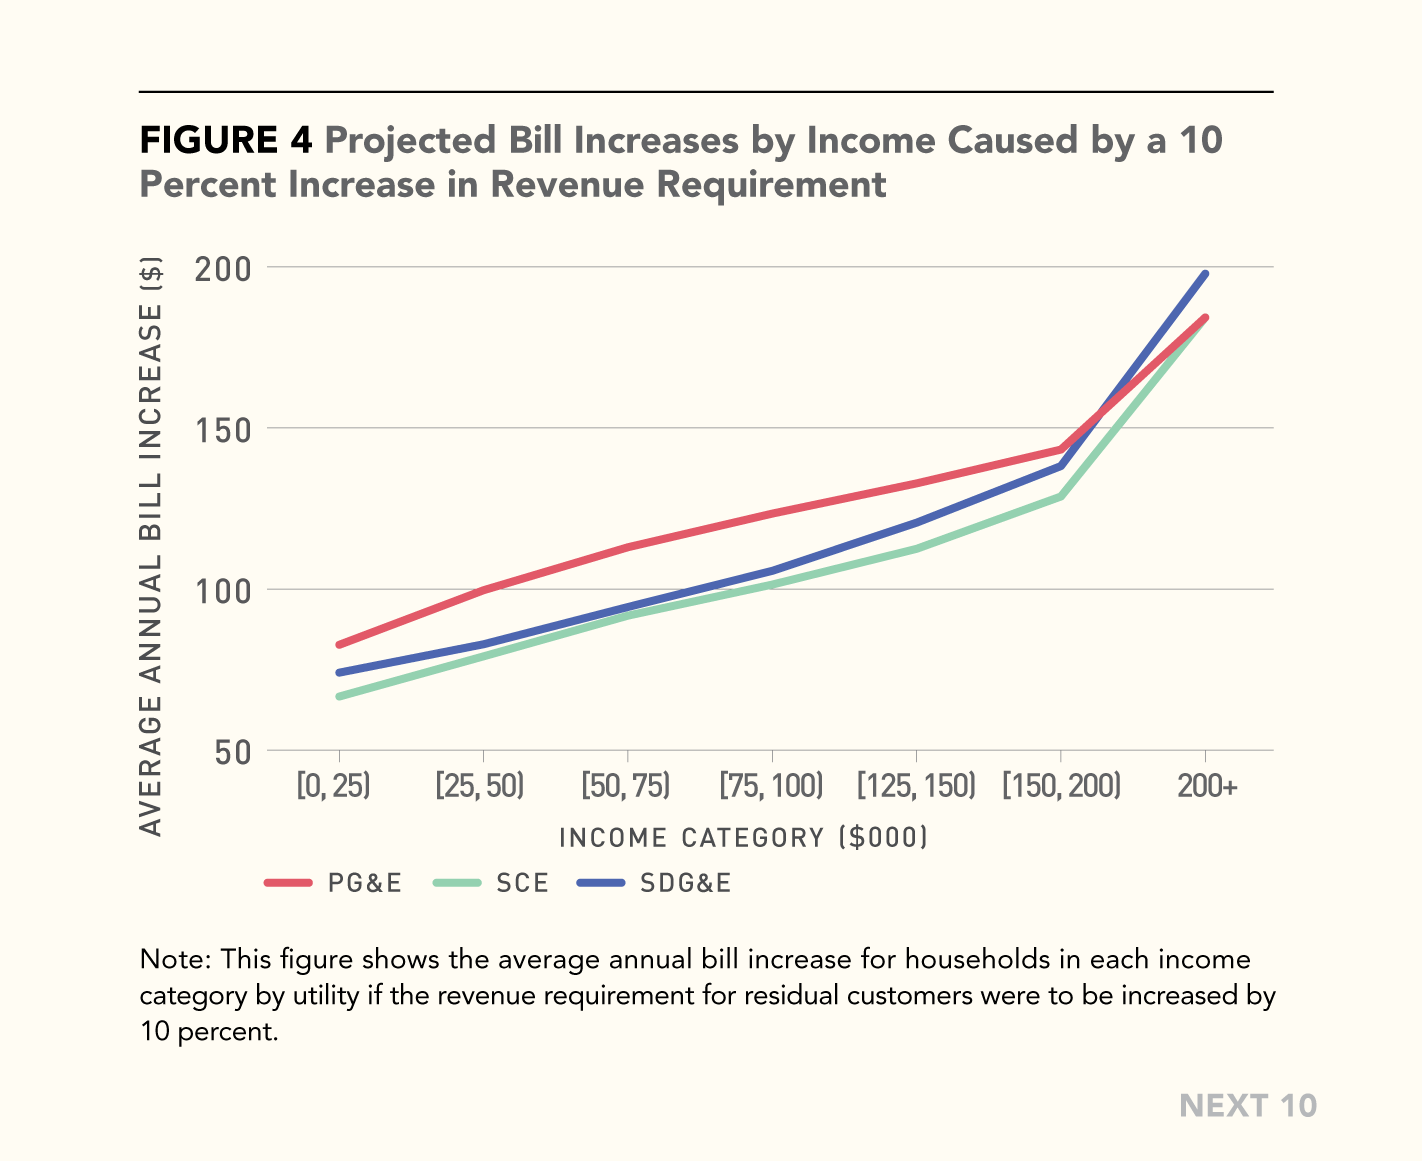
These additions to the price of each kilowatt-hour, effectively a tax on grid electricity, pay for the costs of climate change mitigation, wildfire adaptation, legacy infrastructure, and subsidies for new technology R&D, energy efficiency investments, low-income customers, and rooftop solar, among other fixed costs and policy expenses. These residual costs are now the main driver of retail electricity price increases, which have risen 16 percent on average since 2019. The high costs of electricity are also threatening the state's climate goals by disincentivizing the switch to electric vehicles and appliances.
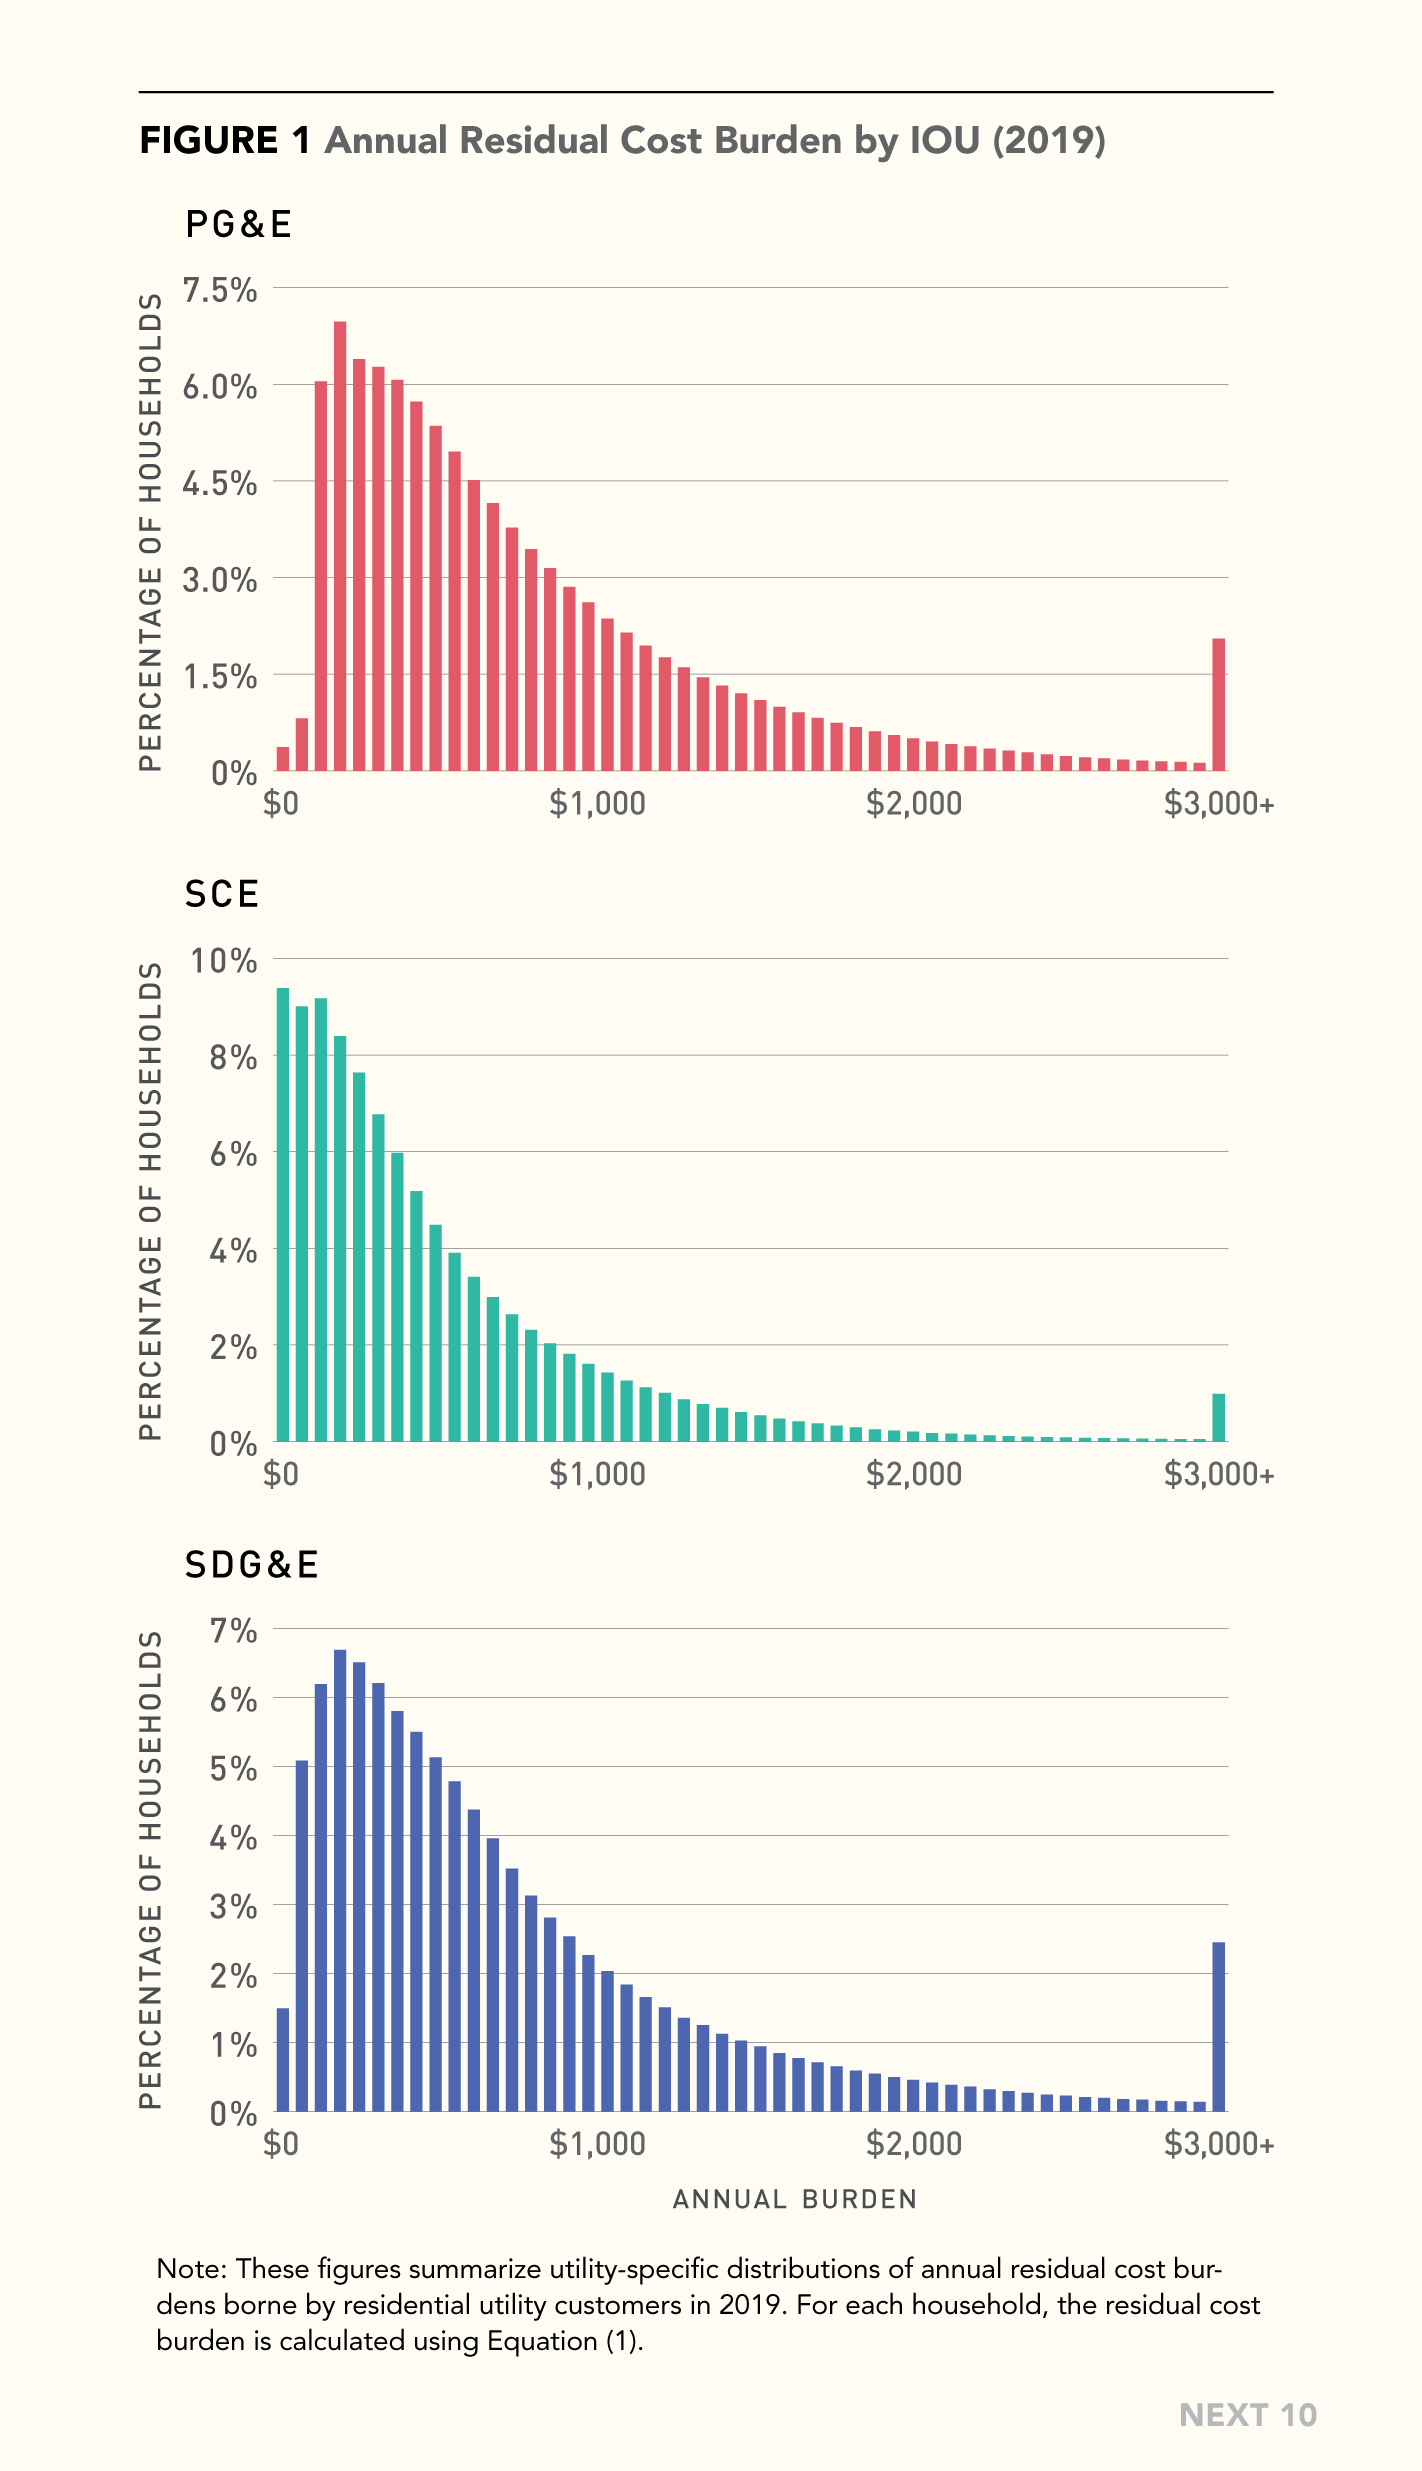
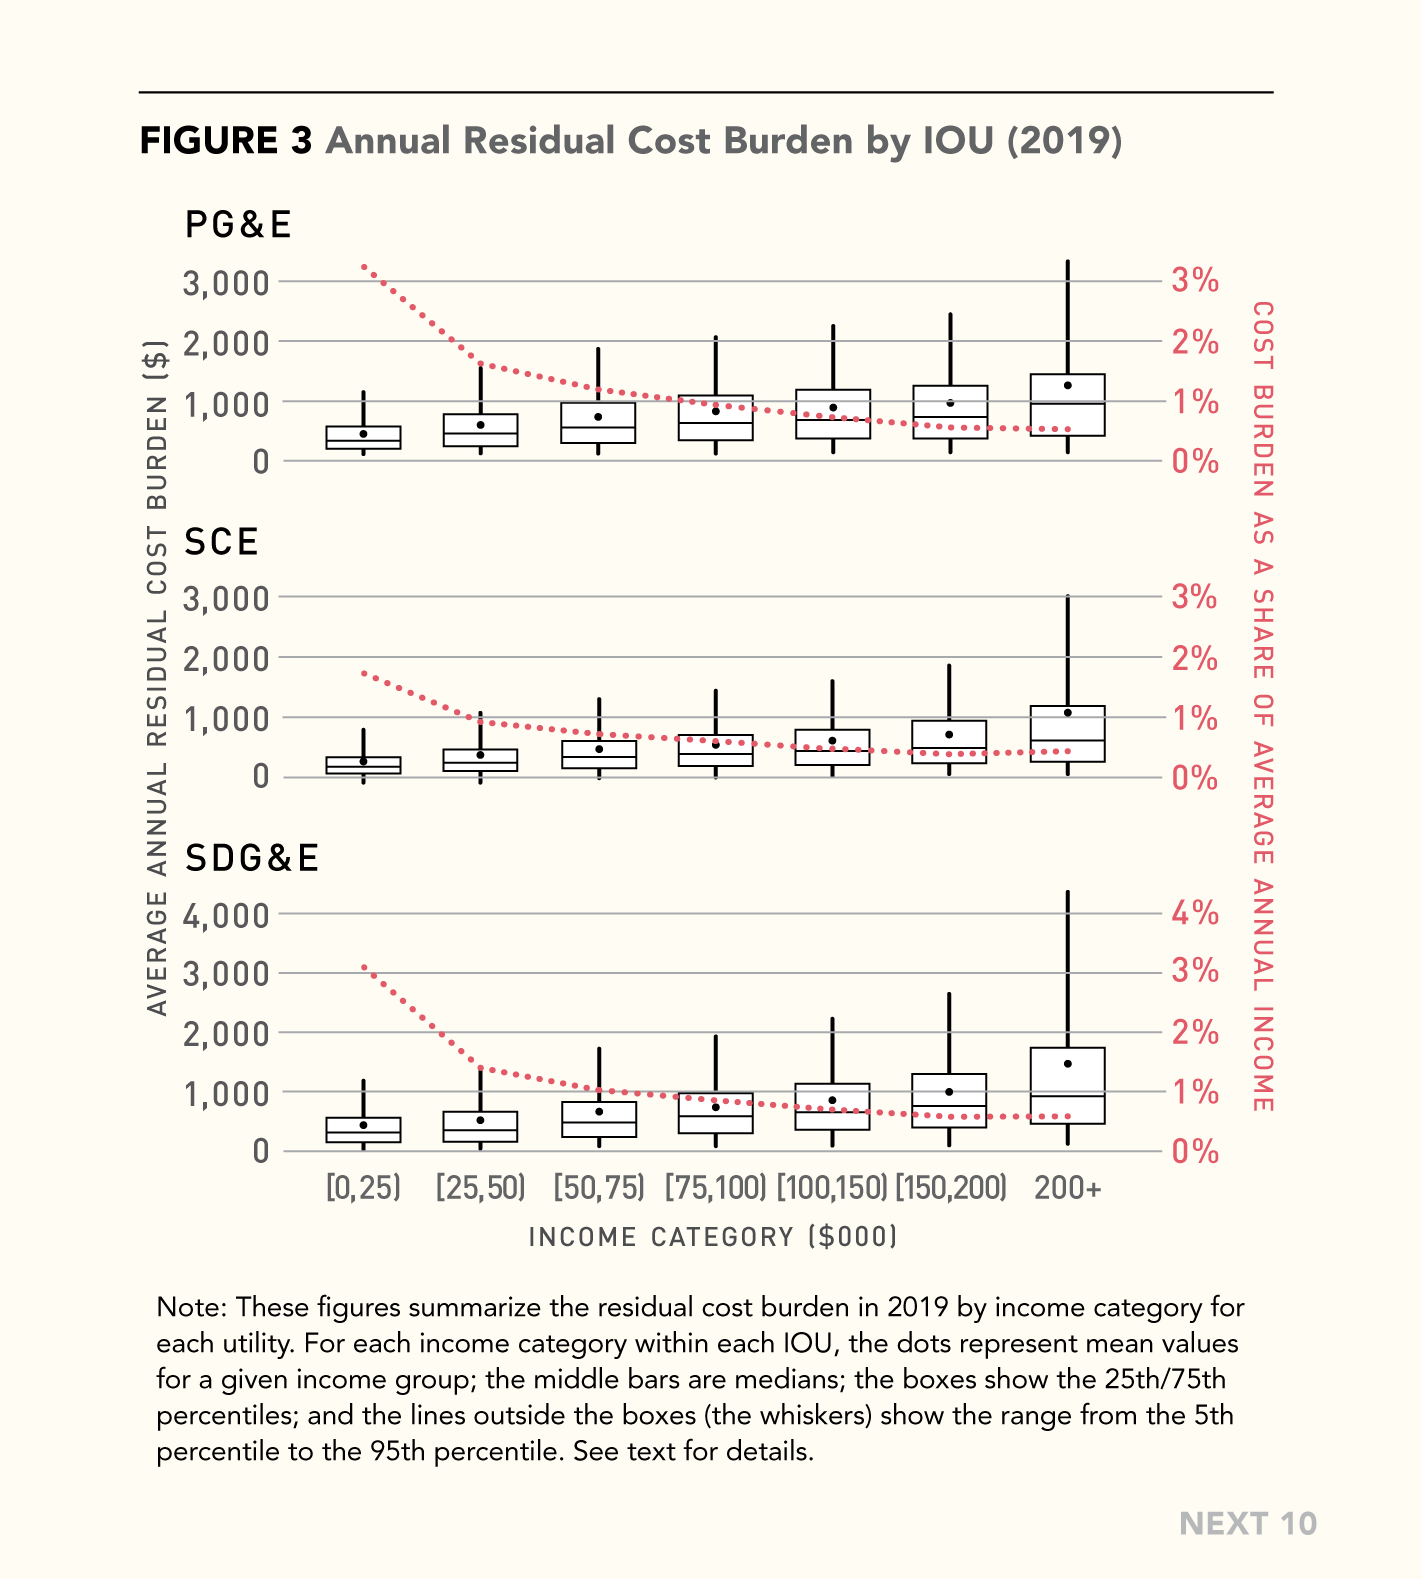
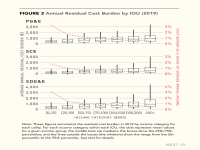
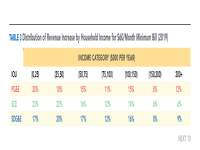
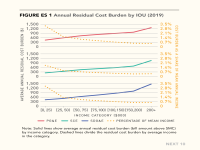
The report also finds that these high costs are being distributed inequitably because electricity bills account for a larger share of income among lower-income households. For low-income households in the PG&E and SDG&E areas, this cost recovery burden amounts to three percent of annual income on average. That’s more than three times the share of income for wealthier households. The regressive effects are magnified during times of increased energy demand, such as Californians experienced during this month’s record-breaking heat wave.
Next 10 and the Energy Institute hosted a webinar on Tuesday, October 4, 2022 at 11am PT where the authors discussed the key findings from the report and implications for policy. A recording of the webinar can be found here.
Next 10 is not the sole owner of rights to this publication. Usage of this content is subject to permissions, please contact us at info@next10.org for more information.
Featured Graphics


- Half to two-thirds of the electricity rates paid by Californians go to these residual costs.
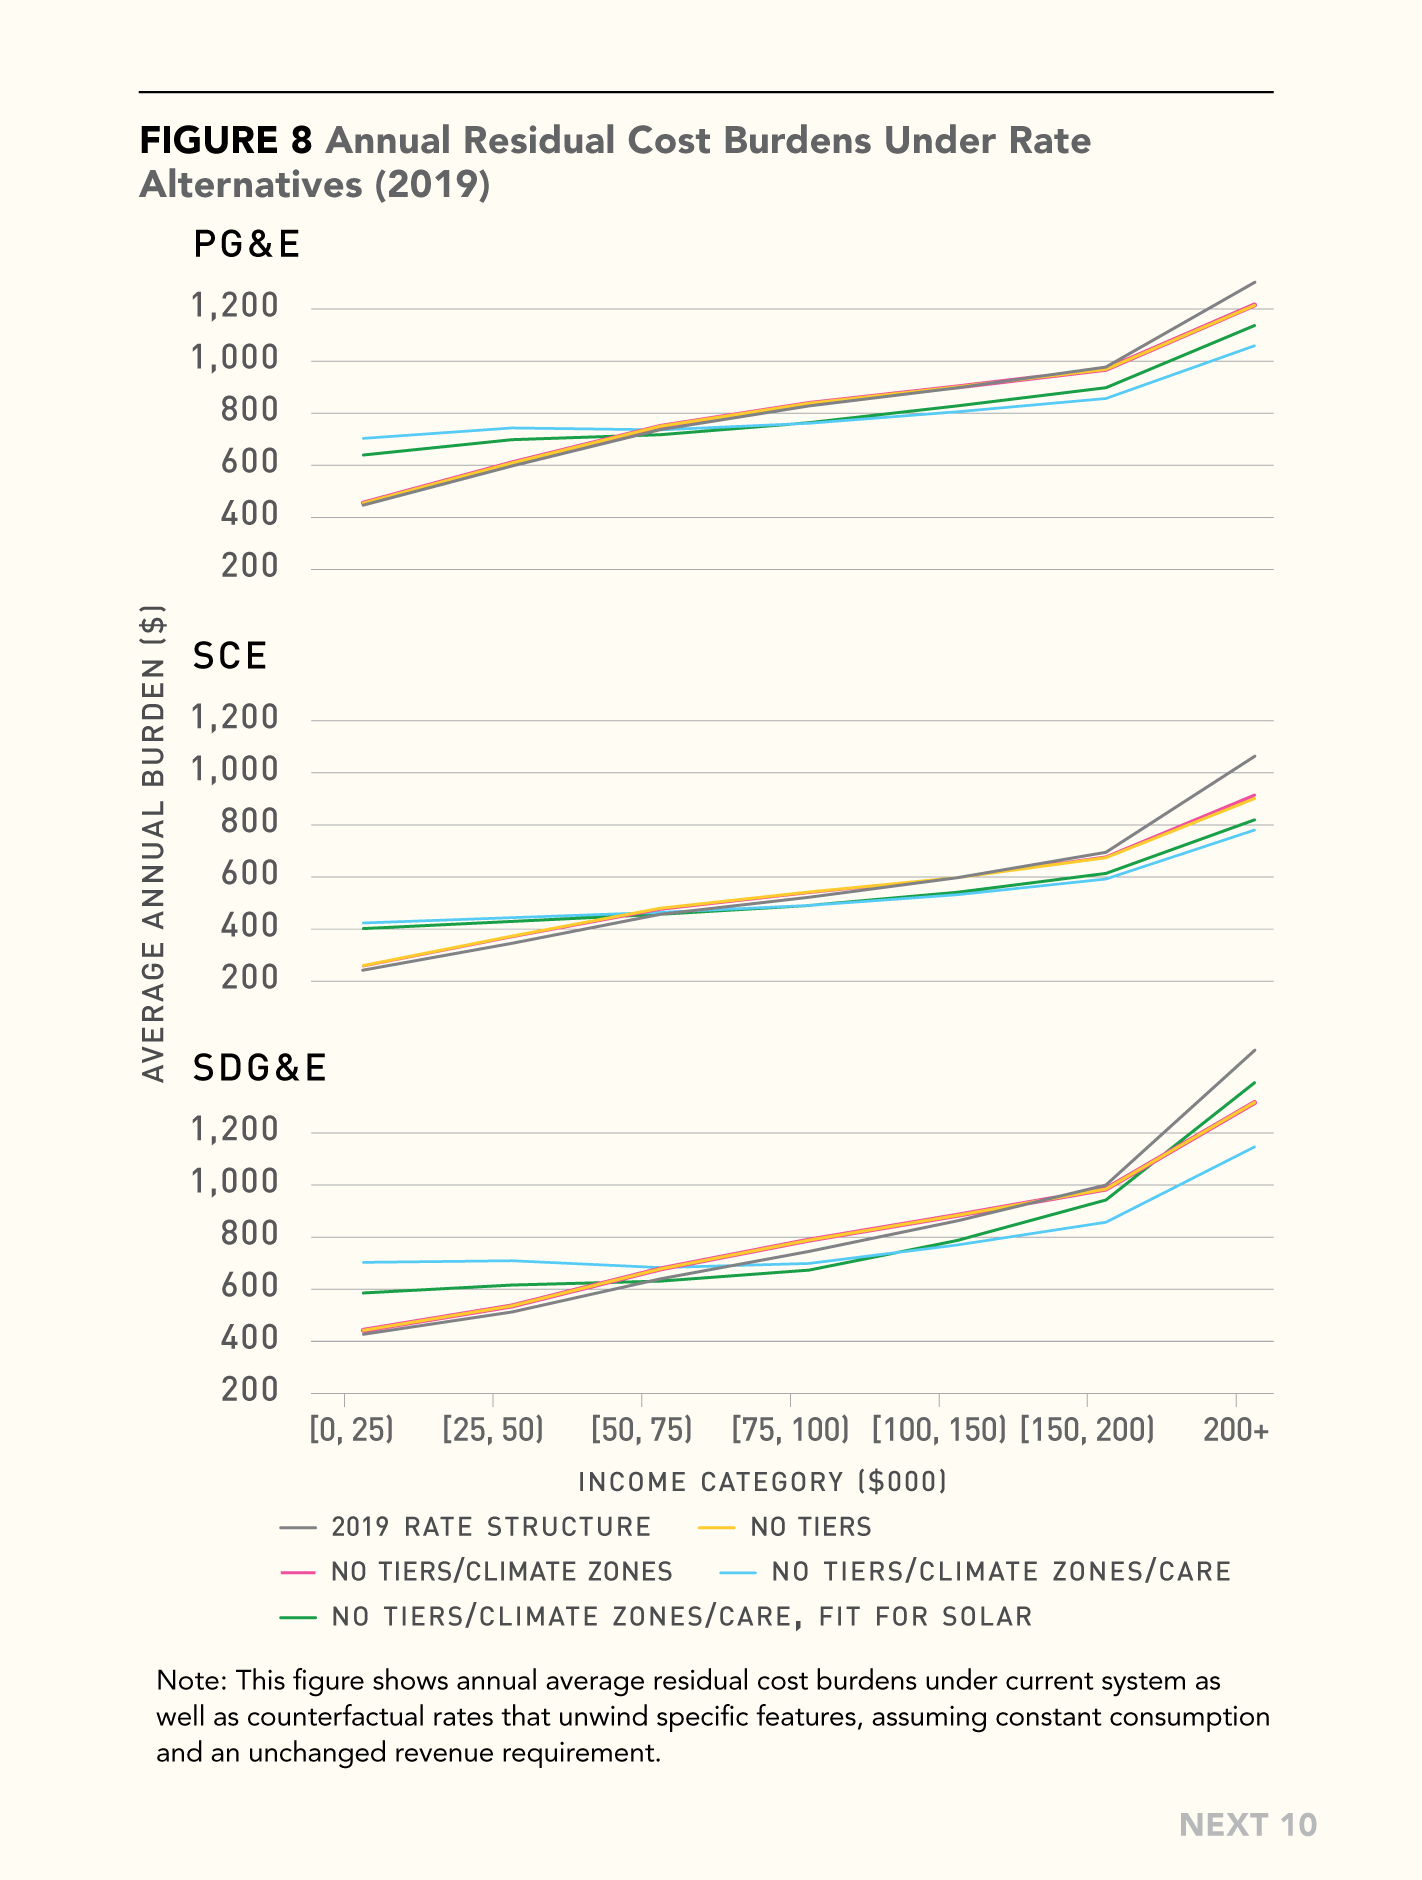
- In 2019, IOU residential customers were paying an effective electricity tax that averaged $678 per year statewide.
- During the period covered by the study, the effective electricity tax was $809 for typical PG&E customers, $512 for SCE customers, and $786 for SDG&E customers.
- Lower-income households bear a greater burden. These households are increasingly responsible for covering high fixed costs as total consumption from the grid declines and pay a larger share of their annual income for electricity.
- For low-income households in the PG&E and SDG&E areas, this cost recovery burden amounts to three percent of annual income on average. That’s more than three times the share of income for wealthier households.
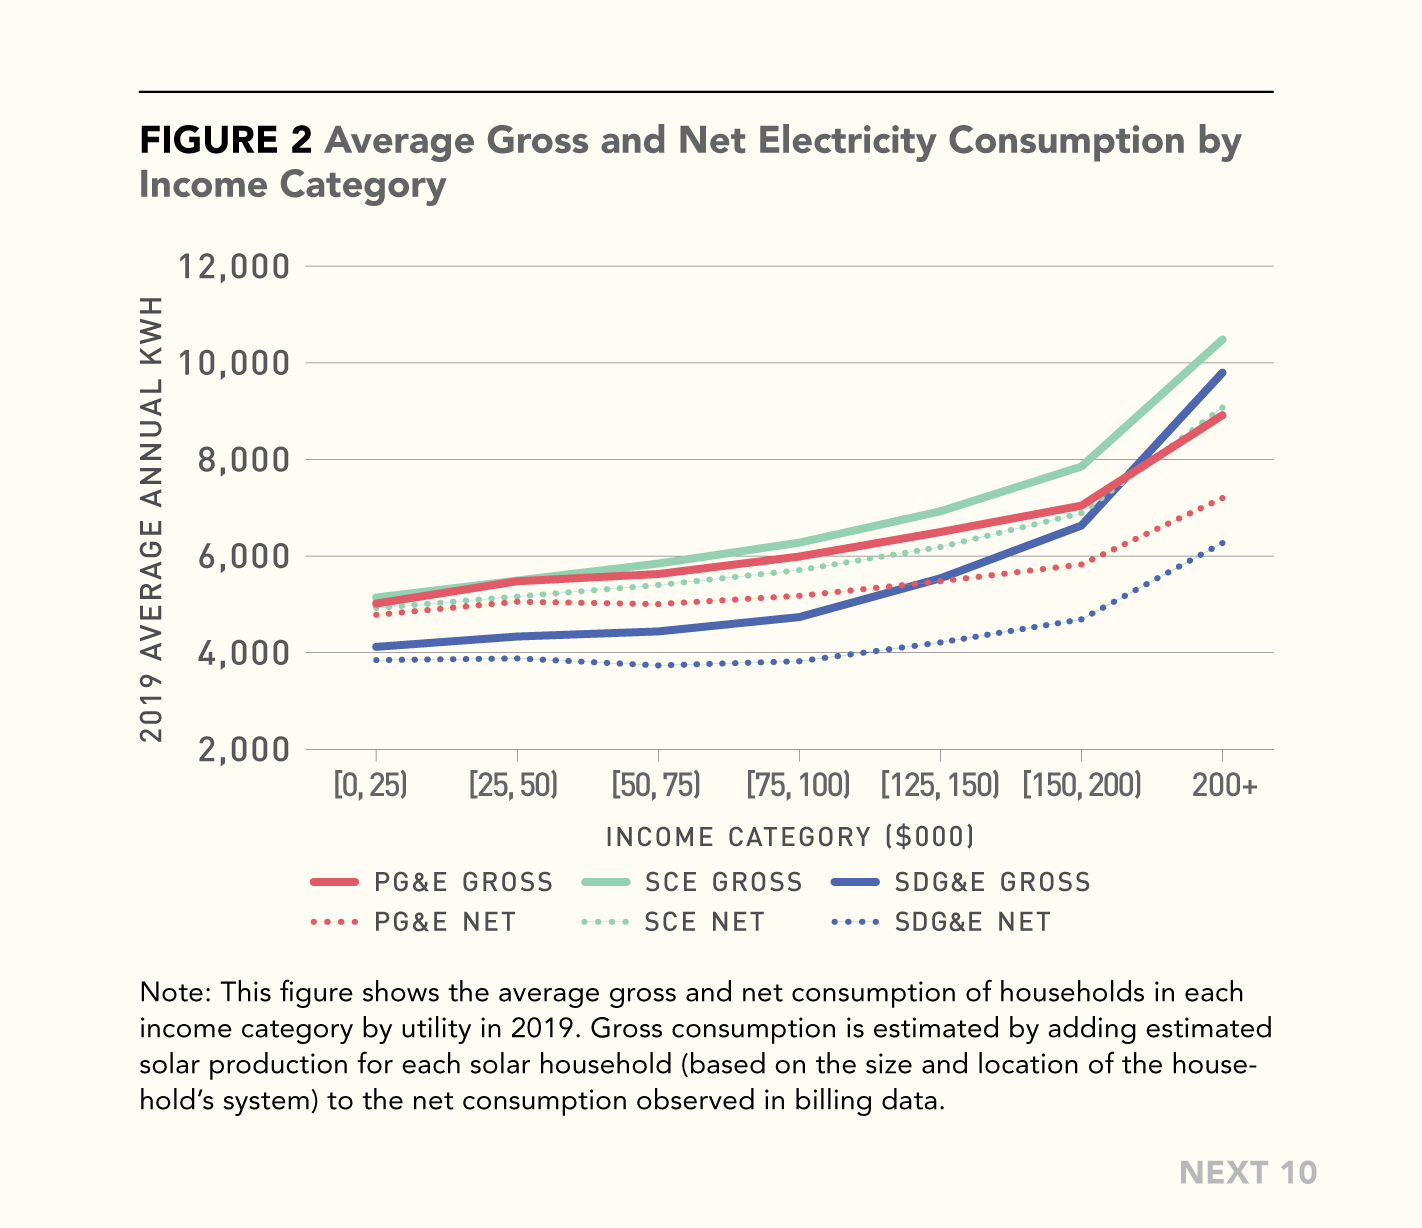
- Due largely to increasing rooftop solar ownership in wealthier households, higher-income customers now purchase only modestly more electricity than lower-income households (despite higher electricity demands), leaving lower-income earners to pay an increased share of the fixed costs.
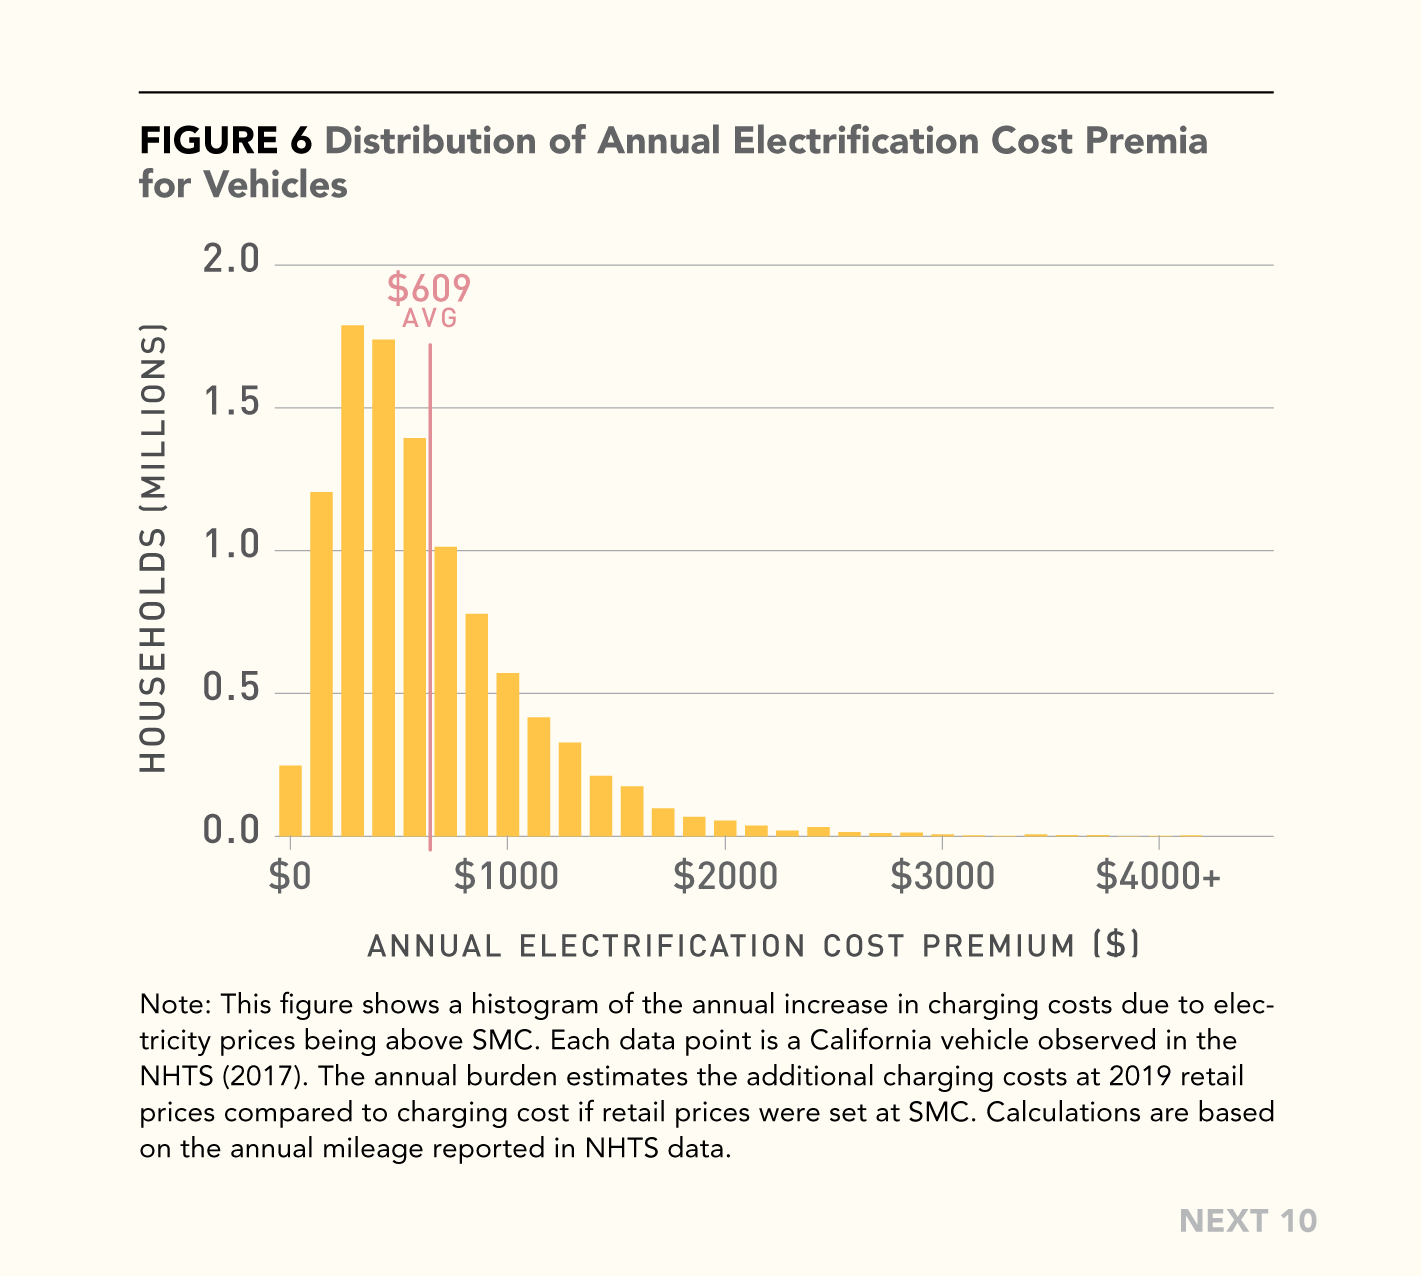
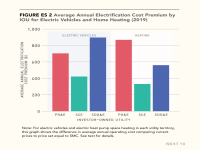
- High electricity rates create barriers to electrification of vehicles and home heating. California's strategy for rapidly accelerating consumer ZEV purchases is at risk if potential buyers continue to face high prices for the electricity to operate them.
- The average cost to charge an EV is around $600 per year more than the actual costs of providing the electricity. Based on previous research on EV demand in California, this electrification cost premium has likely reduced EV adoption by between 13 and 33 percent.
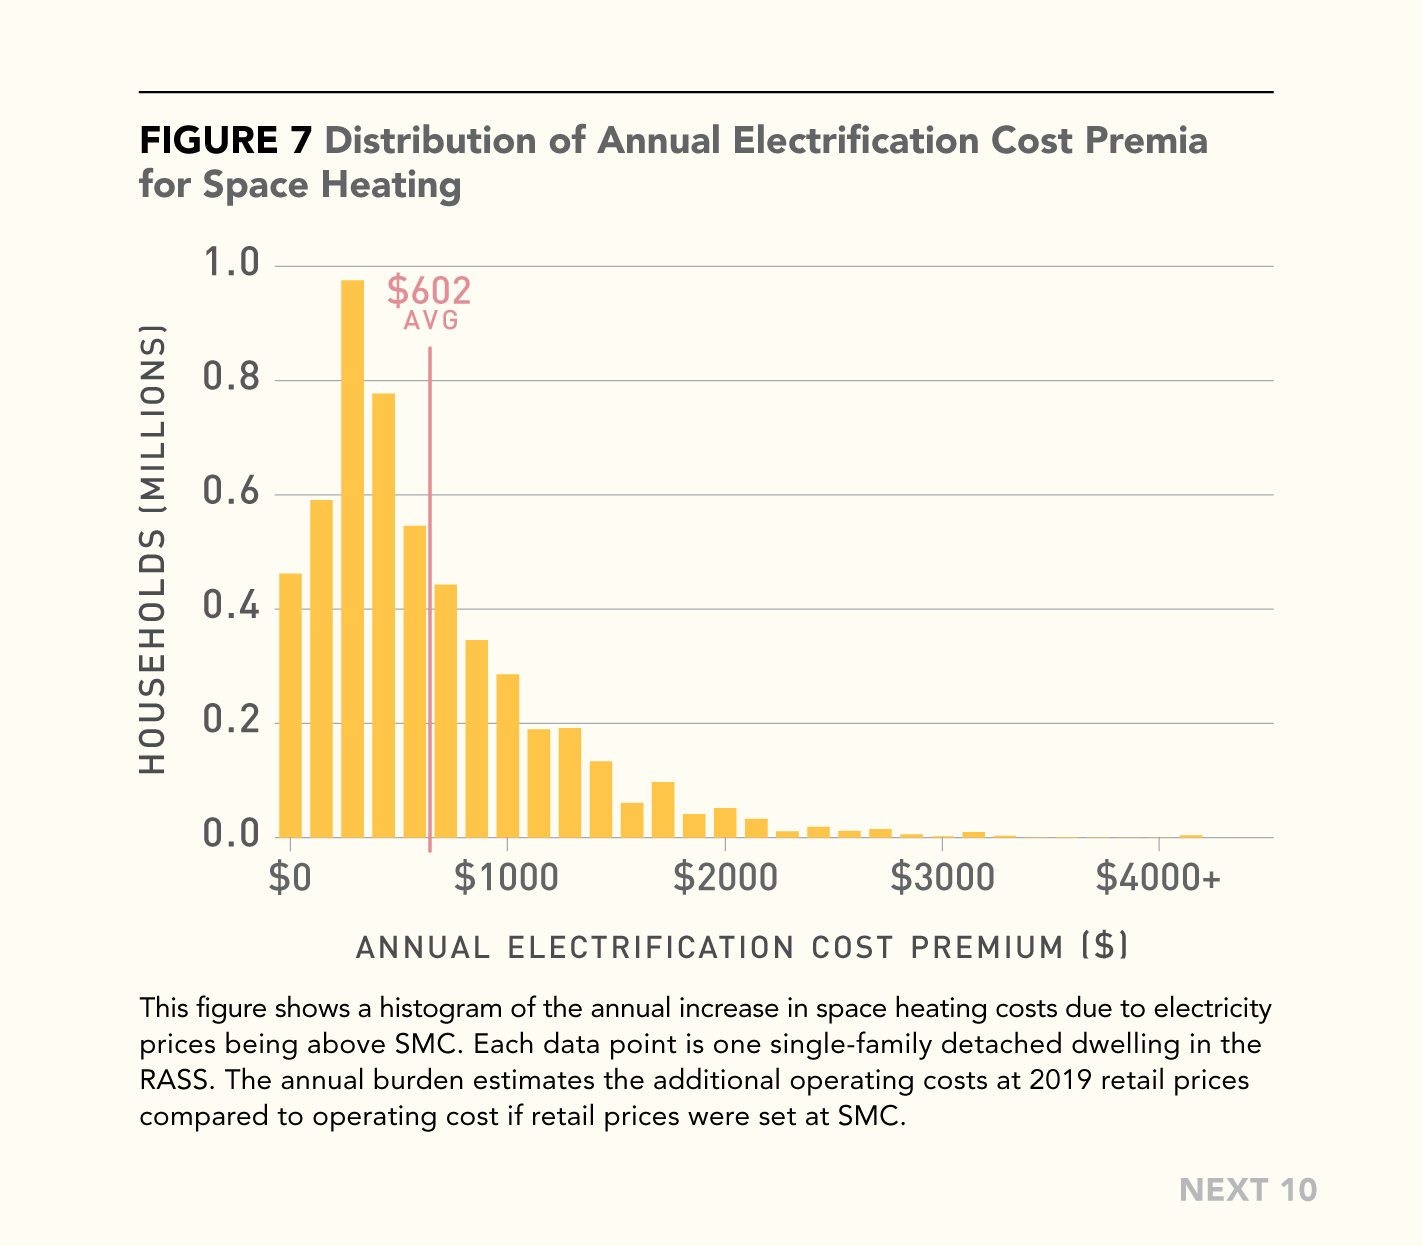
- In a similar analysis of residential space heating, the authors find that adjusting retail electricity prices to reflect the actual cost of supply (including emissions costs) would likely increase electric heat pump adoption by about one-third. Using 2019 retail prices, the average heating electrification cost premium exceeds $600 per year.
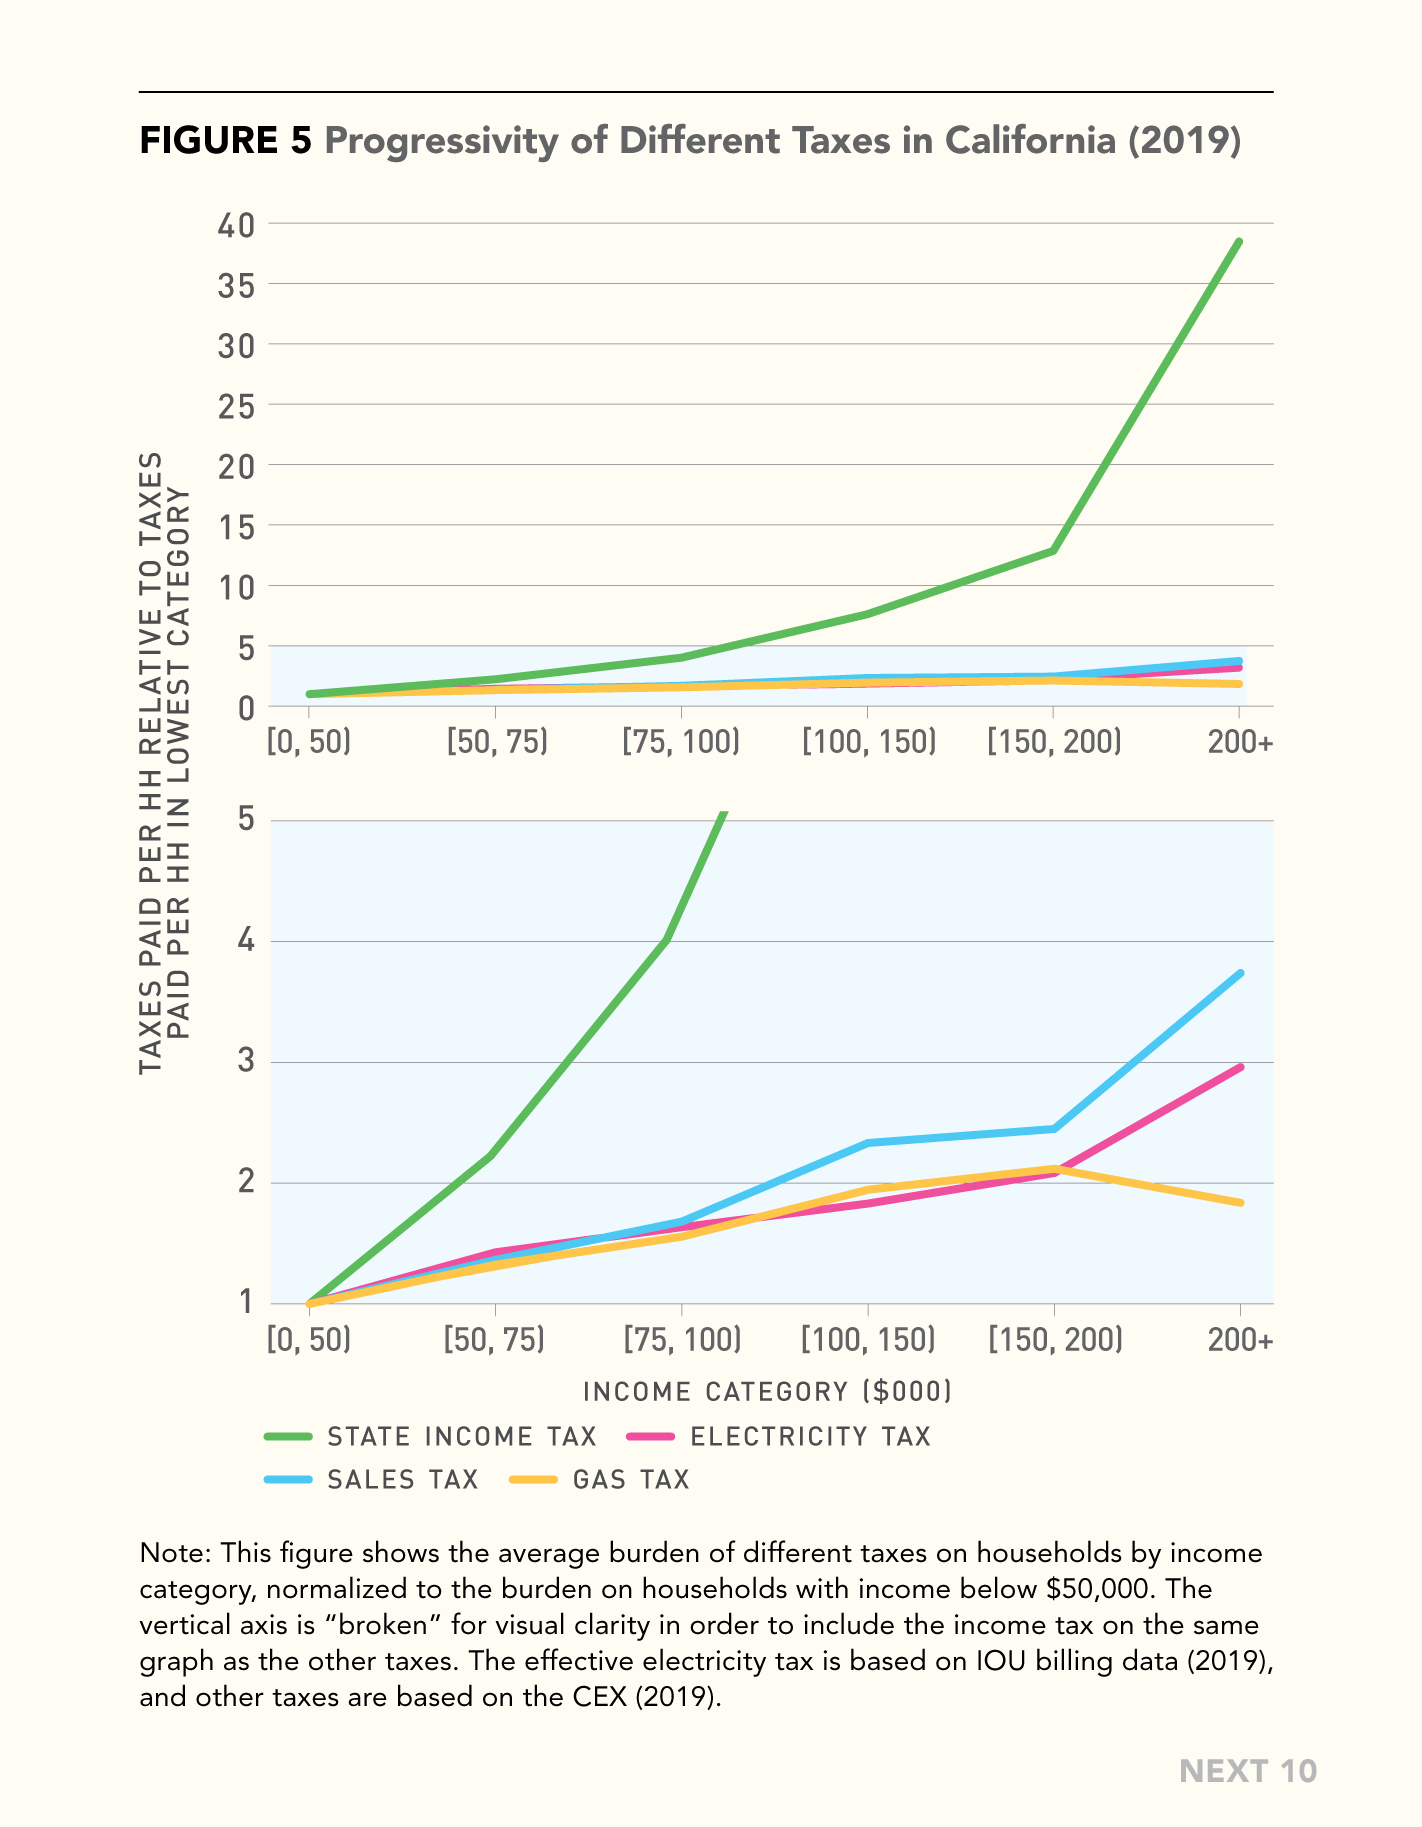
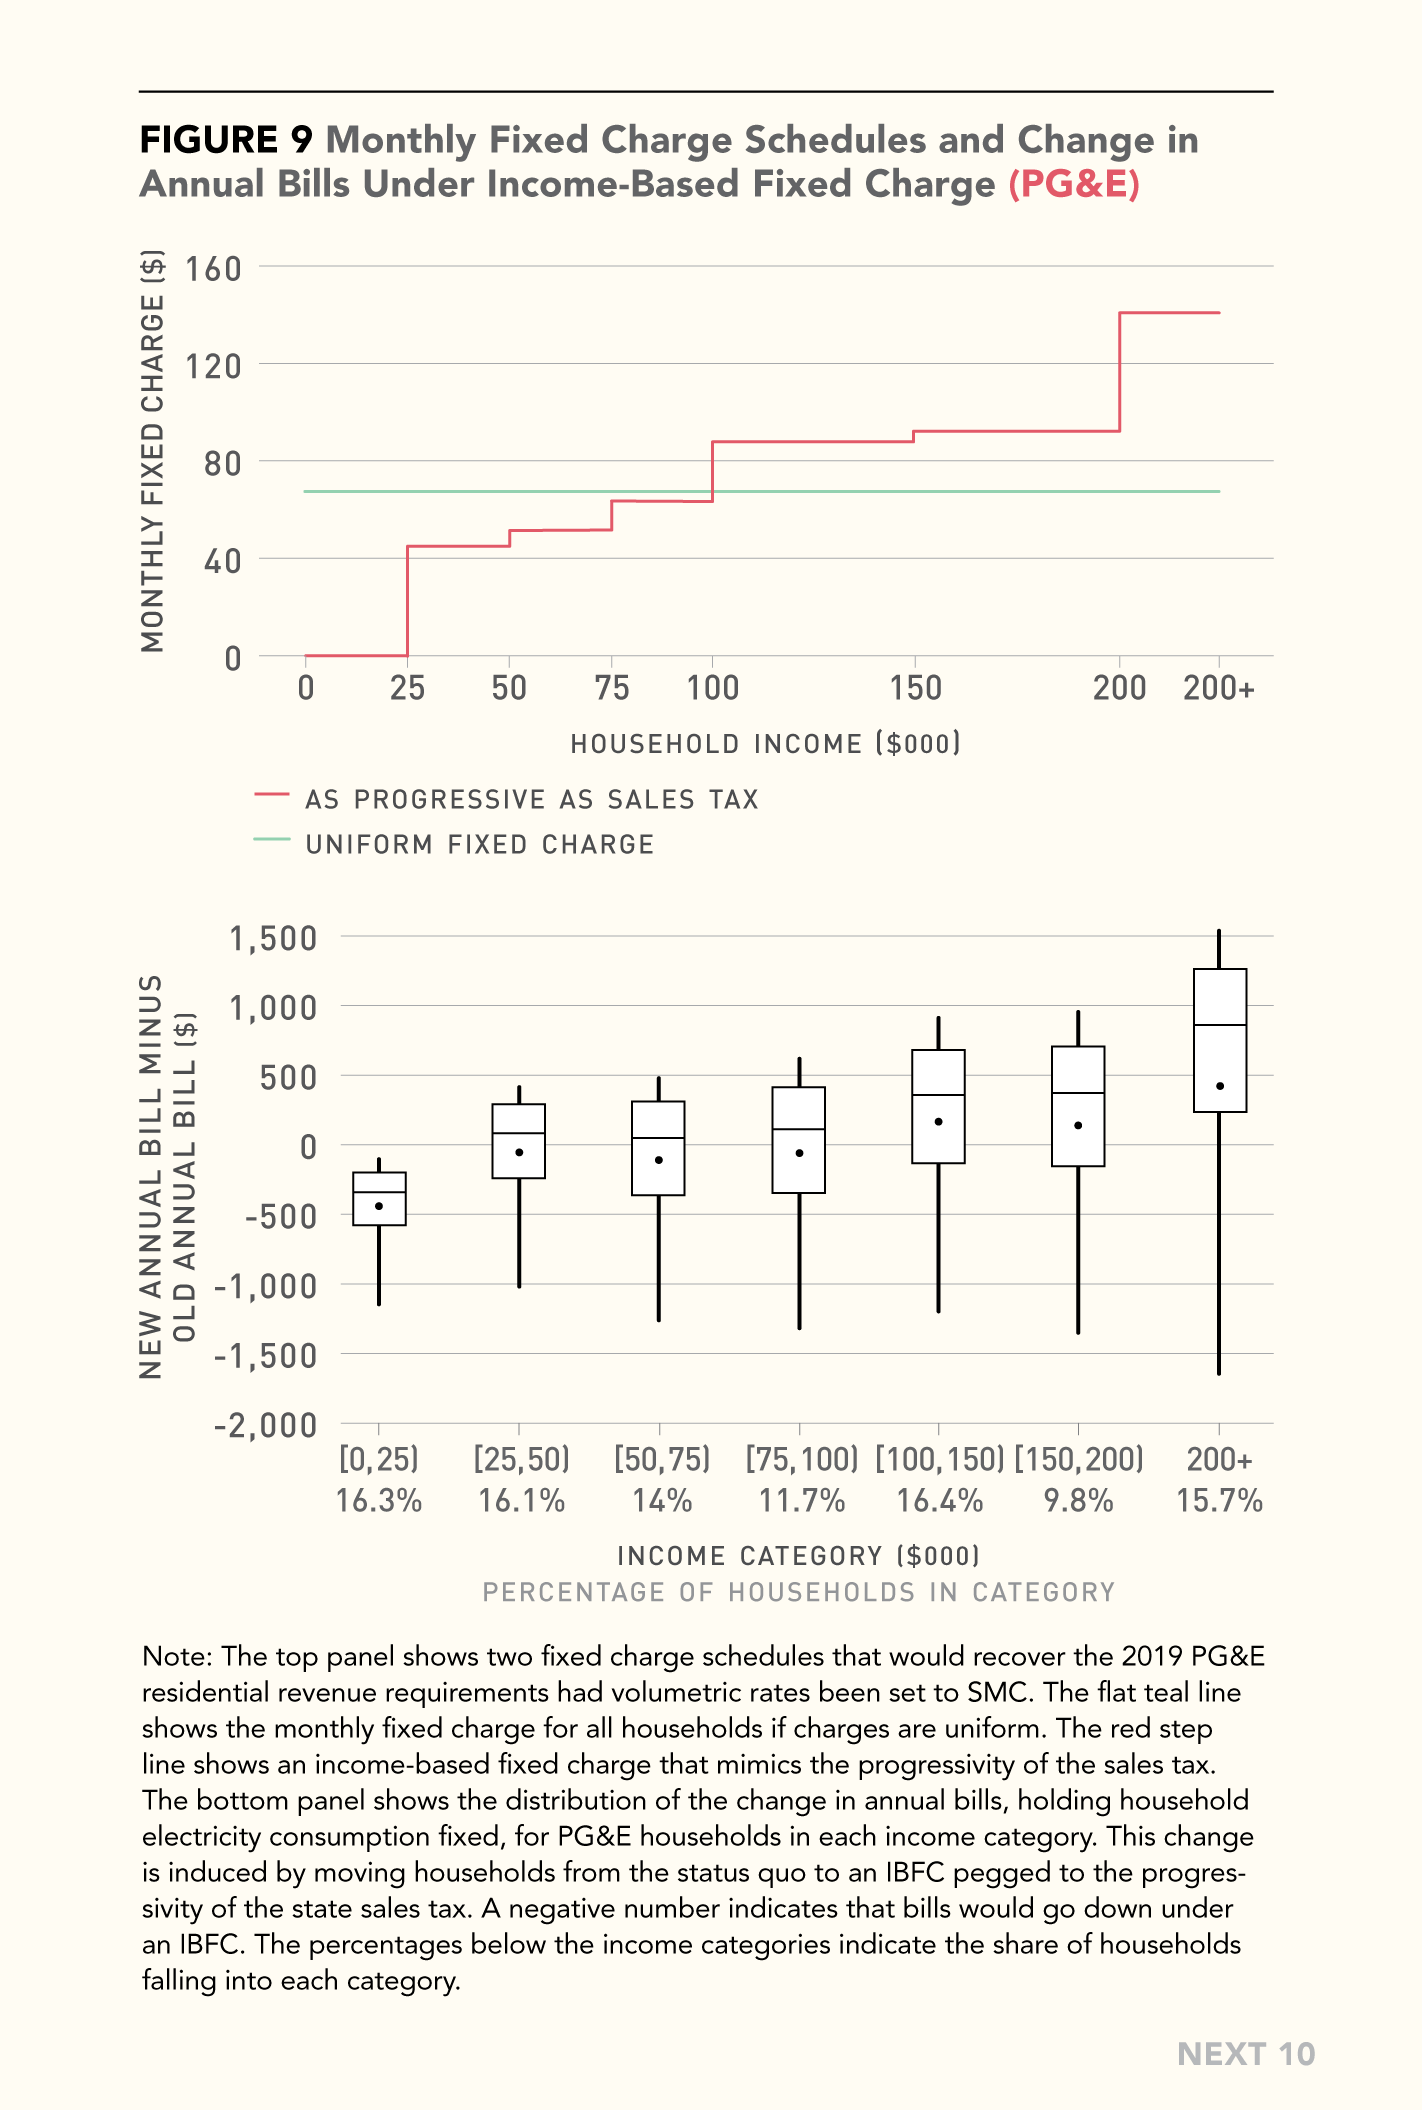
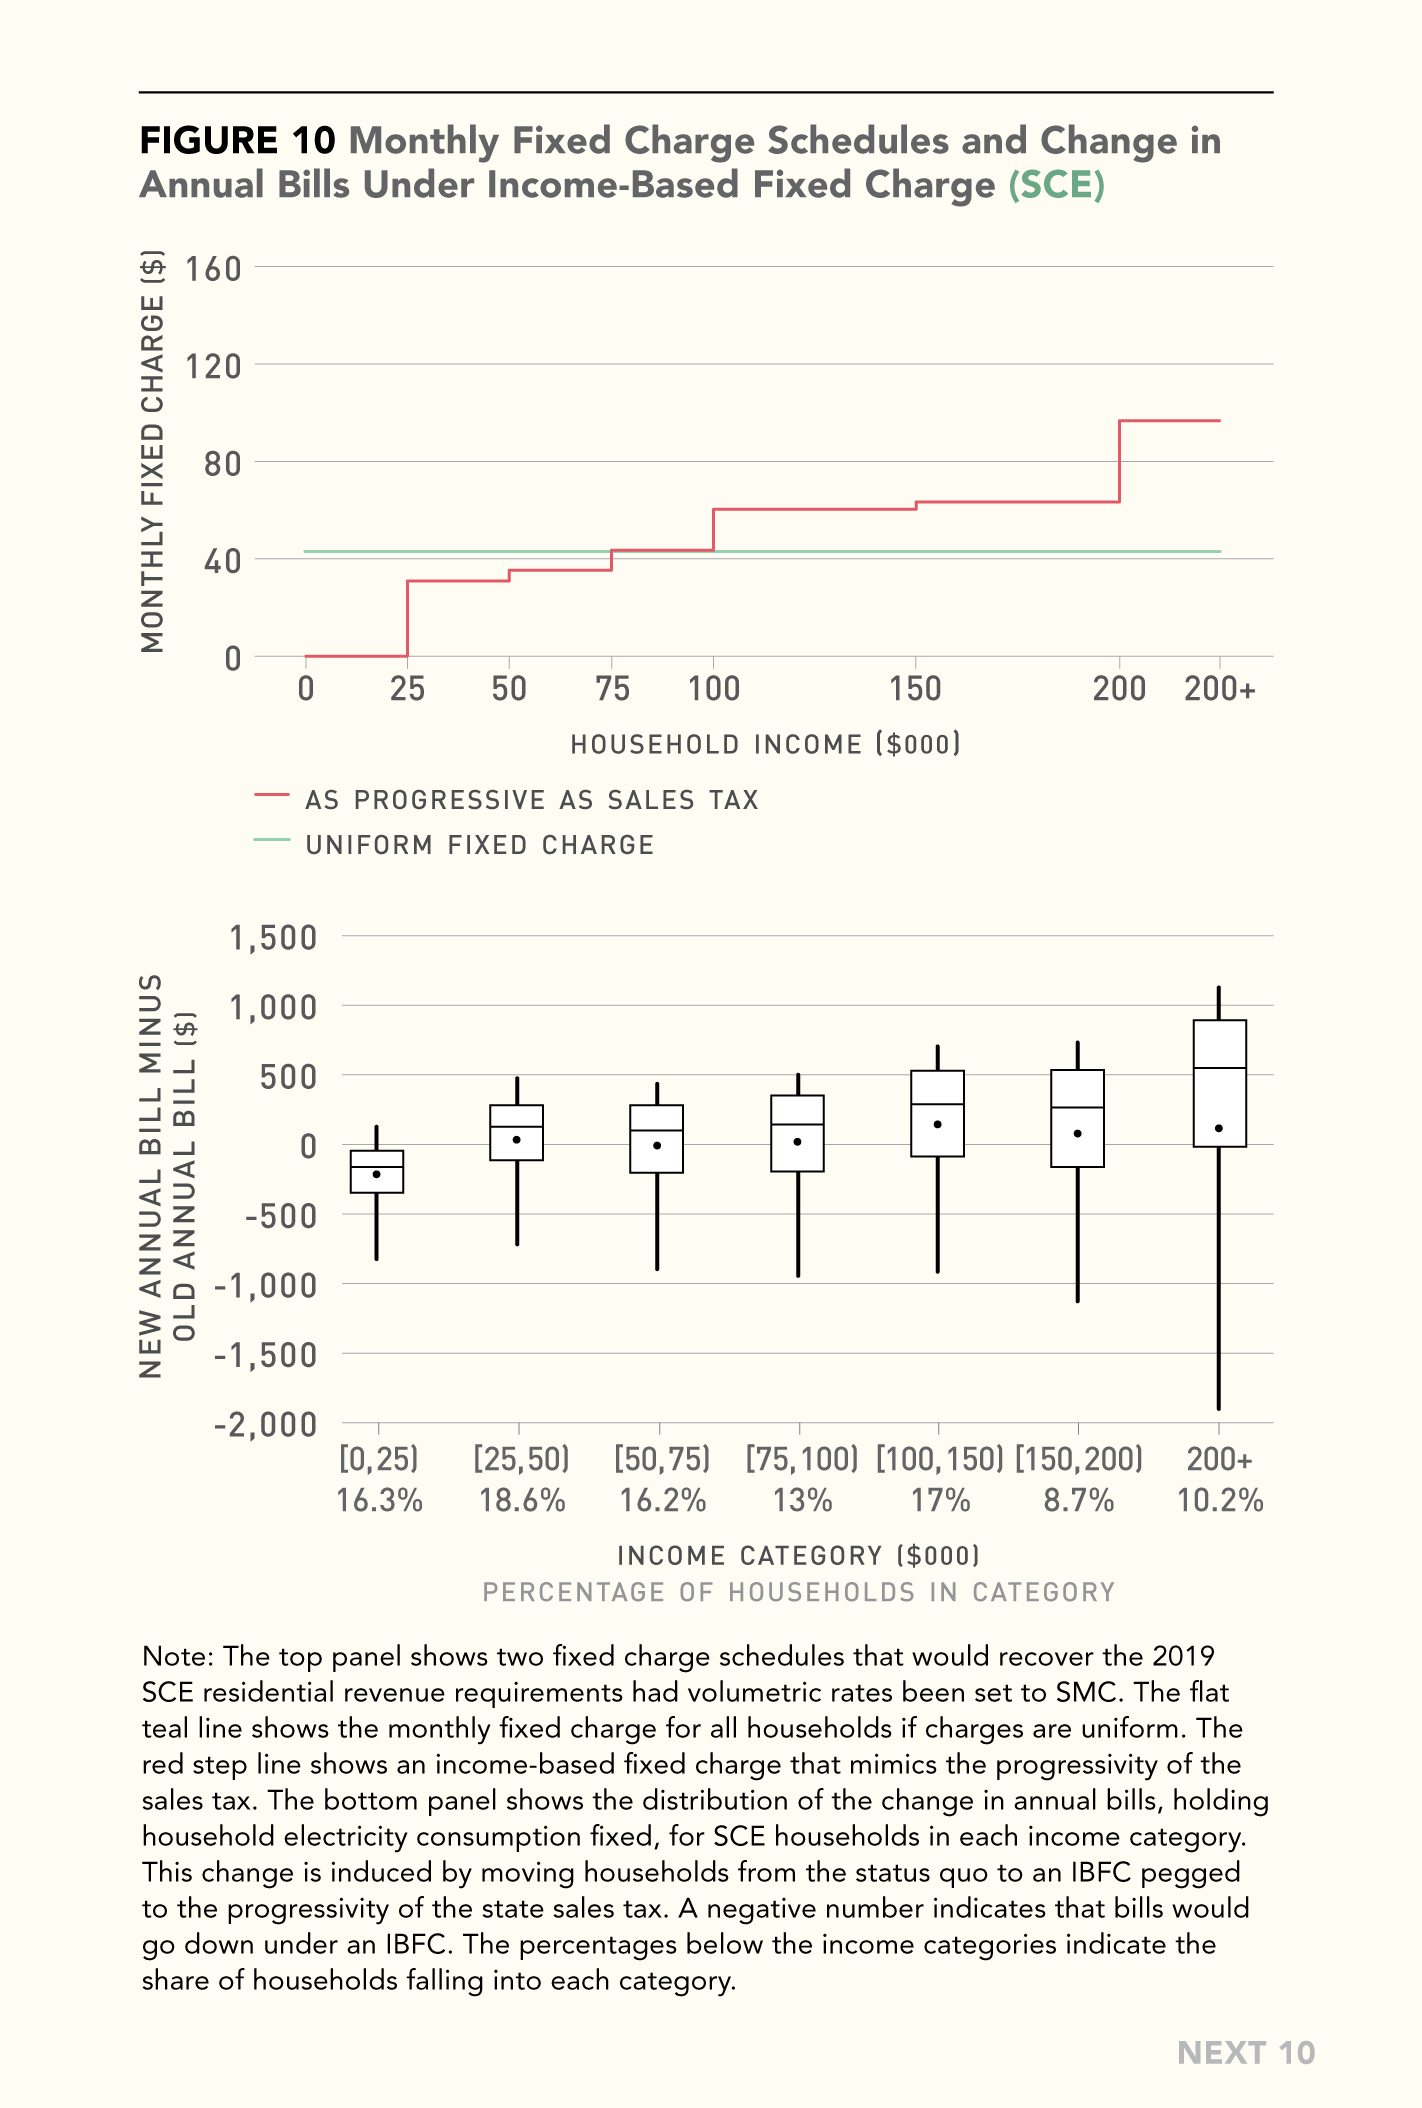
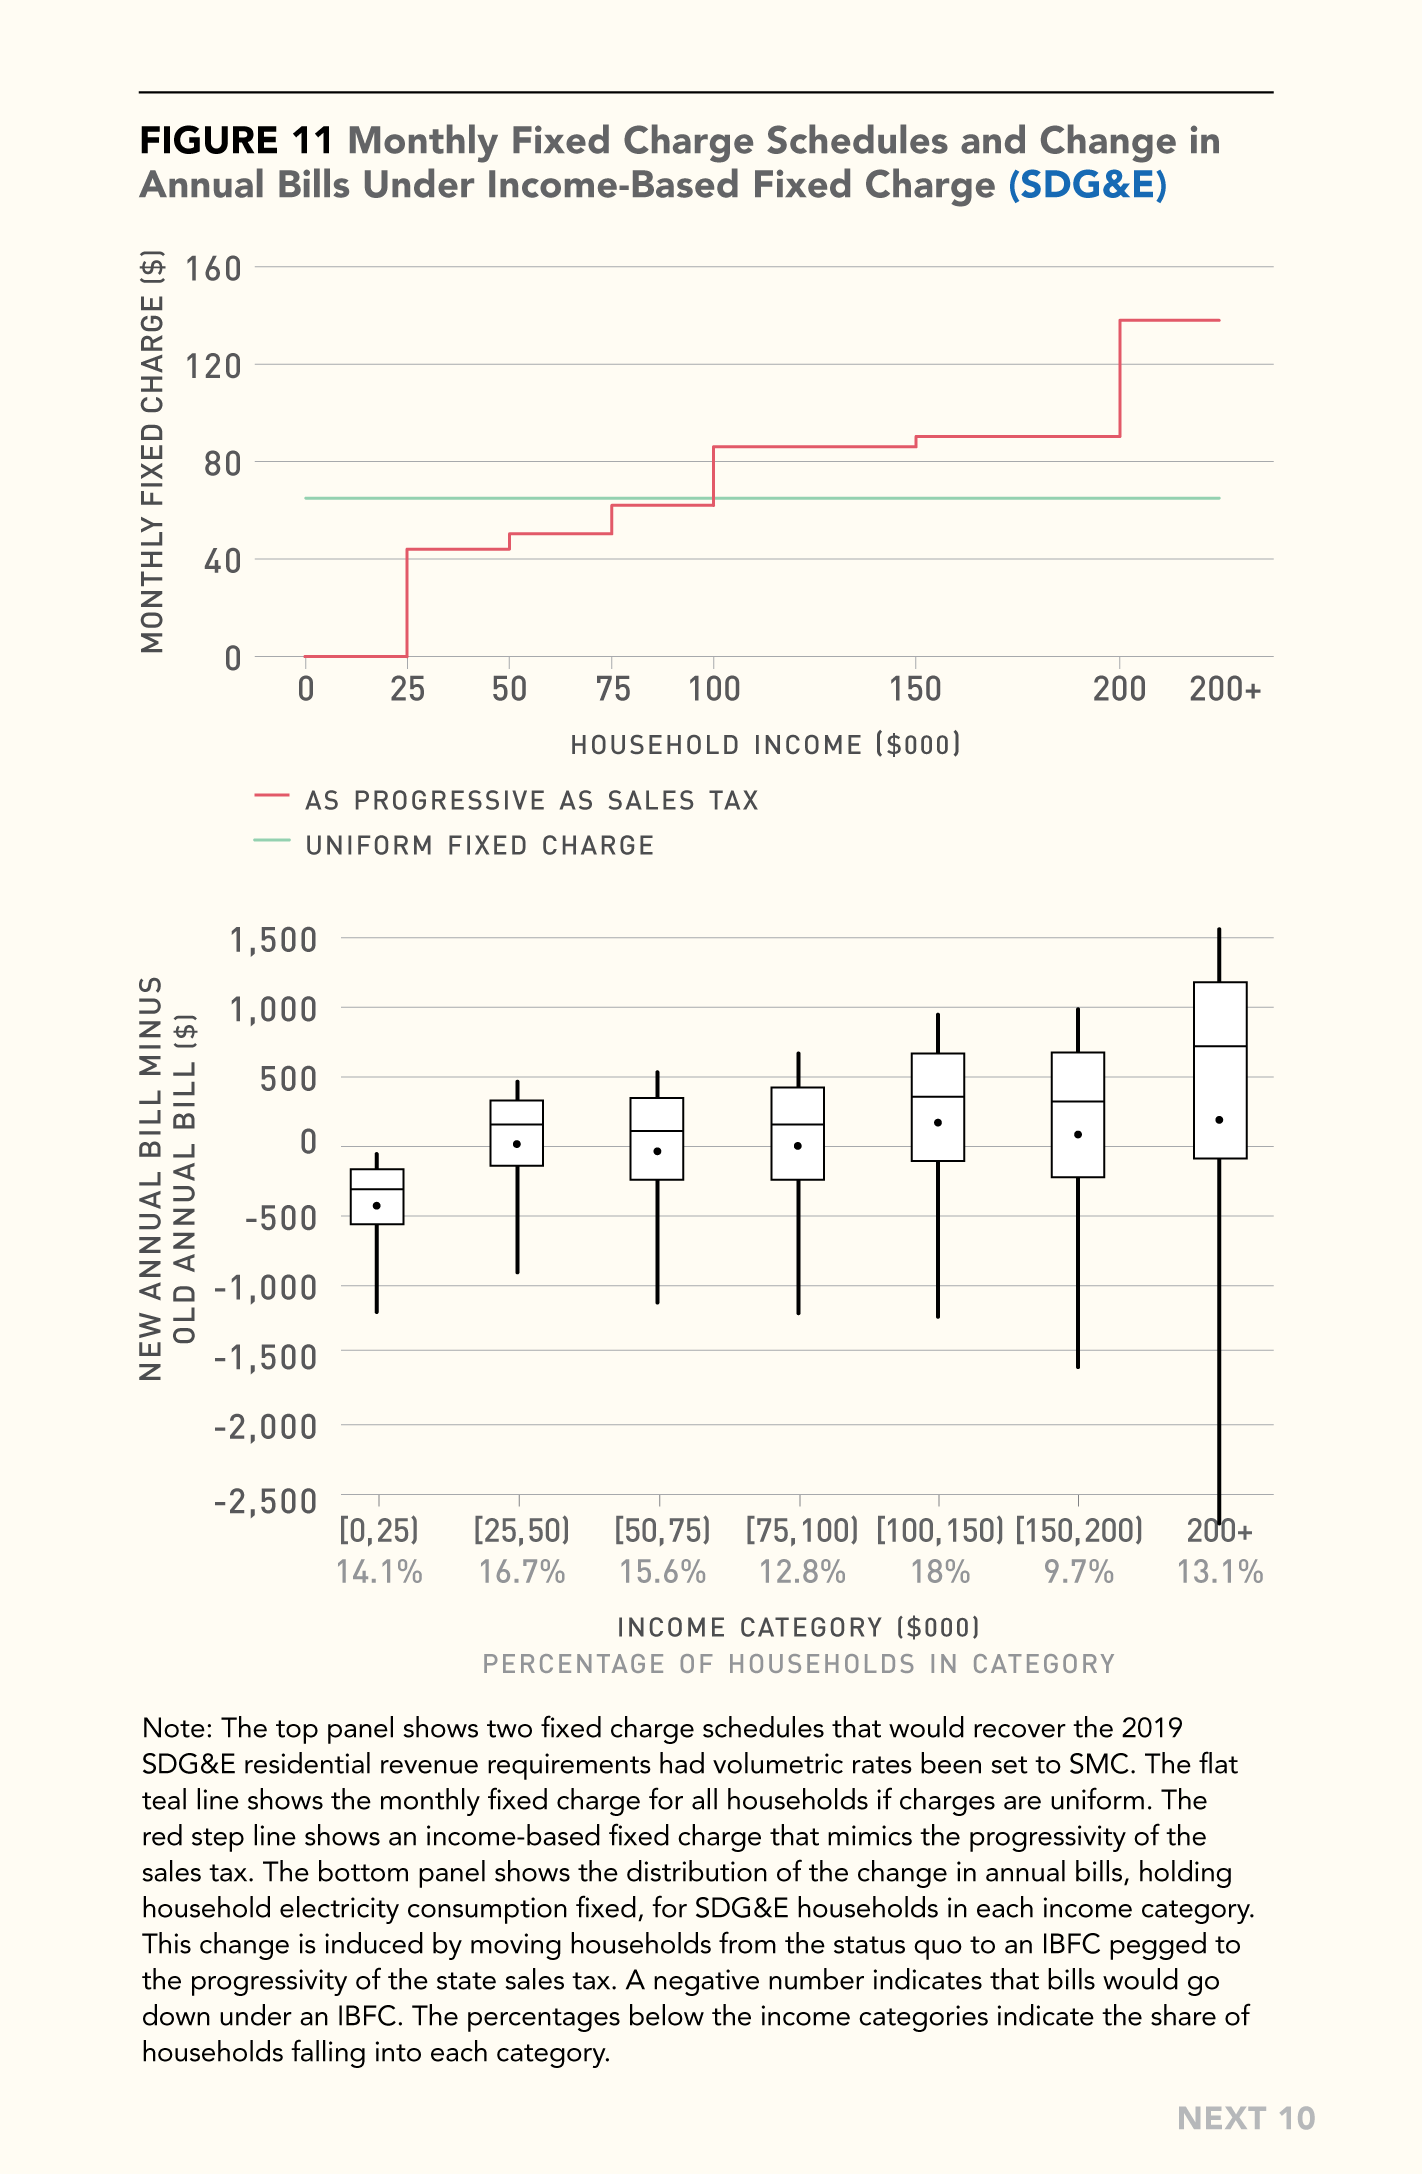
- A more equitable model would be to shift some fixed costs to the state budget, or implement an income-based fixed charge. The report suggests potential changes to how utility fixed costs, as well as and environmental and low-income program costs, are recovered, including:
- State budget: Remove a portion of fixed utility costs from what consumers pay, and instead fund them through the state budget, which is financed primarily with more-progressive income and sales taxes.
- Income-based fixed charge: Require utilities to develop an income-based monthly customer fixed charge that allocates the residual cost burden in a more progressive way.
Next 10 cannot grant permission to use graphics from this publication; additional permissions may be required from the copyright holder. Please view our Terms of Use policy for more information or contact Next 10 at info@next10.org with any questions.