
Publications
2026 California Green Innovation Index
The 18th annual California Green Innovation Index finds that total greenhouse gas emissions fell between 2023 and 2024, dropping by 3.9% to 346 million metric tons of carbon dioxide equivalent (MMTCO2e), an improvement over the record 3.0% reduction the previous year. Notably, emissions in 2024 were also 6.3% lower than they were during the COVID-19 pandemic shutdown in 2020. Most of the decrease in emissions came from in-state electric power generation, where emissions fell by 9.5% from 2023 to 2024 (Figure 1). There was an 8.6% decrease in emissions from the residential sector as well, and emissions from the heavy-duty vehicles sub-sector continued to fall by double digits with a 17.5% reduction from 2023 to 2024.
Within the transportation sector, California met the 2025 goal of 1.5 million zero-emission vehicles (ZEVs) on-road two years early in April 2023. To reach the 2030 goal of 5 million ZEVs on-road, ZEV registrations in California need to increase by an annual average of 17.5% from 2026 to 2030, relatively unchanged from the 17.45% needed from 2025 to 2030 (Figure 21). ZEV adoption has slowed since the federal $7,500 tax credit for new EVs and the $4,000 tax credit for used EVs expired at the end of September 2025. In 2024, ZEVs accounted for 25.5% of total new vehicle registrations but fell to 24.4% in 2025. However, the number of electric light-duty pickups, SUVs and vans registered surpassed a million units for the first time in 2025, with 1.24 million vehicles registered, up 28.7% compared to 2024. The percentage of registered vehicles on-road that are ZEVs reached 7.5% in 2025, up from 6.5% in 2024. Public transit ridership remained 22.0% lower in 2025 than the pre-pandemic level in 2019, with just a 1.5% increase in ridership from 2024 to 2025, which is markedly lower than the 9.0% growth from 2023 to 2024.
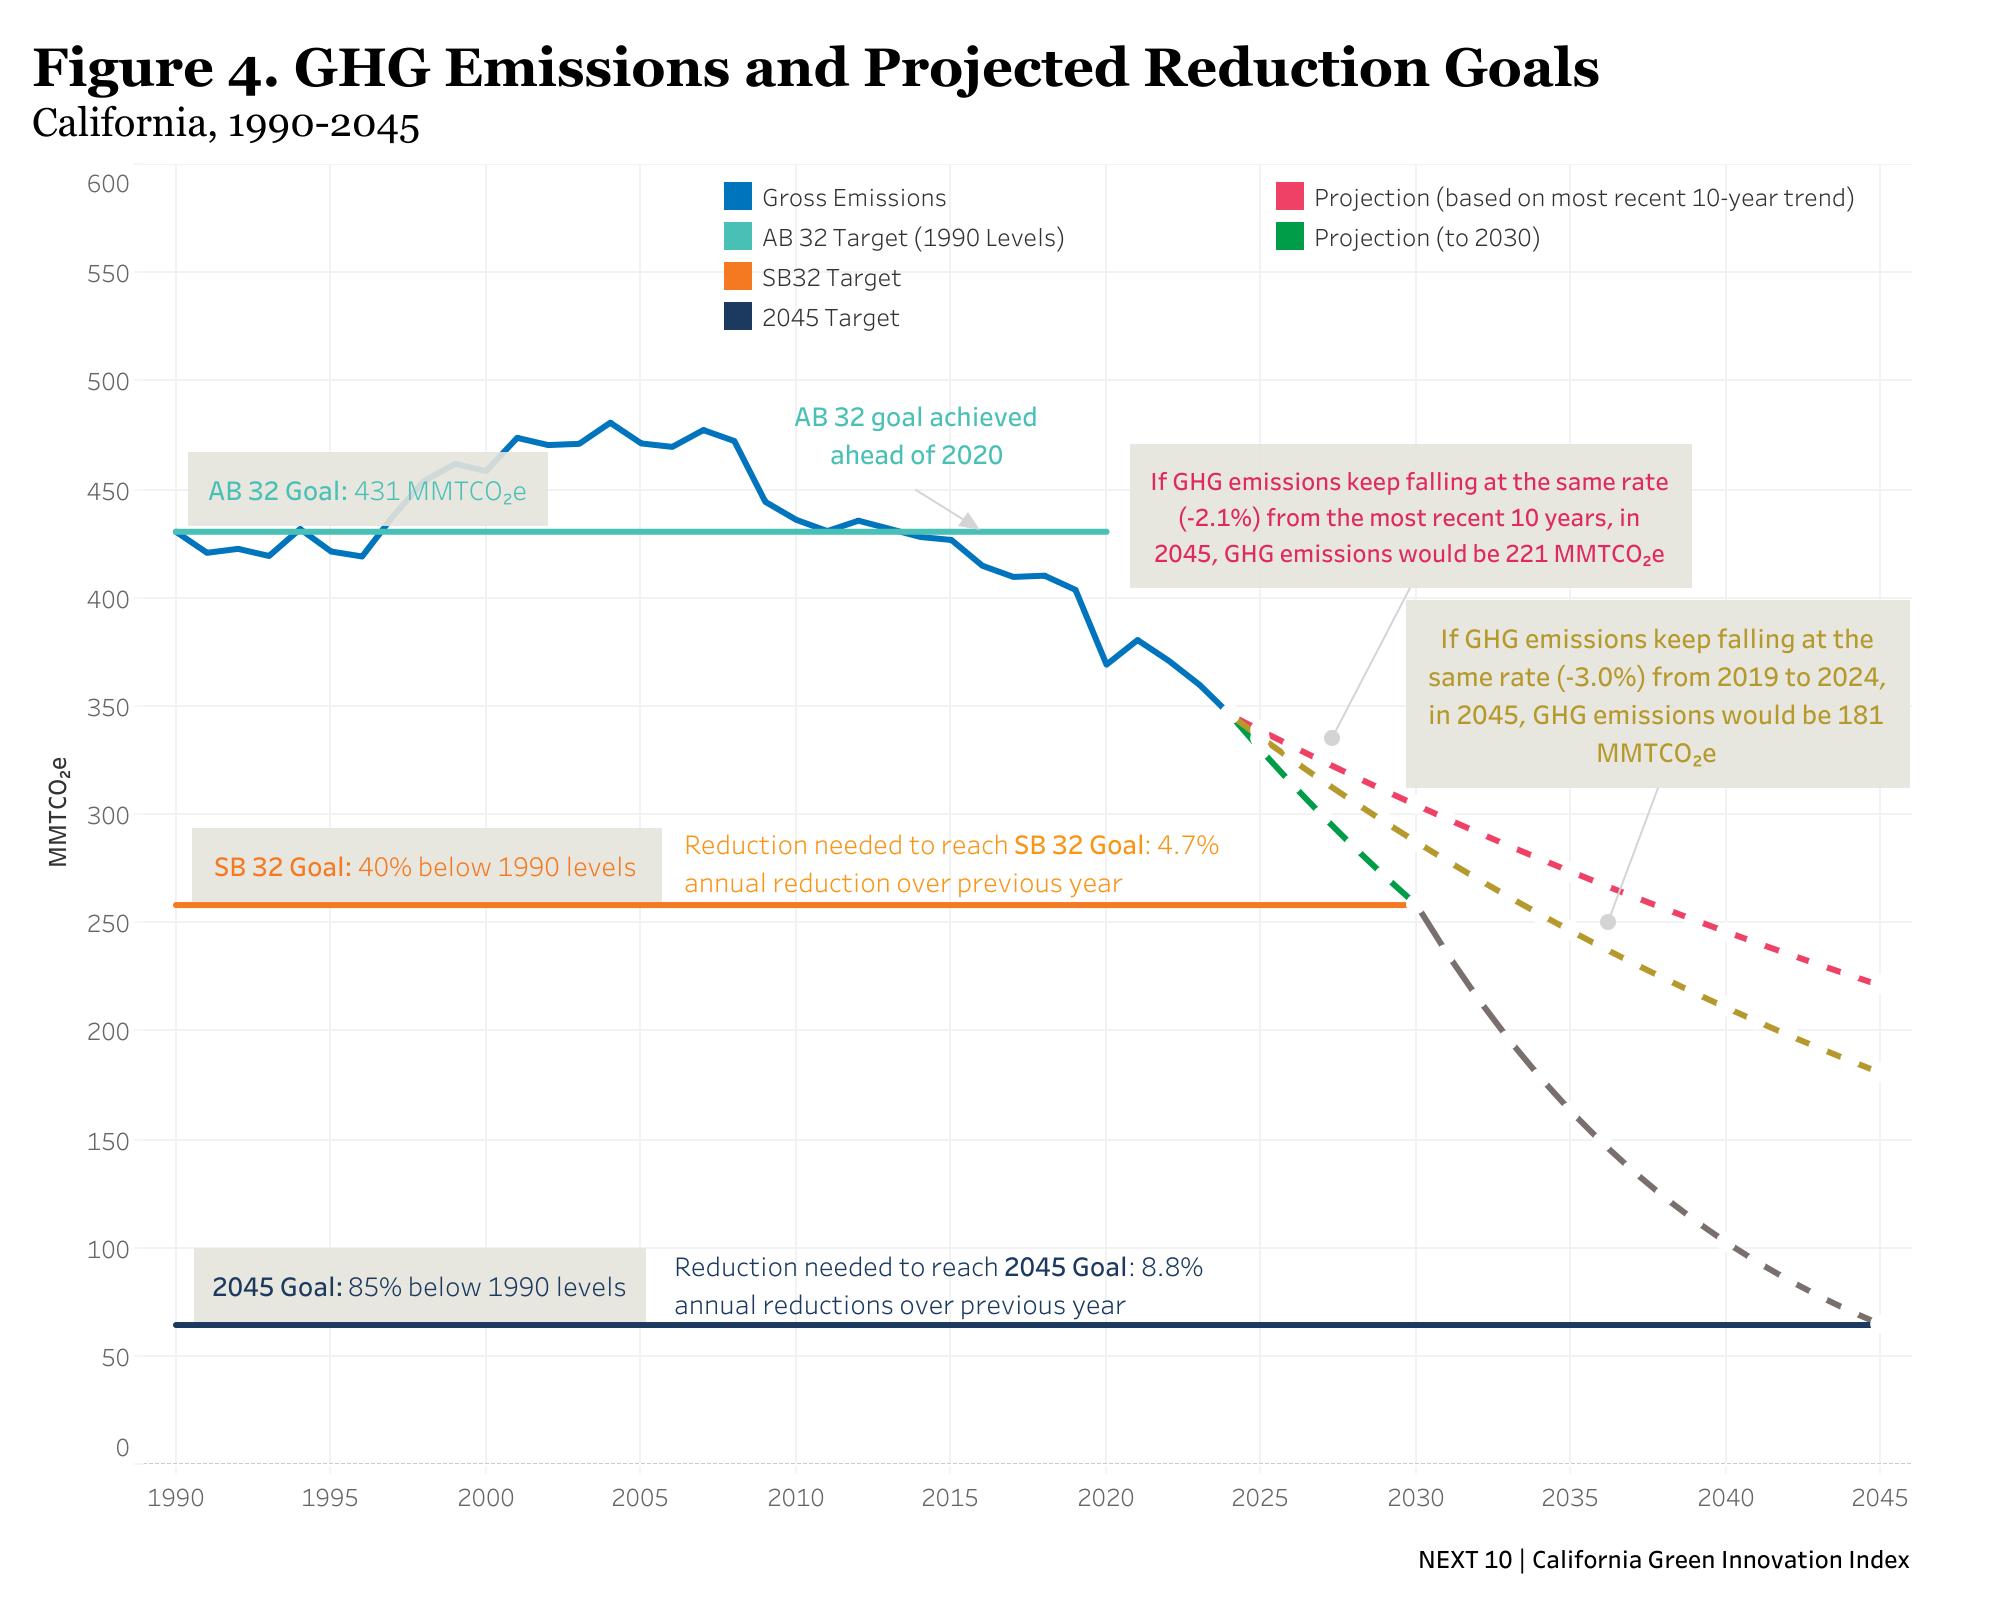
California is not currently on track to meet the 2030 emissions target of nearly 260 MMTCO2e (or 40% below 1990 levels) on time. To do so, California would need to reduce emissions by 4.7% annually on average as of 2024 — up from the 4.4% needed in 2023 and the 4.2% needed in 2022 (Figure 4). From 2019 to 2024, emissions have only decreased by 3.05% annually on average. Using this trajectory, the state would meet the 2030 goal in 2034. Even if the state met the 2030 goal on time, emissions would need to fall at a pace of 8.8% per year to reach the goal by 2045—nearly double the pace required to meet the 2030 target. However, using the recent average annual reduction of 3.05%, emissions would need to decrease by 9.5% on average each year from 2030 to 2045 to meet the 2045 goal on time.
Since the passage of AB 32 in 2006, emissions have fallen significantly in most sectors, highlighting the impact of that historic legislation (Figure 3). The largest decrease has been from electric power generation where emissions have fallen by 47.6%. Within the sector, emissions from in-state generation have fallen by 20.8% while emissions from imports have decreased significantly by 68.1%. The next biggest decrease was in the transportation sector where emissions have fallen by 29.8%, driven by a 54.9% decrease in emissions from heavy-duty vehicles as they use an increasing share of biodiesel. For light-duty vehicles, emissions have fallen by 21.6%. The residential and commercial sectors are the only ones in which emissions have increased — by 3.2% and 46.3%, respectively. The increases can be partially attributed to the increasing use of substitutes for ozone-depleting substances for refrigeration and air conditioning which emit high global warming potential (GWP) gases.
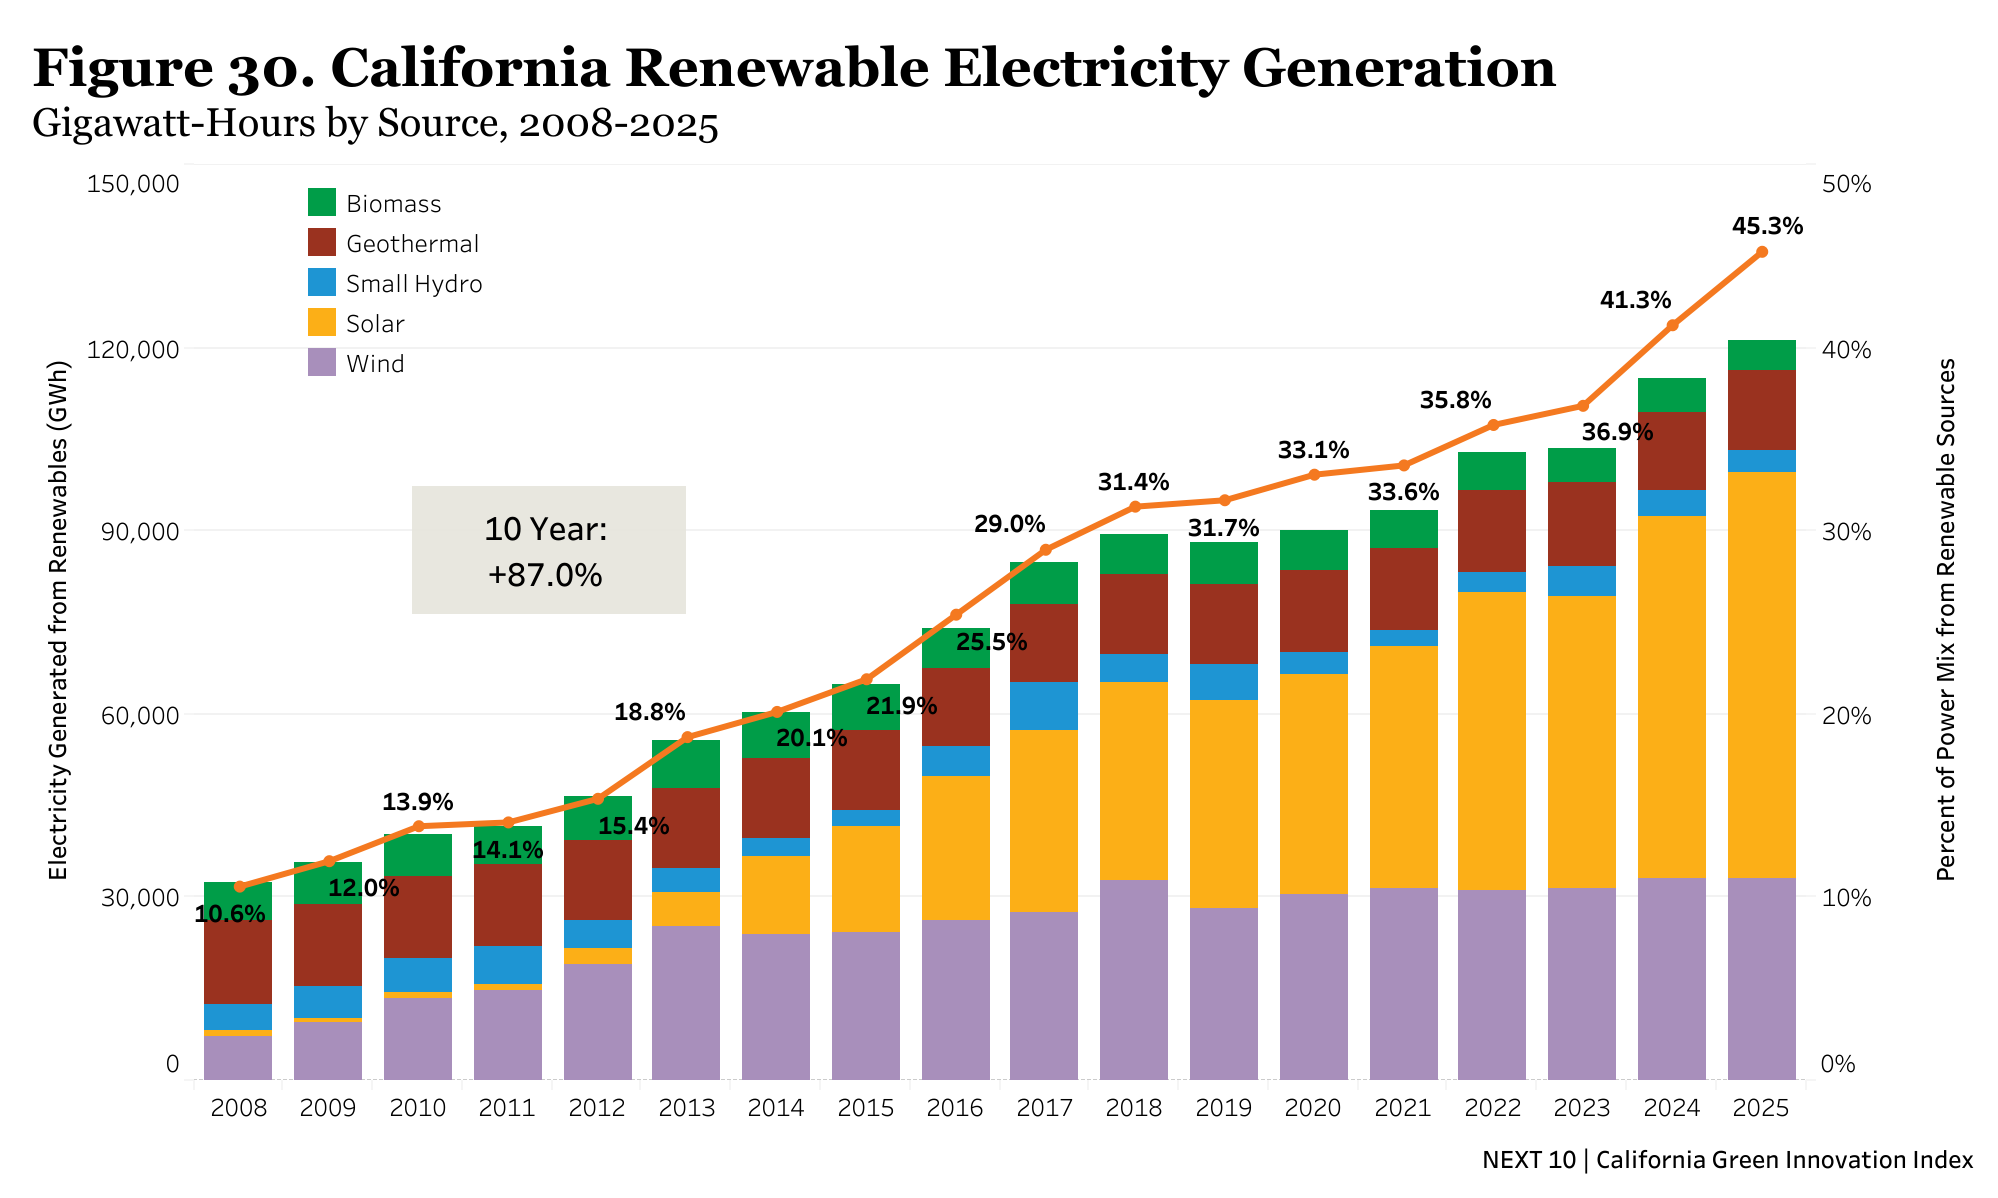
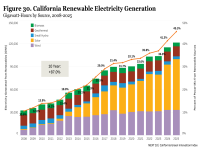
Renewable energy generation increased by 4% from 2024 to 2025, a significant accomplishment after last year’s record 4.4% growth, to 45.3% of California’s total power mix (imports and in-state but excluding large hydro) (Figure 30). While the state missed the interim SB 100 goal of procuring 44% of retail electricity sales from RPS-eligible renewable sources by the end of 2024, it would most likely meet the 2027 goal of 52% of generation from RPS-eligible renewable sources on time at the current pace (Figure 34). Electricity generation from RPS-eligible renewable sources and large hydroelectric in 2025 accounted for over half (56.4%) of the power mix while generation from fossil fuels fell to 32.1% — a drop of 4.2% and the lowest level on record. Although natural gas remains the largest share (30.4%) of California’s power mix, in-state generation and imports from solar (24.8%) and wind (12.4%) combined overtook natural gas for the first time. (Figure 32a&b).
While growth in renewable energy generation has fallen short of our targets in the past, the state has brought online a substantial amount of battery storage and new capacity. In 2025, California approved 5,575 MW of energy storage, exceeding 20,000 MW cumulatively for the first time. As of June 2026, California had approved another 8,647 MW in 2026 year-to-date — more than in all of 2025 (Figure 40). As of the end of 2025, California has 11,052 MW of proposed energy storage capacity in the pipeline for 2026 to 2031. In October 2026, the state announced that they had surpassed 23,000 MW of battery storage capacity. California also added 1.49 gigawatts (GW) of utility-scale capacity to the grid in 2025, of which 100% were RPS-eligible renewable projects. Of those projects, 1.45 GW was solar, 30.7 megawatts (MW) was wind, and 4.9 MW was biomass.
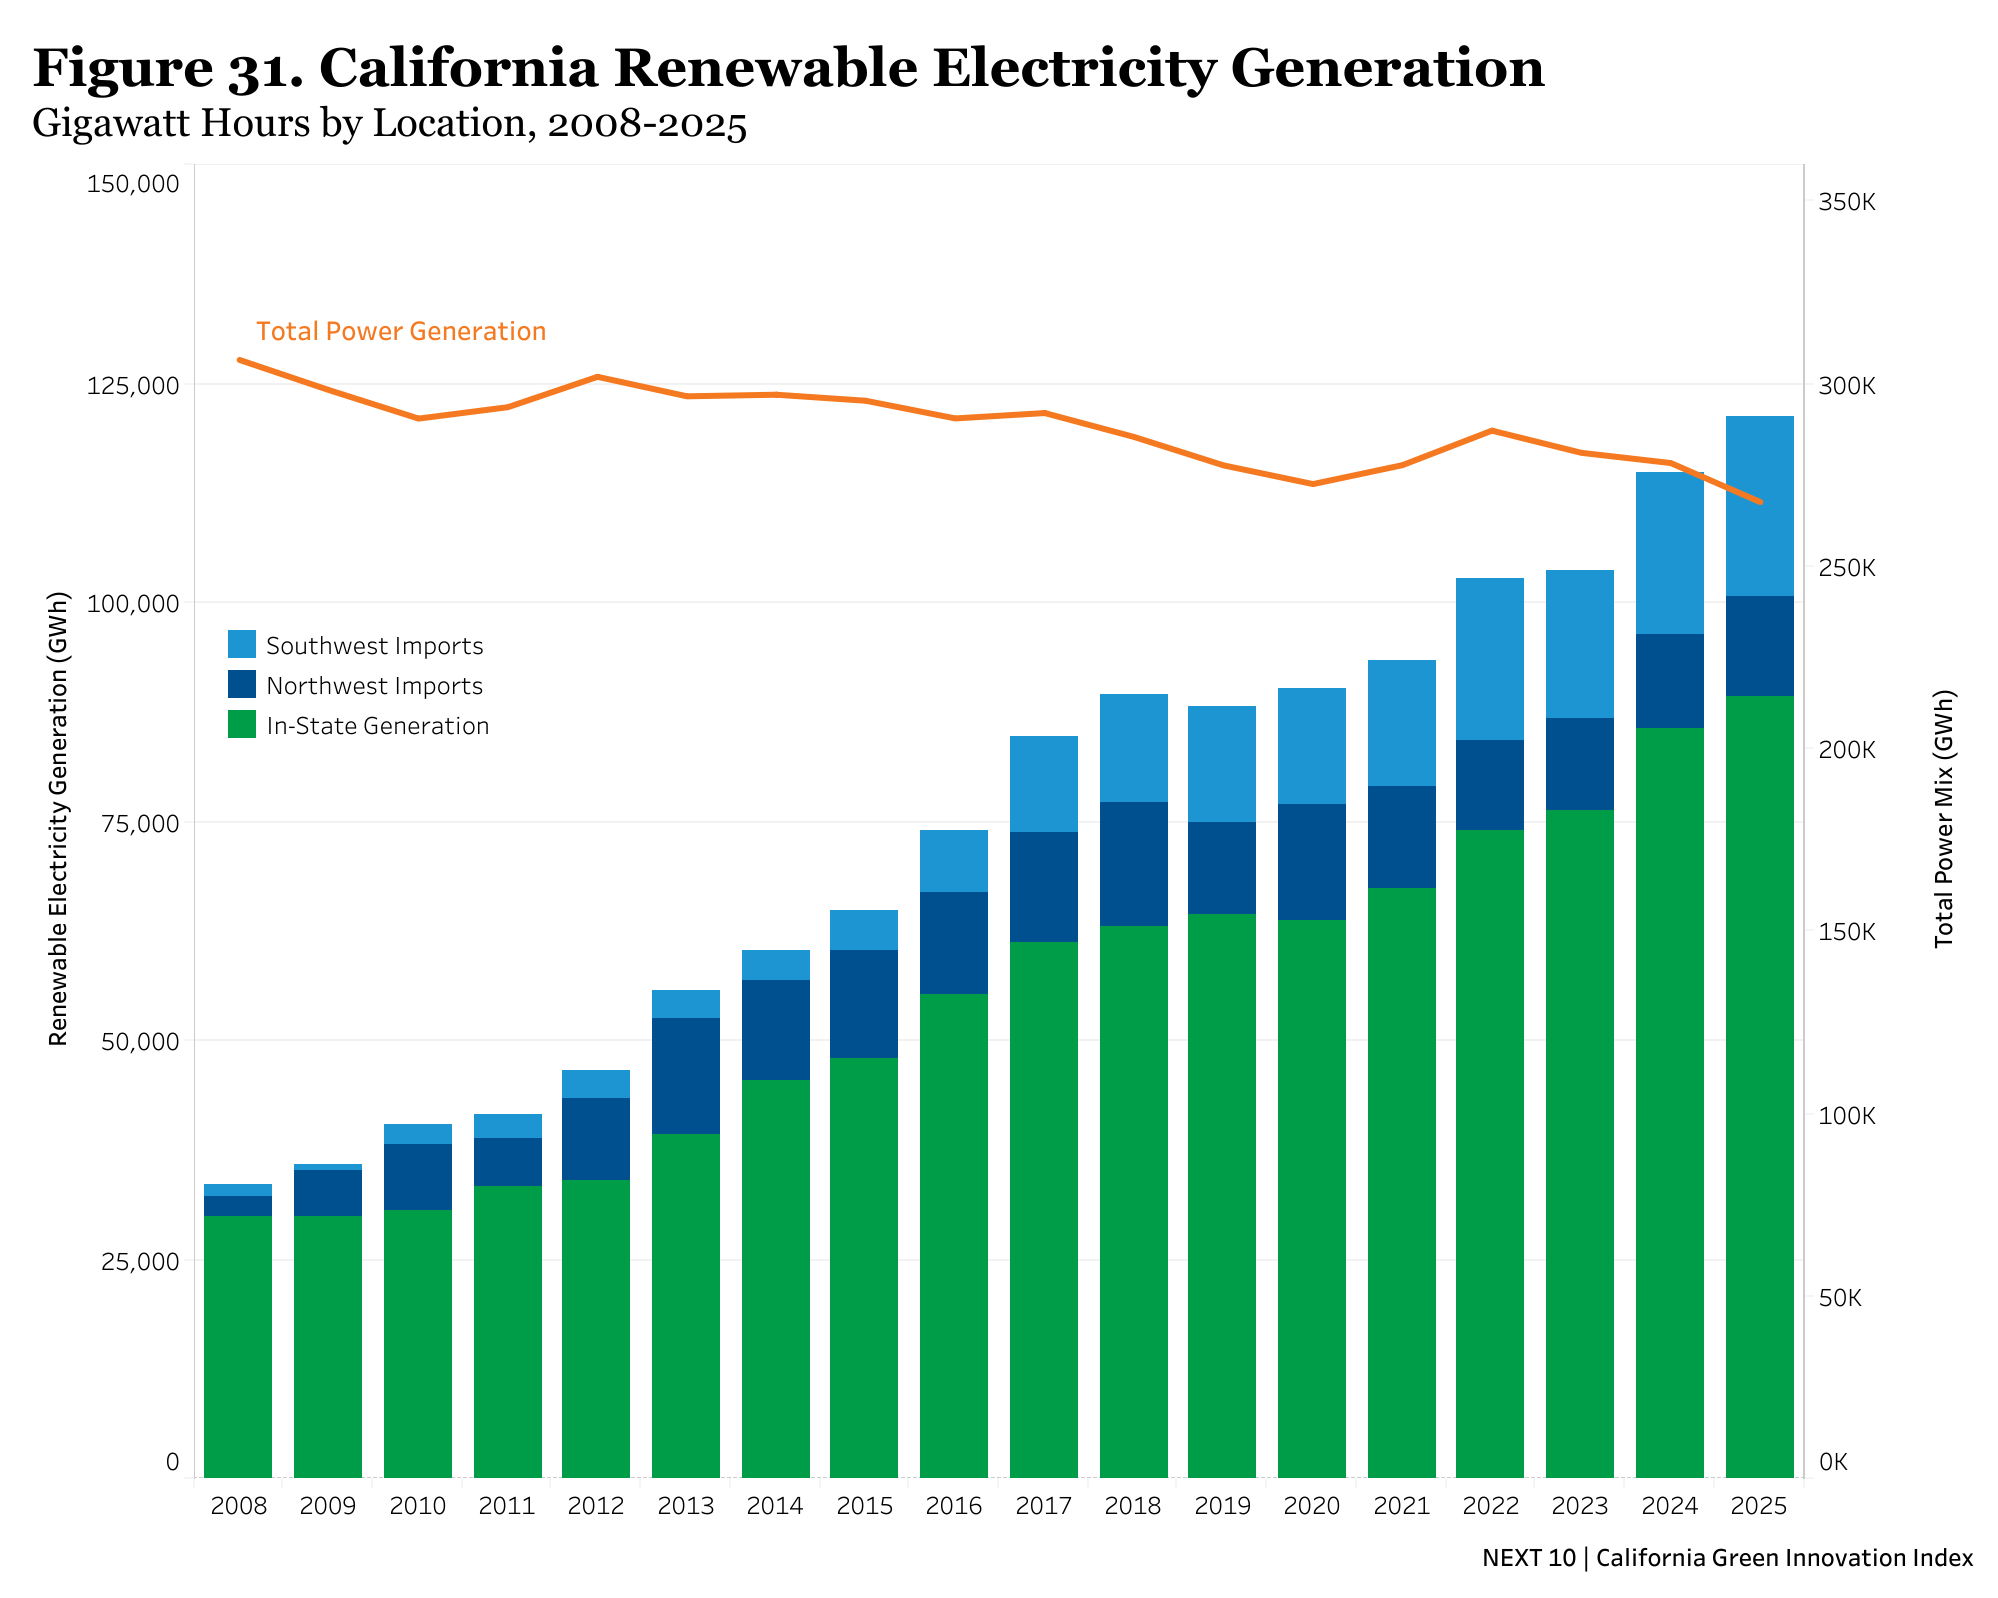
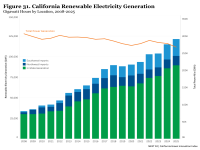
Increasing renewable energy and battery storage deployment have led to significant decreases in emissions from the electric power sector. From 2023 to 2024, emissions from electric power generation fell by 4.2%, driven by a 9.5% reduction in emissions from in-state generation while those from imports actually increased by 9.8% due to increased coal use in the Southwest region in 2024. However, fossil fuels’ share of Southwest imports decreased from 29.9% to 26.8% from 2024 to 2025, so emissions from imports are likely to continue their downward trend next year. In 2025, imports supplied a quarter (26.3%) of California’s renewable energy, with 9.4% from the Northwest and 17.0% from the Southwest. The share of Northwest imports that are from RPS-eligible renewables remained somewhat elevated at 56.9% in 2025 compared to 68.5% in 2024, while the share from the Southwest rose from 39.7% in 2024 to 48.9% in 2025 (Figure 31). Continued investment in renewable energy and battery storage coupled with the new regional electricity market that will enable California to share clean energy resources with neighbors across the West should help to further decarbonize electricity generation in California. California already maintains a significant lead in renewables, with an average yearly growth rate of 2% from 2008 to 2025, compared to the 0.9% growth rate in the rest of the U.S.
Join Next 10 and Hoyu Chong, Principal at CEC Economics, on December 17, 2026 at 11am PT for a webinar to discuss the findings of the 2026 Green Innovation Index. Register here.
The 2026 California Green Innovation Index can be found at https://greeninnovationindex.org/
Next 10 owns the rights to this publication. Any usage of content from this publication is subject to our Terms of Use.
Carbon Economy
- Total (GHG) emissions in California decreased by 3.9% to 346.0 million metric tons (MMTCO2e) in 2024 compared to 2023.
- Emissions in 2024 remained 6.3% below emissions in 2020 during the COVID-19 pandemic shutdown.
- The 2024 GHG emissions were 19.7% below the 1990 level of 431 MMTCO2e.
- To meet the 2030 goal of 40% below 1990 levels, the state must reduce emissions by 4.7% each year based on the 2024 GHG emissions, an increase from the 4.4% per year needed in last year’s Index.
- Using the 2019 to 2024 average annual reduction, we would meet the 2030 goal in 2034 — a year sooner than in last year’s Index and 3 years sooner than in the 2024 Index.
- The transportation sector continues to be the largest-emitting sector in California, comprising 38.0% of the total emissions in 2024 and down 4.1% (-5.6 MMTCO2e) from 2023.
- Emissions from the heavy-duty vehicle subsector declined by 17.5% (-4.0 MMTCO2e) from 2023 levels, and these decreases continue to be driven by the increased use of renewable/biodiesel.
- Emissions from light-duty vehicles, the largest-emitting subsector within transportation that consists of passenger cars, light-duty trucks and SUVs, and motorcycles, fell below 100 MMTCO2e for the first time, accounting for 28.7% (99.2 MMTCO2e) of California’s emissions in 2024.
- Among the economic sectors, the in-state electricity generation sector experienced the largest reduction, decreasing by 9.5% (-4.0 MMTCO2e), followed by the residential sector, which fell by 8.6% (-3.0 MMTCO2e), from 2023 to 2024.
- In California, GHG emissions per capita fell by 4.3% (-0.40 MMTCO2e/person) from 2023 to 2024, while the state’s inflation-adjusted GDP per capita grew by 2.7% over the same time period.
Transportation
- GHG emissions from surface transportation decreased by 4.5% (or 5.6 MMTCO2e) from 2023 to 2024 despite VMT increasing by 3% (or up 9.3 billion miles to 326.0 billion miles).
- In 2024, emissions per VMT averaged 0.37 tons of CO2-equivalent per 1,000 vehicle miles traveled — not only is this ratio the lowest it has ever been, but it is also 13.2% less than in 2020 during the pandemic shutdown.
- For the first time, the number of ZEVs registered (2,236,896) and the number of hybrid vehicles registered (2,080,015) both surpassed the two million mark in 2025. However, the number of HEVs registered grew faster (+18.3%) from 2024 than ZEVs (+17.7%).
- For the first time, new ZEV registrations (battery, plug-in hybrid, and fuel cell EVs) fell from 25.5% of total new vehicle registrations in 2024 to 24.4% in 2025 after the federal tax credits expired.
- The number of electric light-duty pickups, SUVs and vans registered surpassed a million units for the first time in 2025, with 1.24 million vehicles registered, up 28.7% compared to 2024.
- At the current trajectory, California is not on track to meet its immediate interim Advanced Clean Cars II (ACCII) goals of new ZEV sales at 35% for model year 2026.
- To reach the 2030 goal of 5 million ZEVs on-road, ZEV registrations in California need to increase by an annual average of 17.45% from 2026 to 2030, relatively unchanged from the 17.50% required previously between 2025 to 2030.
- Motor vehicle fuel production of gasoline (-20.1%) and diesel (-40.3%) continued to trend below 2019 levels in 2025.
- Unlinked passenger trips (UPTs), which represent the number of times passengers board public transportation vehicles, remained 22.0% lower in 2025 than the pre-pandemic level in 2019 despite increasing by 1.5% from 2024 to 2025.
Renewable Energy
- In 2025, the percentage of total power mix (in-state generation plus imports) from renewable sources increased to 45.3%, a 4.0% increase compared to 2024.
- RPS goals:
- After narrowly missing the interim SB 100 goal of procuring 44% of retail electricity sales from RPS-eligible renewable sources by the end of 2024, it will be a close call whether California will meet the interim 2026 goal of 50%. California’s RPS-eligible renewables’ share of the power mix would need to grow by 4.7% from 2025 to 2026, a rate that has never been reached before.
- California’s share of RPS-eligible renewable sources to the state’s power mix rose by 4.0% from 2024 to 2025 after rising 4.4% from 2023 to 2024 — the 4.4% was the fastest pace on record.
- At the current pace, California should be able to meet its next interim goal of 52% by 2027 even if it misses the 2026 goal.
- Electricity generation from RPS-eligible renewables increased by 5.5% from 2024 to 2025. Particularly, generation from solar (in-state generation and imports) rose 12.1% while generation from wind barely increased (+0.2%).
- Electricity generation from RPS-eligible renewable sources and large hydroelectric accounted for 56.4% of the power mix in 2025, an increase of 4.1% from 2024.
- Generation from fossil fuels fell to 32.1% in 2025, a drop of 4.2% and the lowest share of the power mix on record as well as half of the 63.9% it was in 2008.
- Although natural gas remains the largest share (30.4% or 81,319 GWh) of California’s power mix (in-state and imports), it decreased by a significant 14.1% (13,336 GWh) from 2024 to 2025.
- In-state generation and imports from solar (24.8%) and wind (12.4%) combined overtook natural gas for the first time.
- In-state generation from natural gas fell by 14.1% (12,163 GWh) to 74,316 GWh in 2025, the lowest level on record.
- In 2025, California approved 5,575 MW of energy storage, exceeding 20,000 MW cumulatively for the first time.
- As of June 15, 2026, California had approved another 8,647 MW in 2026 year-to-date — more than in all of 2025.
- Wind and solar curtailments rose by 23.3% and 53.7%, respectively, during the first eight months of 2026 relative to the first eight months of 2025. The unusually high level of solar curtailment occurred in April and May 2026.
Energy Efficiency
- California’s total statewide energy consumption was 3.7% lower in 2024 than in 1990, despite the state being 31% more populous. However, statewide energy consumption rose 0.6% from 2023 to 2024.
- Total energy consumption was 13% lower in 2024 than in 2007.
- Relative to 2015, the year that Senate Bill 350 became law, California’s total statewide and per capita energy consumption in 2024 were only 4.0% and 5.1% lower, respectively.
- From 2015 to 2024, total natural gas consumption (all sectors combined) fell by 6.2%, but total electricity consumption rose by 0.4% — evidence that California is gradually electrifying its buildings.
- From 2023 to 2024, total natural gas consumption from all sectors fell 7.2% while electricity consumption rose 2.2%.
- Renewable energy consumption growth continues to outpace that of fossil fuels and other sources for both electric and non-electric consumption, growing by 58.6% and 151.2%, respectively, between 2014 to 2024.
- For electricity consumption, solar and wind posted significant one-year increases—up 18.1% and 11.6%, respectively, from 2023 to 2024. For non-electricity consumption, solar energy grew 11.5% from 2023 to 2024.
- California's average monthly commercial electricity bill ($1,374) has become considerably more expensive relative to the U.S. average ($821) during the last decade—from 33.5% higher in 2015 to 65.7% higher in 2025.
- California households also had higher than average residential electricity bills in 2025, averaging $153 per month compared to the U.S. average of $147.
- This means California had the 18th-highest household electricity bill in 2025, an improvement from the 8th-highest in 2024.
To view and download all of the figures in this report, visit GreenInnovationIndex.org
Next 10 owns the copyright to all graphics in this report, and they are available for download and limited use, subject to our Terms of Use. Please contact Next 10 at info@next10.org with any questions.