Publications
2025 California Green Innovation Index
The 17th annual California Green Innovation Index finds total greenhouse gas emissions fell between 2022 and 2023, dropping by 3.0% to 360.4 million metric tons of carbon dioxide equivalent (MMTCO2e), an improvement over the 2.4% reduction the previous year. Notably, emissions in 2023 were also 2.4% lower than they were during the COVID-19 pandemic shutdown in 2020. Most of the decrease in emissions came from the transportation sector, which fell by 4.6% from 2022 to 2023 (Figure 1). This was driven by a significant 17.2% decrease in emissions from the heavy-duty vehicles sub-sector, while emissions from light-duty vehicles also fell by 0.6%.
Within the transportation sector, California met the 2025 goal of 1.5 million zero-emission vehicles (ZEVs) on-road two years early in April 2023. To reach the 2030 goal of 5 million ZEVs on-road, ZEV registrations in California need to increase by an annual average of 17.5% from 2025 to 2030, revised downwards from the 18.6% required previously between 2024 to 2030 (Figure 21). However, now that the $7,500 tax credit for new EVs and the $4,000 tax credit for used EVs are no longer available as of October 1st, new registrations of EVs may slow compared to historical trends and threaten the state’s ability to meet the 2030 goal. In 2024, new battery electric and plug-in hybrid vehicles accounted for 25.5% of total new vehicles registered in California and the percentage of registered vehicles on-road that are ZEVs reached 6.5%, up from 5.2% in 2023. The Index’s encouraging data on electric vehicle sales contrasts sharply with its findings on public transit ridership, which remained 23.2% below the pre-pandemic 2019 level in 2024, despite a 9% increase in ridership from 2023 to 2024.
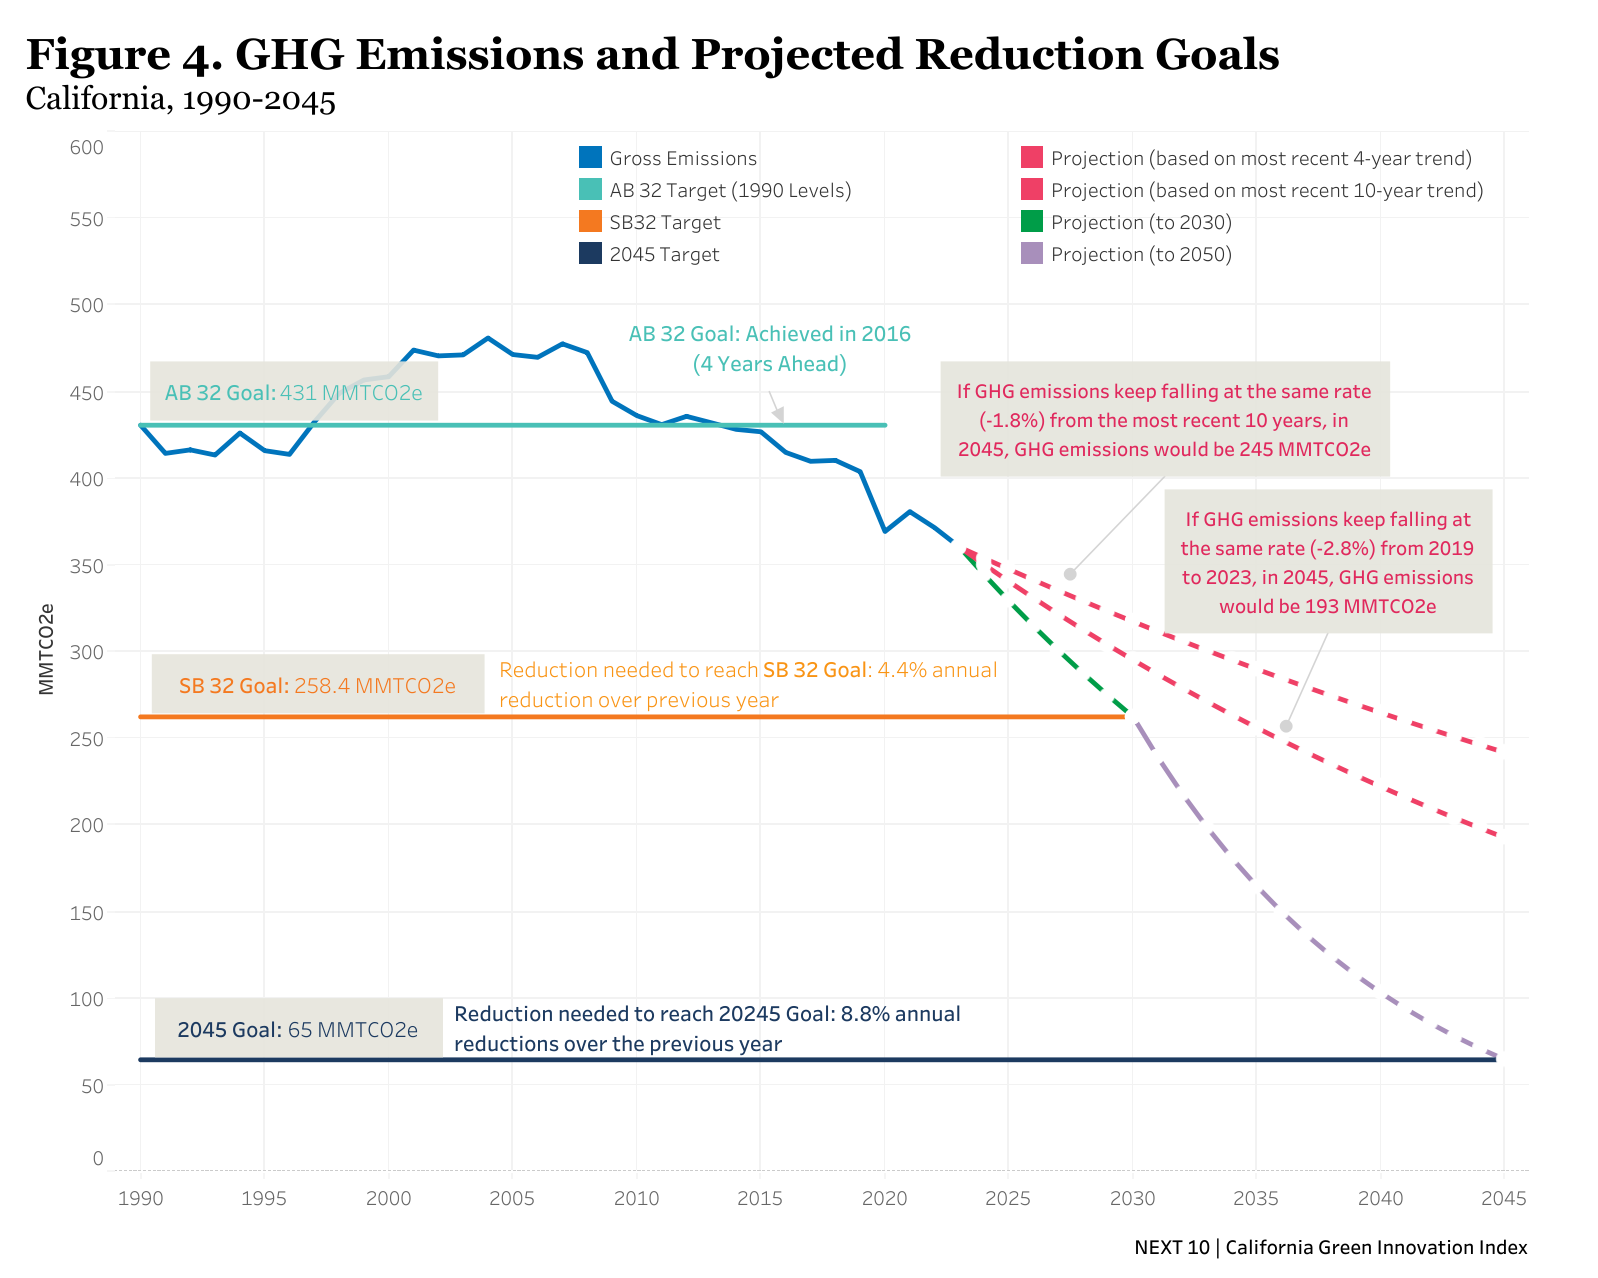
California is not currently on track to meet the 2030 emissions target of nearly 260 MMTCO2e (or 40% below 1990 levels) on time. To do so, California would need to reduce emissions by 4.4% annually on average as of 2023 — up from the 4.2% needed in 2022 and the 4.0% needed in 2021 (Figure 4). Over the most recent five-year period (2019 to 2023), emissions have only decreased by 2.8% annually on average. Using this trajectory, the state would meet the 2030 goal in 2035. Even if the state met the 2030 goal on time, emissions would need to fall at a pace of 8.8% per year to reach the goal by 2045—more than double the pace required to meet the 2030 target. However, using the recent five-year average annual reduction of 2.8%, emissions would need to decrease by 9.5% on average each year from 2030 to 2045 to meet the 2045 goal on time.
Since the passage of AB 32 in 2006, emissions have fallen significantly in most sectors, highlighting the impact of that historic legislation (Figure 3). The largest decrease has been from electric power generation where emissions have fallen by 45.3% Within the sector, emissions from in-state generation have fallen by 17.4% while emissions from imports have decreased significantly by 70.9%. The next biggest decrease was in the transportation sector where emissions have fallen by 26.7%, driven by a 45.3% decrease in emissions from heavy-duty vehicles as they use an increasing share of biodiesel. For light-duty vehicles, emissions have fallen by 20.5%. The residential and commercial sectors are the only ones in which emissions have increased — by 13.0% and 43.9%, respectively. The increases can be partially attributed to the increasing use of substitutes for ozone-depleting substances for refrigeration and air conditioning which emit high global warming potential (GWP) gases.
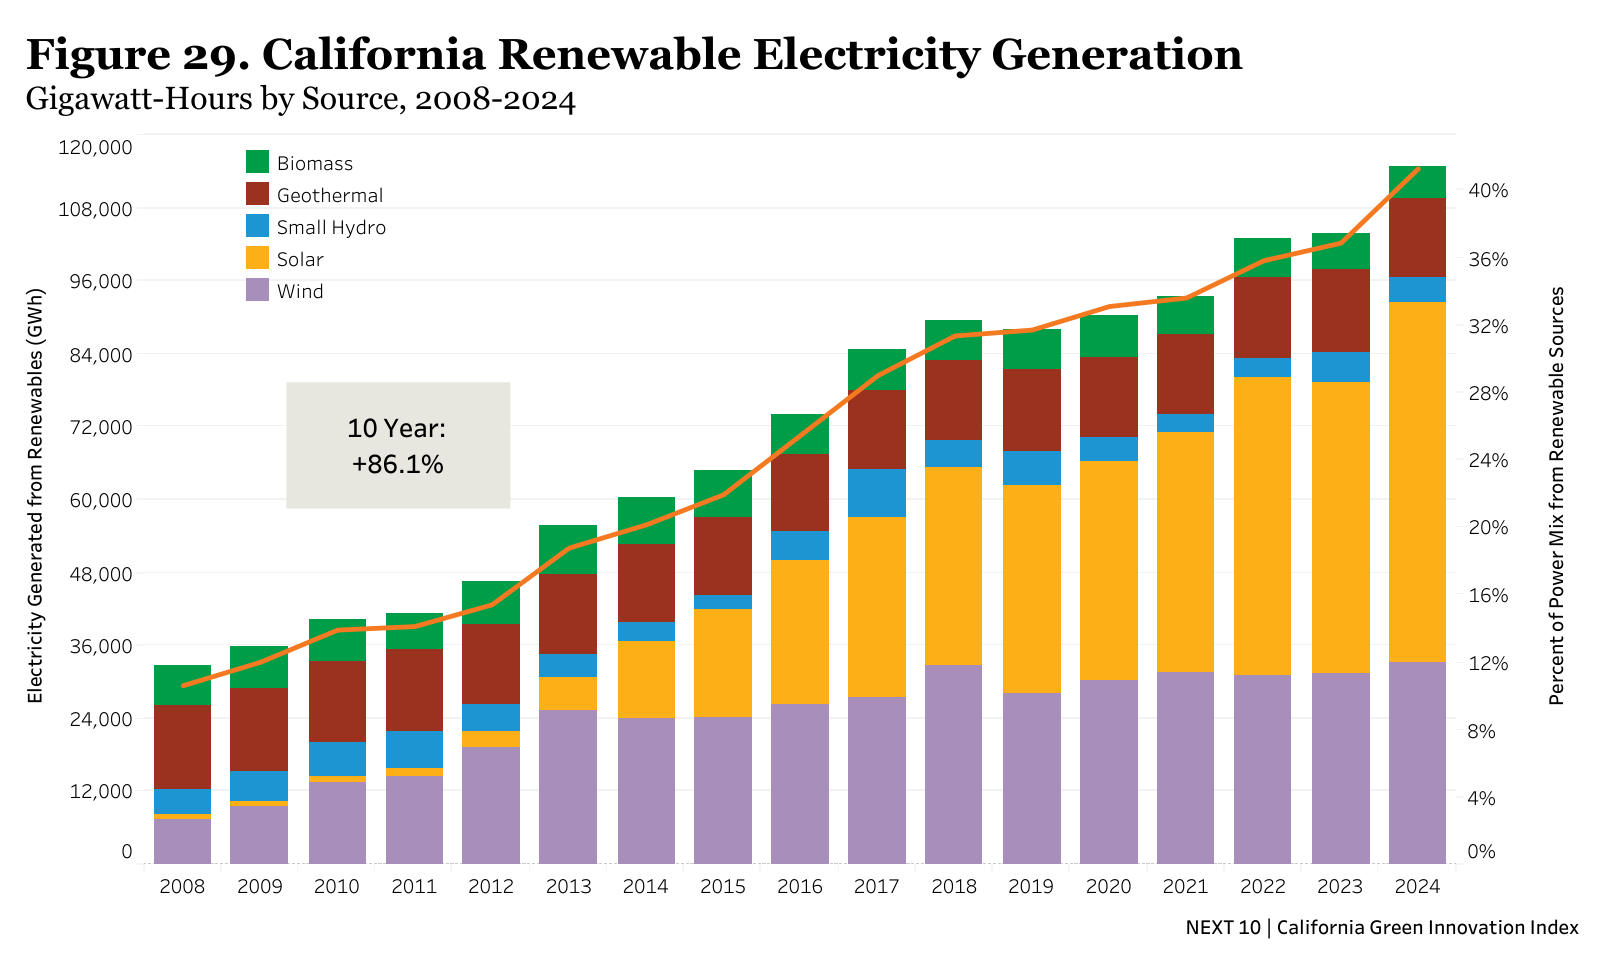
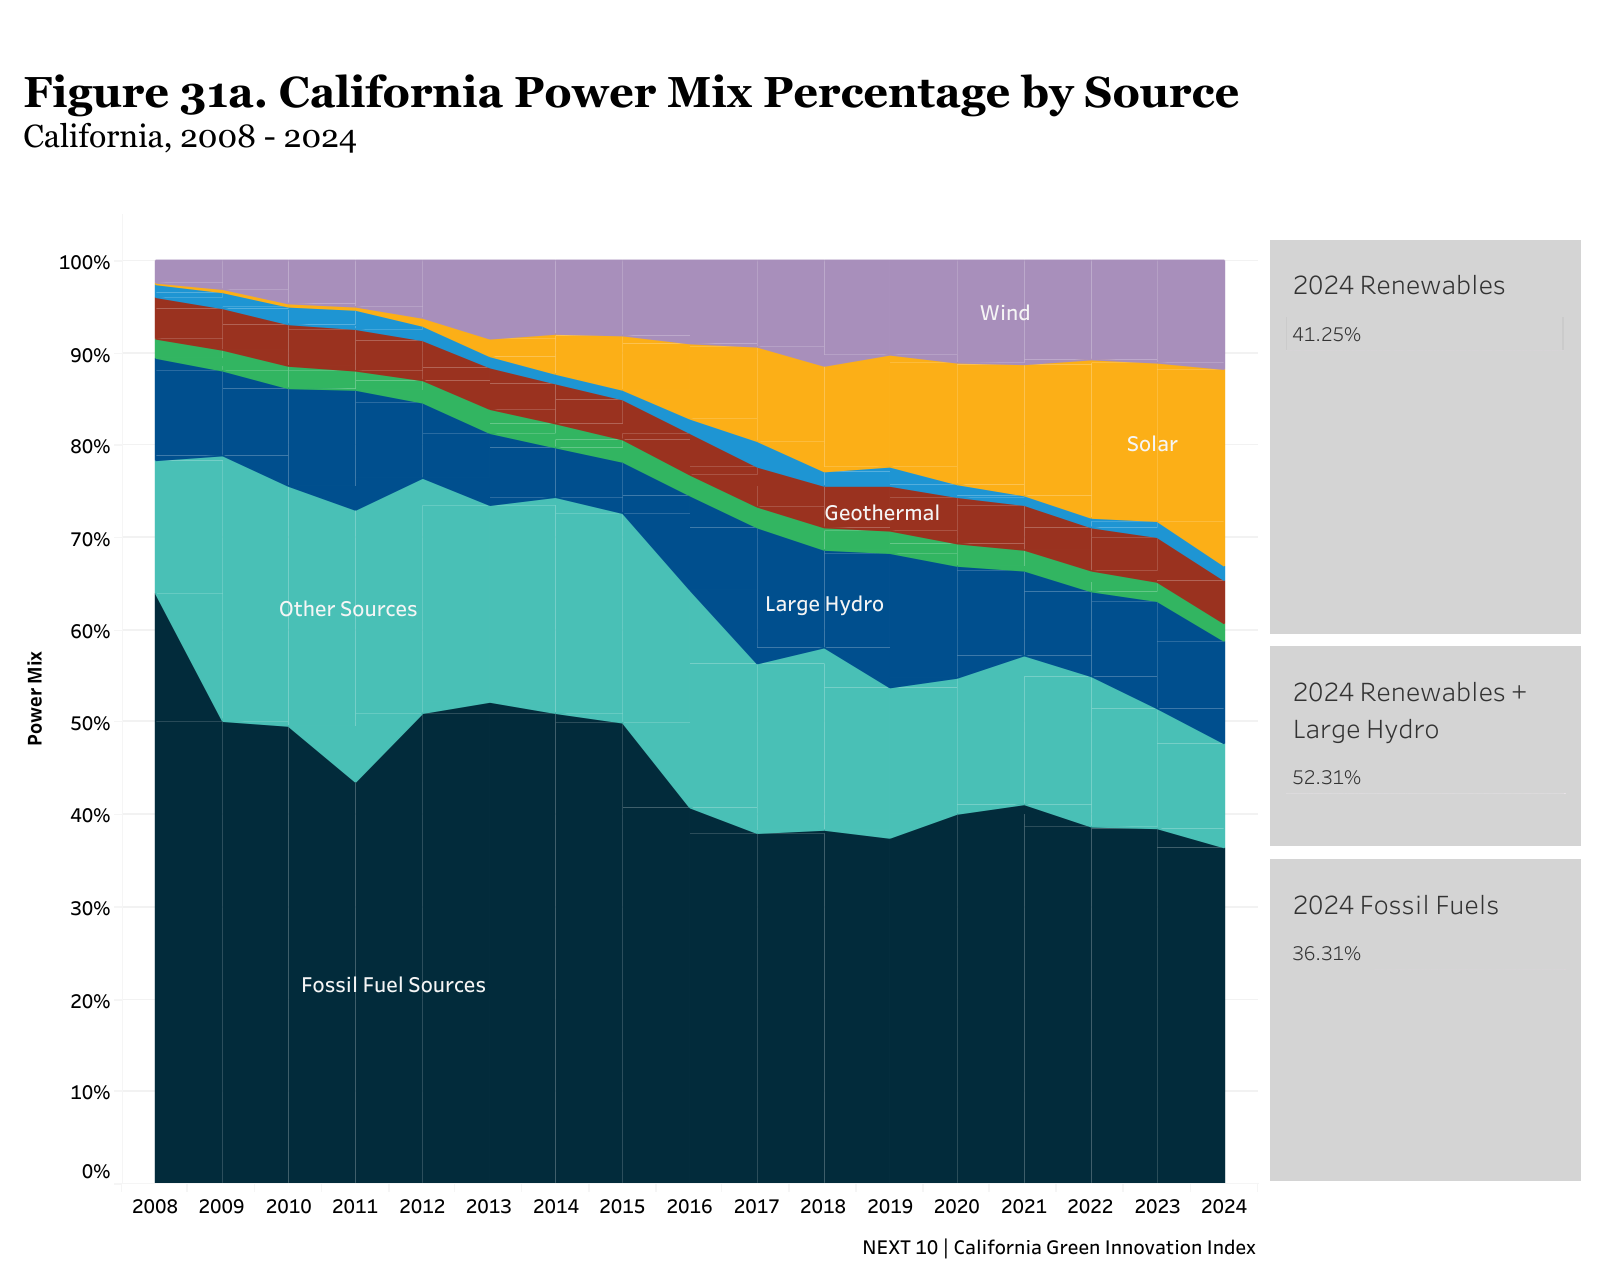
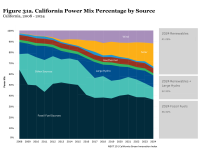
Renewable energy generation increased by 4.4% from 2023 to 2024, a welcome change after growth had been fairly stagnant since 2018, to 41.3% of California’s total power mix (imports and in-state but excluding large hydro) (Figure 29). While this is good news, the state missed the interim SB 100 goal of procuring 44% of retail electricity sales from RPS-eligible renewable sources by the end of 2024. However, if California can maintain this 4.4% pace for the next two years it could meet the 2026 goal of 50% of generation from RPS-eligible renewable sources on time (Figure 33). For the first time, electricity generation from RPS-eligible renewable sources and large hydroelectric in 2024 accounted for over half (52.3%) of the power mix. Meanwhile, generation from fossil fuels fell to 36.3% in 2024 — the lowest on record. Solar and wind are the largest renewable sources, making up 21.3% and 11.9%, respectively, of the state’s total power mix (Figure 31a&b).
While growth in renewable energy generation has fallen short of our targets, the state has brought online a substantial amount of battery storage and very little new natural gas generation. In 2024, California added 5,743 MW of energy storage, an increase of 69.2% compared to the addition of 3,394 MW in 2023. California had also already added more storage in the first three months of 2025, adding 7,272 MW to the grid, than in all of 2024 (Figure 39). As of the end of 2024, California had 8,551 MW of proposed energy storage capacity in the pipeline for 2025 to 2027, which is more than the cumulative capacity added from 2013 to 2023 (7,913 MW). Meanwhile, the state added nearly 3,000 megawatts (MW) or 3 gigawatts (GW) of solar to the grid in 2024 and only 55 MW of natural gas. From 2015 to 2024, the state has retired 10.3 GW of natural gas plants while adding 34 GW of utility-scale solar to the grid (Figure 32).
Increasing renewable energy and battery storage deployment have led to significant decreases in emissions from the electric power sector. From 2022 to 2023, emissions from electric power generation fell by 4.2%, driven by a 9.3% reduction in emissions from imports while those from in-state generation of electricity fell by 2.1%. In 2024, imports supplied 25.4% of California’s RPS-eligible renewable energy, with 9.4% from the Northwest and 16.0% from the Southwest. The share of Northwest imports that are from RPS-eligible renewables remained elevated at 68.5% in 2024 compared to 67.5% in 2023 and just 30.0% in 2022, while the share from the Southwest rose from 33.8% in 2023 to 39.7% in 2024 (Figure 30).
Join Next 10 and Hoyu Chong, Principal at CEC Economics, on January 12th at 12pm PT for a webinar to discuss the findings of the 2025 Green Innovation Index. Register here.
The 2025 California Green Innovation Index can be found at https://greeninnovationindex.org/
Next 10 owns the rights to this publication. Any usage of content from this publication is subject to our Terms of Use.


Key Emissions Reductions Findings Include:
- Emissions have been falling at a faster pace since SB 32 became law in 2016 — it averaged 1.2% per year from 2006 (when AB 32 became law) to 2016 and averaged 2.0% annually from 2016 to 2023.
- Every sector has cut their emissions since 2006 except for the commercial and residential sectors, where emissions were 43.9% and 13.0% higher in 2023, respectively. This is primarily due to the use of substitutes for ozone-depleting substances’ (SODs) dominance in the sectors’ emissions, which are used for refrigeration and air conditioning.
- From 2007 to 2023, the residential and commercial sectors’ share of the use of SODs emissions have risen from 7.3% to 25.9% and 30.9% to 44.7%, respectively.
- Emissions from the electric power sector fell by 4.2% from 2022 to 2023 — by 2.1% from in-state generation and by 9.3% from imports — and 45.2% (-47.2 MMTCO2e) from 2006 to 2023.
- California would need to reduce emissions by 9.5% per year on average from 2030 to 2045 to meet the 2045 goal of 85% below 1990 levels — up significantly from the most recent five-year average pace of reduction of 2.8%.
Key Transportation Findings Include:
- Emissions from this sector decreased by 4.6% from 2022 to 2023 — the most of any sector — driven by a significant reduction (-17.2%) in emissions from heavy-duty vehicles.
- The significant reduction in emissions from this subsector is due to increasing use of renewable/biodiesel under the LCFS.
- The number of ZEVs on-road in California totaled just under 1.9 million in 2024, a 25.3% increase from 2023.
- Together, new BEV and PHEV registrations totaled a quarter (25.5%) of new vehicle registrations in 2024.
- To reach the 2030 goal of 5 million ZEVs on-road, ZEV registrations in California need to increase by an annual average of 17.5% from 2025 to 2030, revised downwards from the 18.6% required previously between 2024 to 2030.
Key Renewable Energy Findings Include:
- For the first time, electricity generation from RPS-eligible renewable sources and large hydroelectric accounted for over half (52.3%) of the power mix in 2024, an increase of 3.7% from 2023. Meanwhile, generation from fossil fuels fell to 36.3% in 2024, the lowest on record.
- To meet future RPS targets on time, California needs to increase the share of electricity generation from renewable sources by 10.7% to meet the 2027 goal of 52% and by 18.7% to meet the 2030 goal of 60% compared to the 2024 level.
- In 2024, generation from solar (in-state generation and imports) rose by 23.8% compared to 2023.
- Within the first three months of 2025, California broke its previous 2024 record for battery energy storage deployed on the grid, adding 7,272 MW — enough to provide power for between 5.5 and 7.2 million homes.
- As of the end of 2024, California has 8,551 MW of proposed energy storage capacity in the pipeline for 2025 to 2027, which is more than the cumulative capacity added from 2013 to 2023 (7,913 MW).
Key Energy Efficiency Findings Include:
- California’s total statewide energy consumption was 4.3% lower in 2023 than in 1990, despite the state being 31% more populous.
- California has the third highest energy productivity in the U.S., generating $5.68 of GDP in 2023 (in 2023 dollars) for every 10,000 British Thermal Units (BTU) of energy consumed.
- From 2022 to 2023, the energy intensities of the residential sector, commercial sector, and the industrial sector declined by 5.3%, 4.9%, and 7.2%, respectively.
- California has some of the highest electricity costs per kWh—second-highest (jointly with Connecticut and Maryland) for residential customers ($0.30/kWh), second-highest for commercial customers ($0.24/kWh), and the fourth-highest for industrial customers ($0.19/kWh).
- In 2023, the average monthly electricity bill for industrial customers was 28.1% lower in California than the U.S. average, 67.0% higher in California for commercial customers, and 5.8% higher in California for residential customers.
Next 10 owns the copyright to all graphics in this report, and they are available for download and limited use, subject to our Terms of Use. Please contact Next 10 at info@next10.org with any questions.
To view and download all of the figures in this report, visit GreenInnovationIndex.org