Publications
Costs of Climate Change: Financial and Economic Impacts on California and U.S. Households
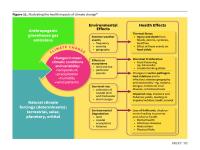
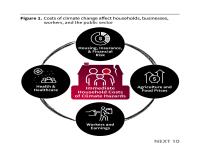
The costs of a warming climate continue to burden California families long after much-publicized climate disasters strike. Increasing temperatures, extreme events, and other climate-related disruptions affect energy consumption, health and lead to increased costs for households and businesses. These disruptions are also destabilizing insurance and financial markets.
This new report from the Center for Law, Energy & Environment (CLEE) at the University of California, Berkeley and Next 10 shows that disaster costs, health impacts, lost wages and more are disproportionately affecting California households, businesses and the public sector, with no sign of abatement. The report draws from over one hundred primary sources and – for the first time – collects both direct and indirect financial impacts of climate change to Californians and Americans across numerous sectors including lost wages, increasing costs of healthcare, higher food prices, skyrocketing insurance premiums and housing insecurity.
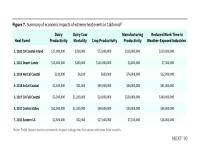
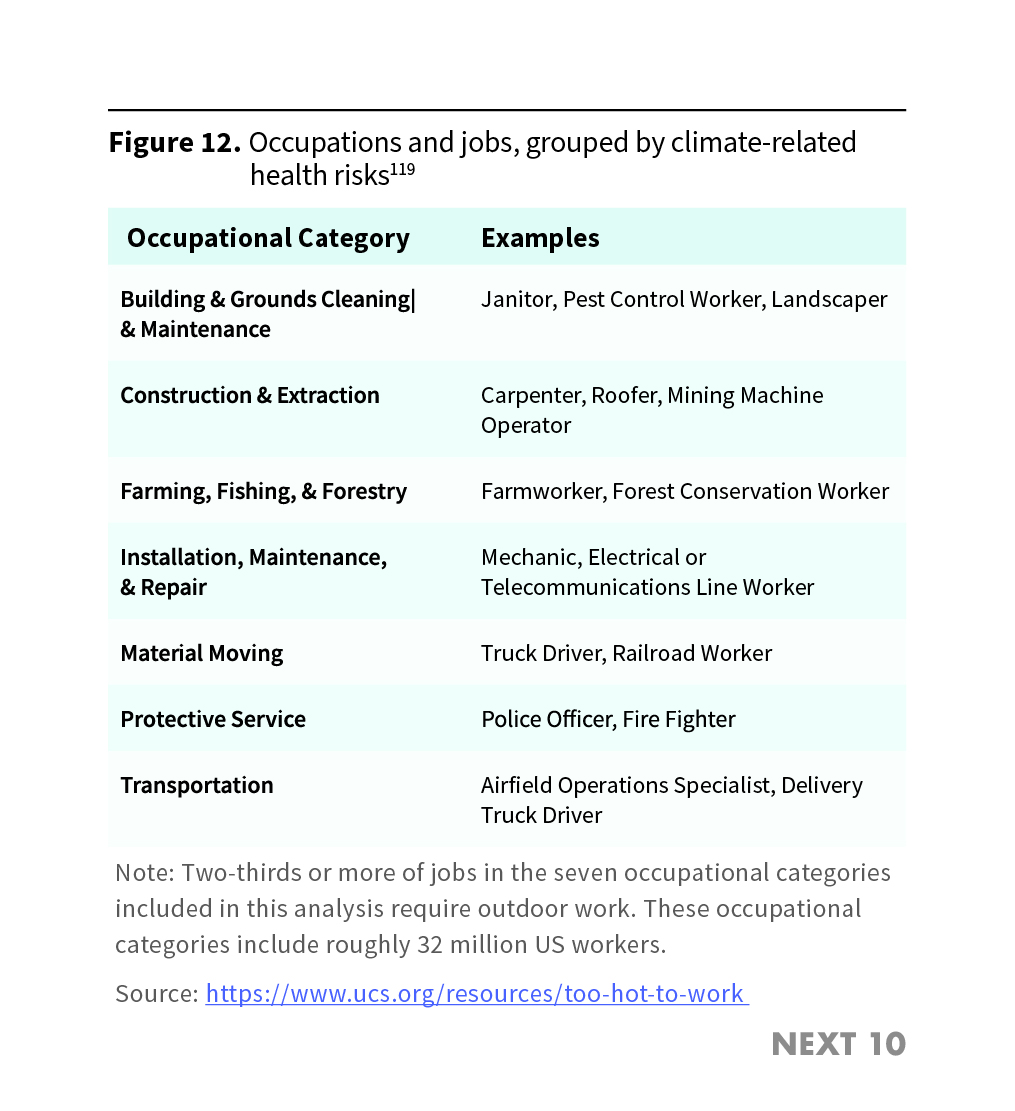
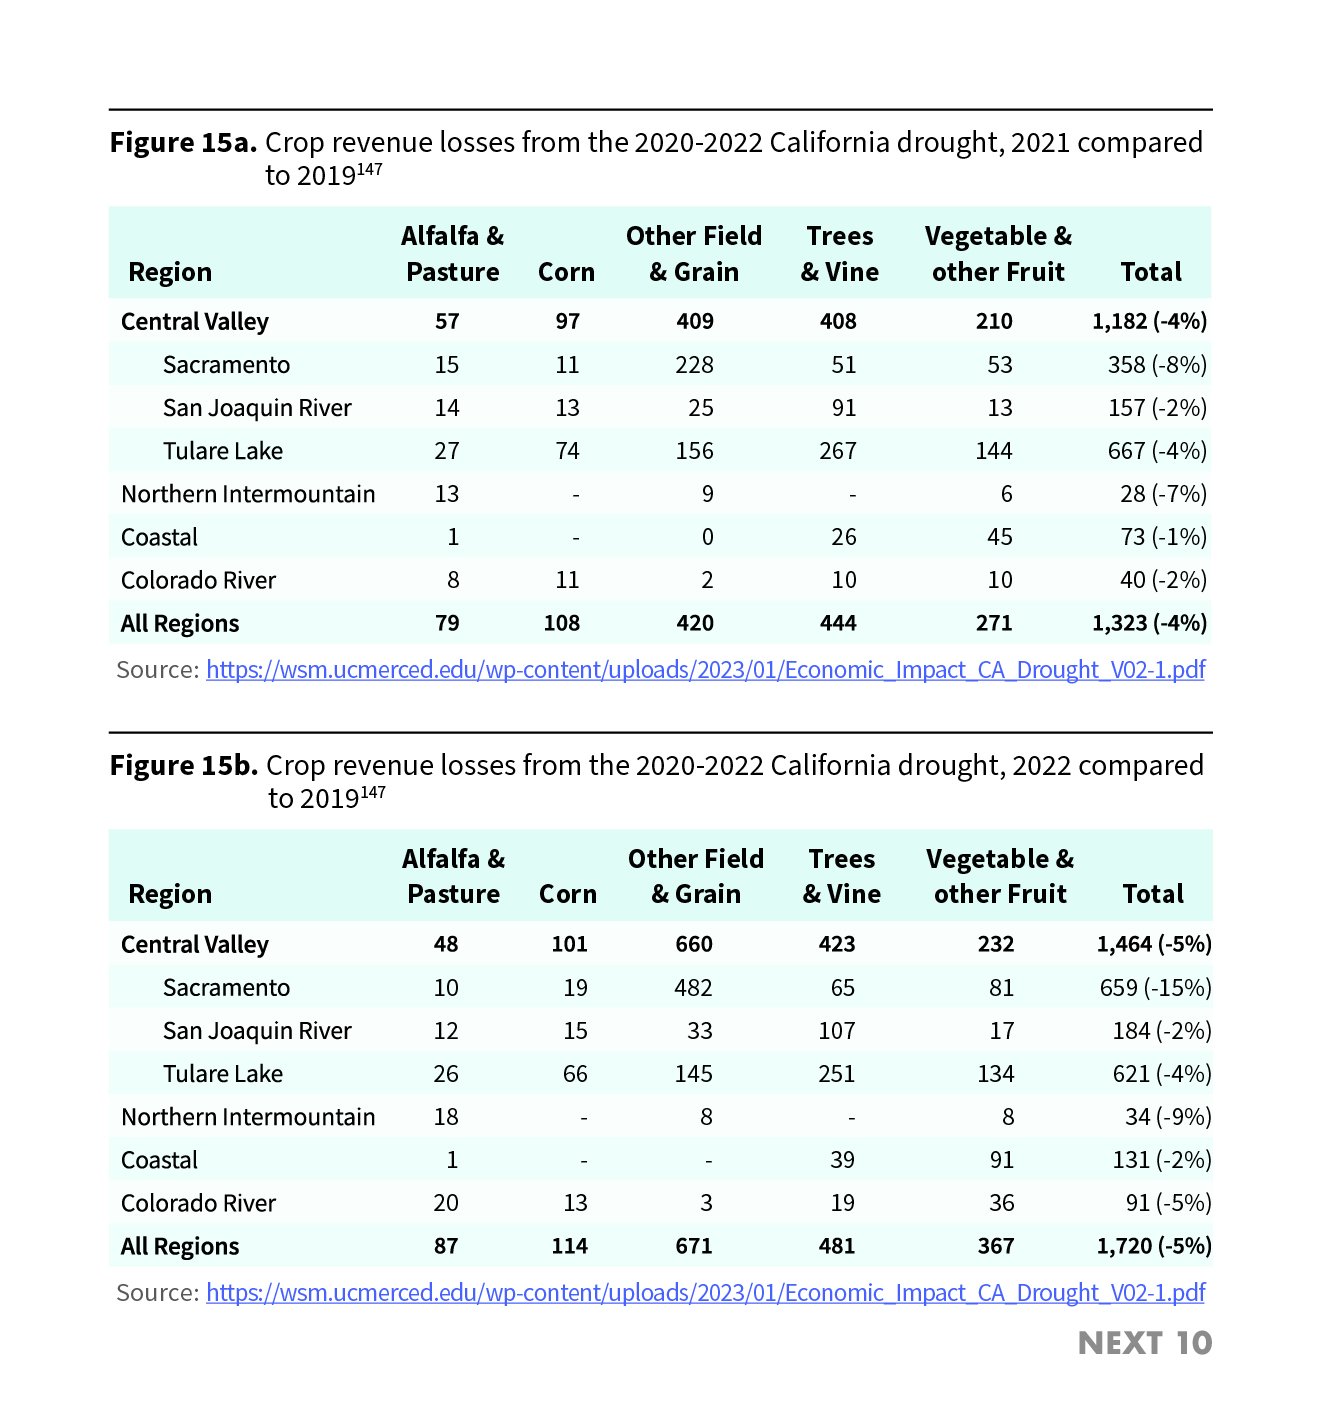
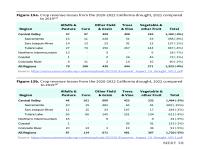
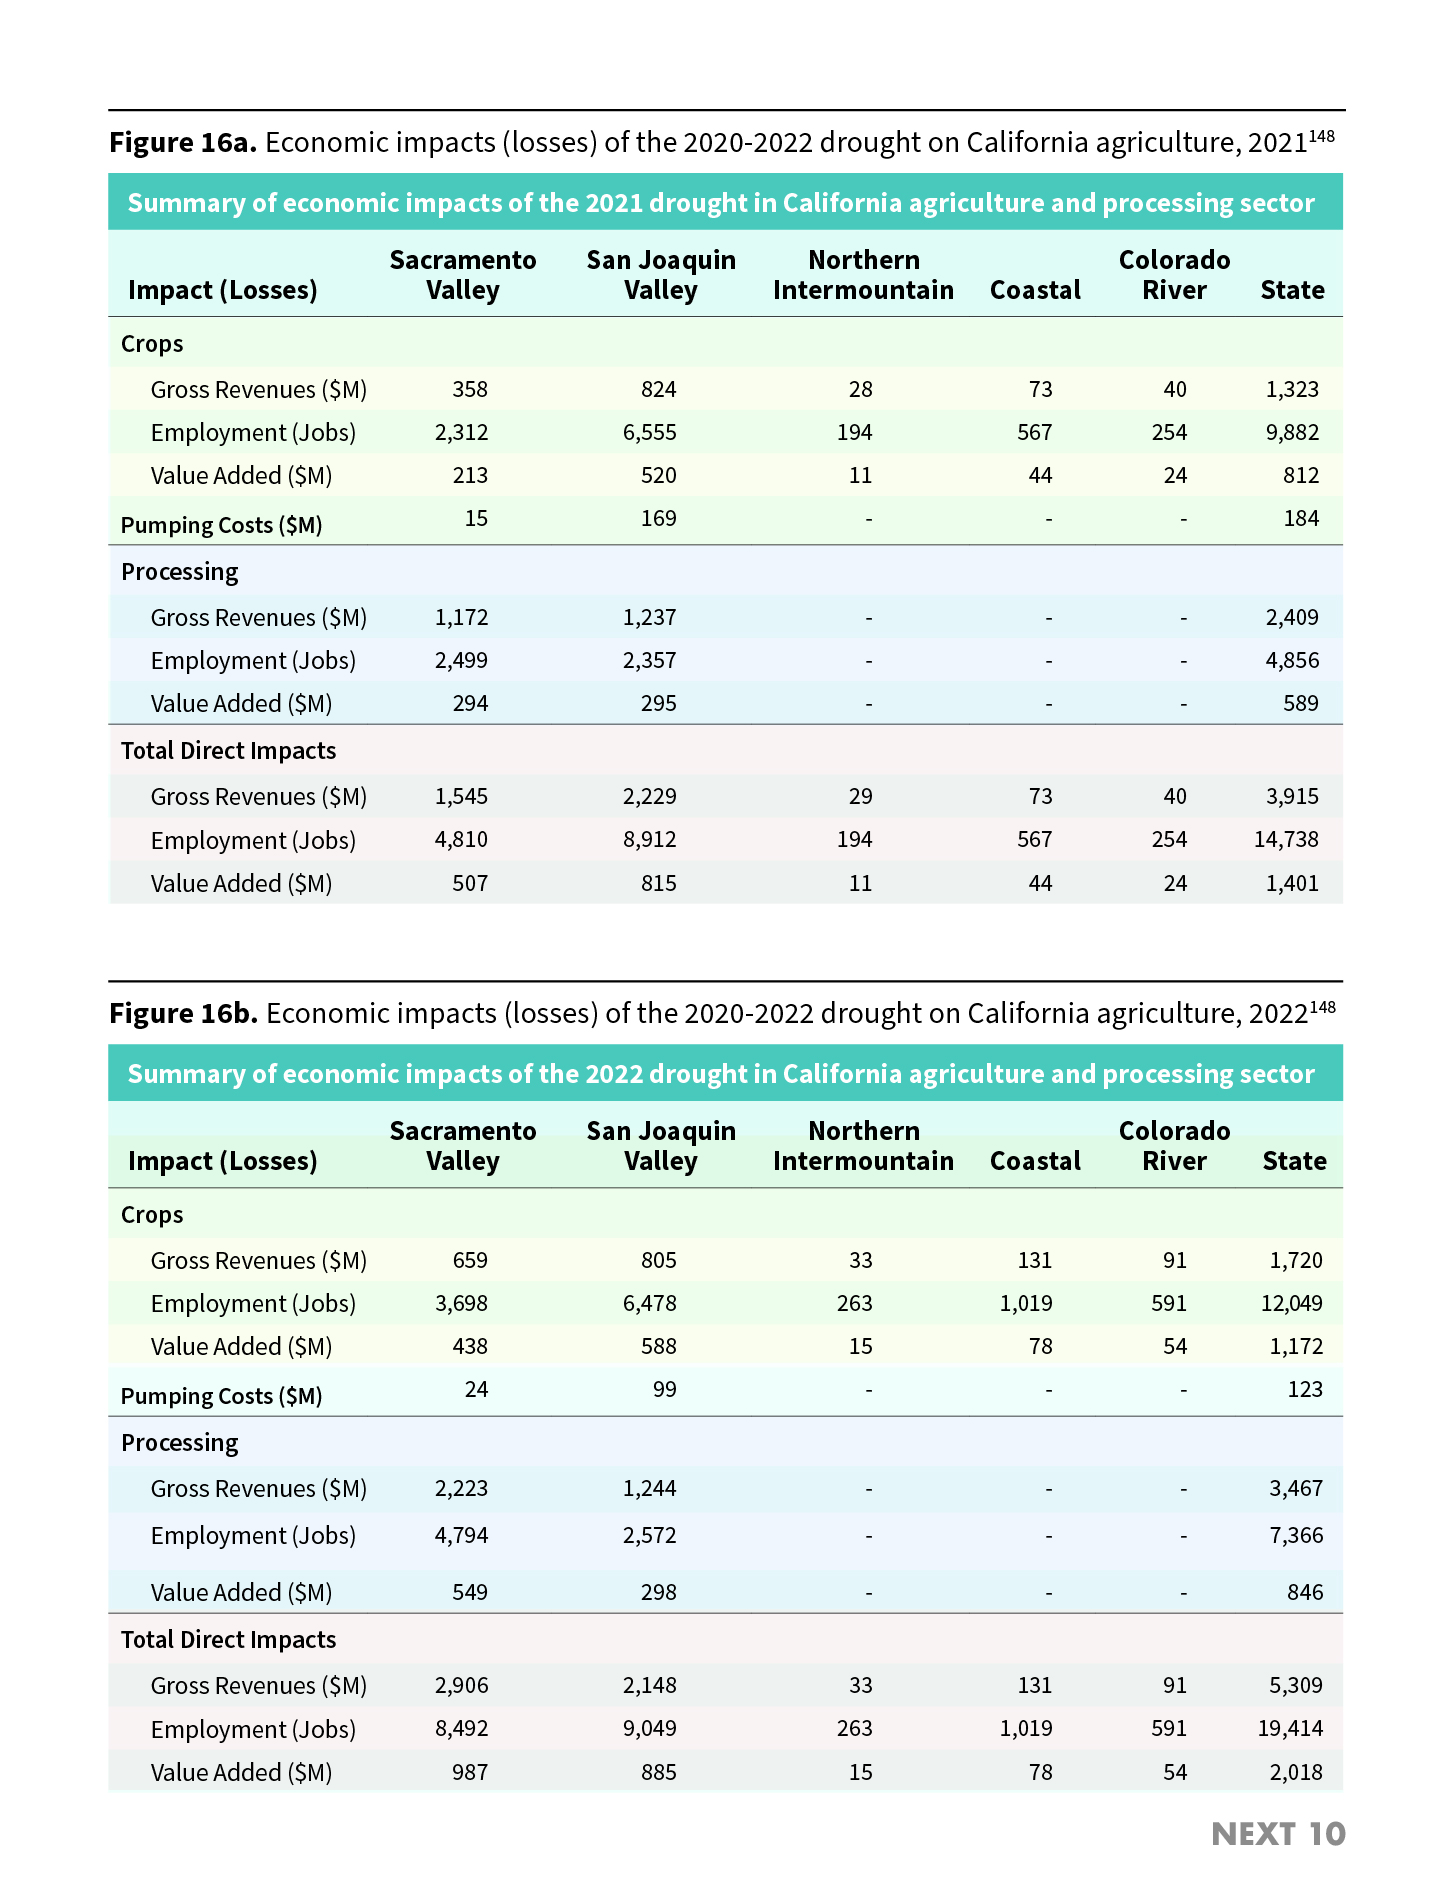
The report finds that the average American born in 2024 is expected to face $500,000 in additional costs due to climate change in their lifetime, those who experience more severe climate impacts can expect to face a toll of up to $1 million. Droughts, made longer and more intense by climate change, bring high financial costs. The economic impact of the 2022 drought in California included an estimated loss of $1.7 billion in revenue for farmers and nearly 5,000 jobs in the Central Valley alone, primarily in crop production. Similarly, workers in majority-outdoor occupations, including emergency responders, construction workers, and farmworkers, are particularly financially affected by the adverse consequences of climate-induced extreme events.
Climate-related health impacts directly translate to rising costs of medical care, hospitalization, and even mortality from extreme events and hazards. Californians exposed to wildfire smoke currently face approximately $84.42 in healthcare costs per day of exposure and researchers project that rising temperatures will result in an additional 7,700 deaths annually by the end of the century due to heat-related illness.
As these costs will only increase as climate change worsens, it is imperative that lawmakers advance policies that both alleviate these rising costs and mitigate the damage from these climate-related disasters. As this report shows, climate resilience and economic well-being go hand in hand. While this literature review provides a holistic overview of the costs associated with climate change, significant information gaps on how climate change affects the costs of food and basic household expenses, businesses, and workers remain.
Next 10 and CLEE hosted a webinar on Thursday, October 30th at 12pm PT where the authors discussed the key findings from the report and implications for policy. Watch the recording here.
Next 10 is not the sole owner of rights to this publication. Usage of this content is subject to permissions, please contact us at info@next10.org for more information.
Featured Graphics

Inflation
- Higher temperatures due to climate change increase the total rate of inflation in the economy by 0.3-1.2 percentage points per year.
Energy Costs
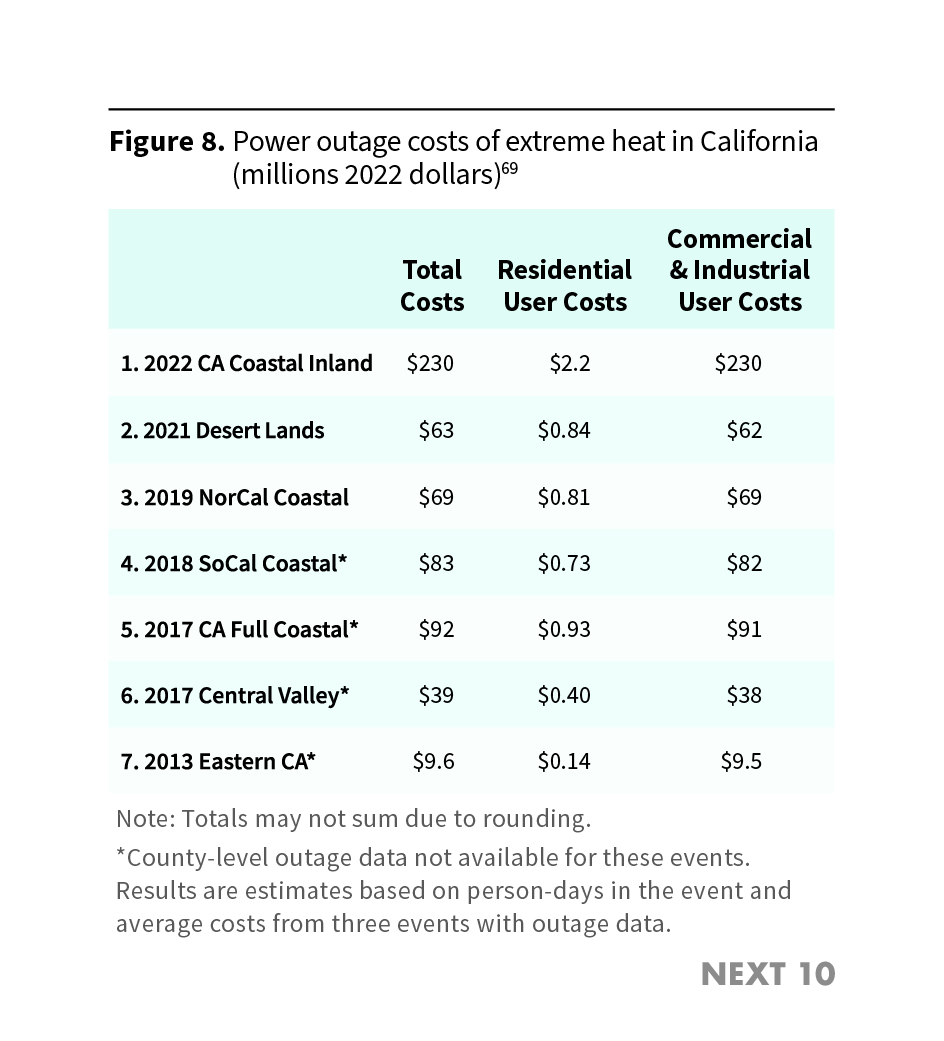
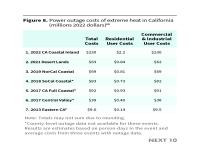
- For each additional day over 95°F, electricity costs increase by 1.6%, due to increased use of air conditioning and other cooling technologies.
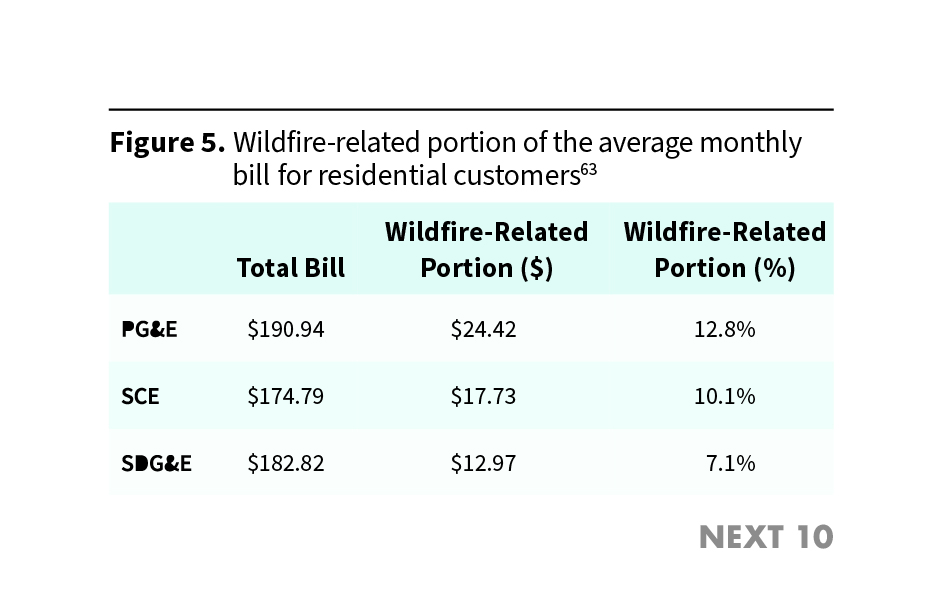
- In 2023, the wildfire-related portion of the average customer’s bill for three investor-owned utilities ranged from 7.1% to 12.8%.
Wages and Employment
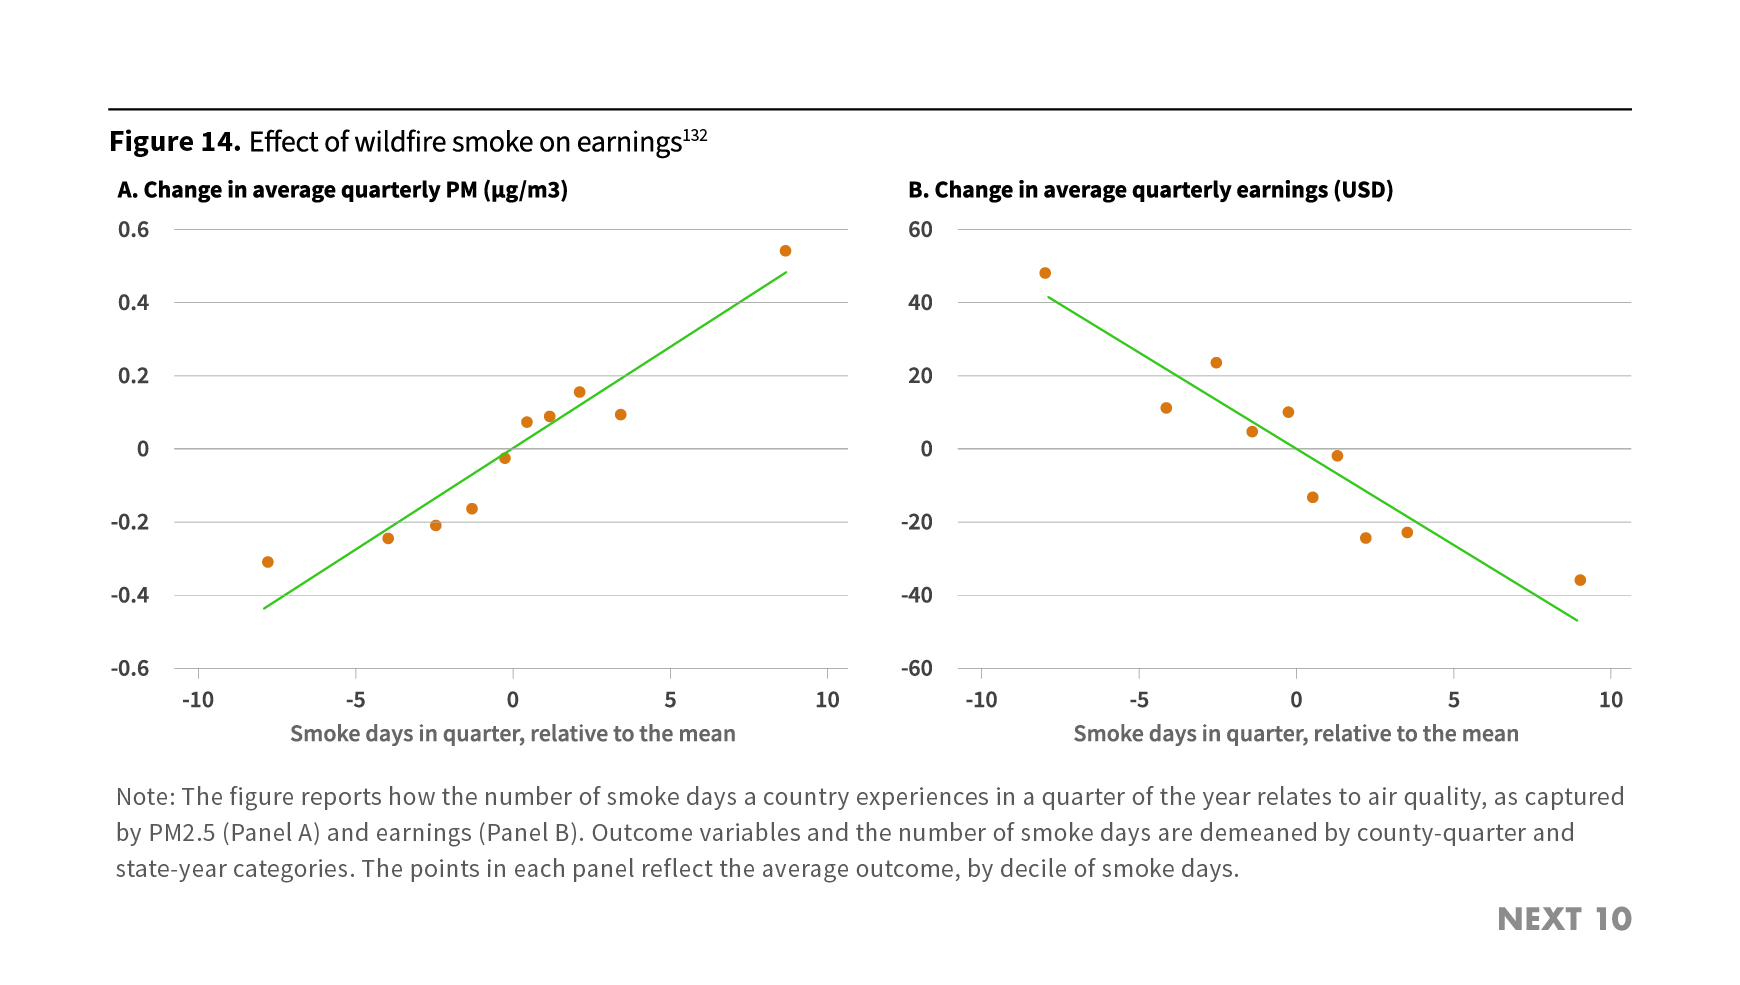
- Climate-driven extreme events may create unsafe labor conditions due to wildfire smoke or extreme temperatures, leading to reduced productivity, hours and wages, furlough, or even job loss.
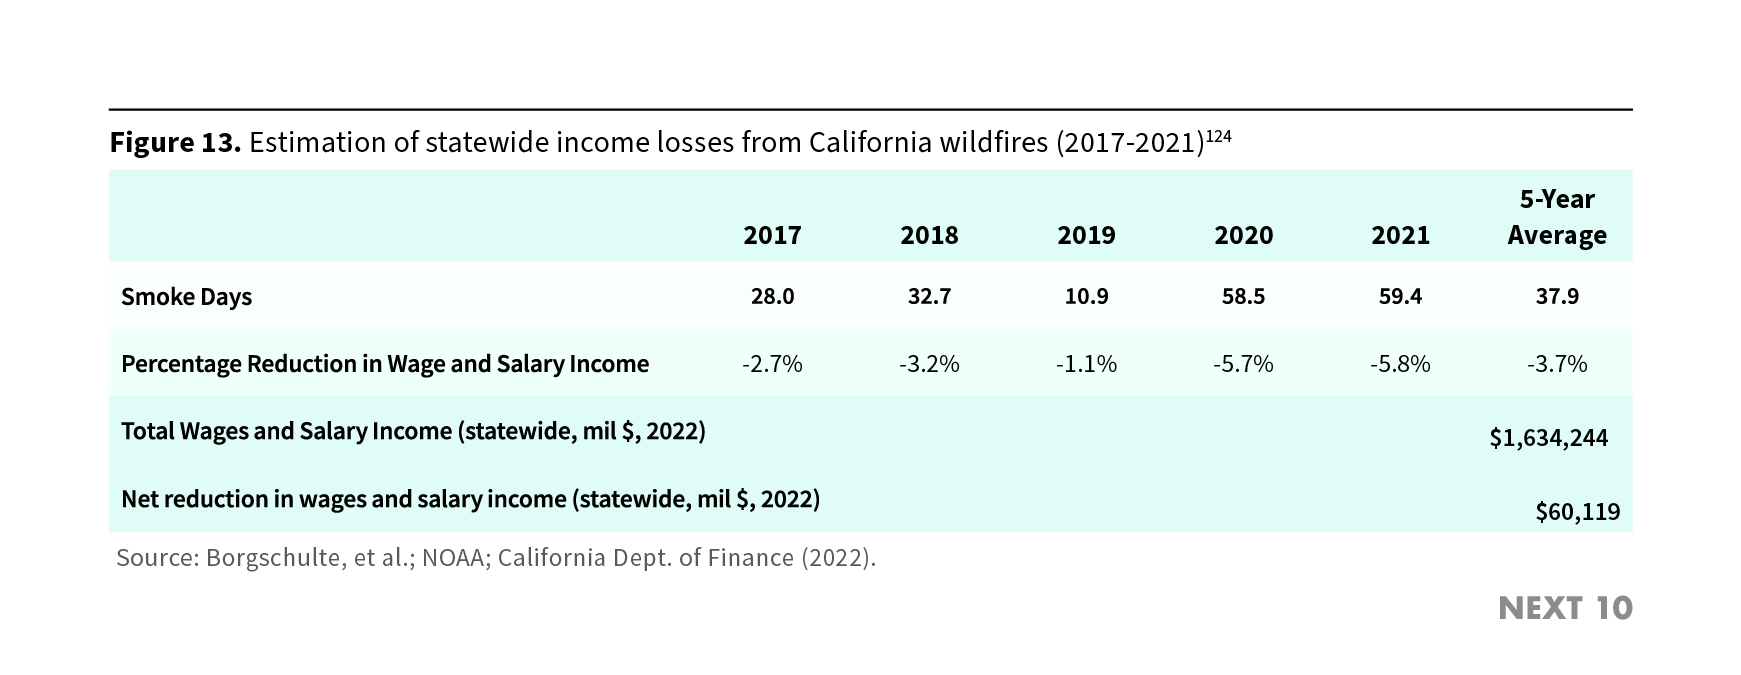
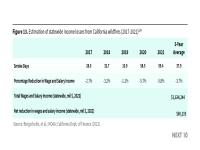
- Wildfire resulted in approximately $60 billion in income loss, statewide, from 2017 to 2021.
- For each 1 μg/m3 annual increase in PM2.5 from wildfire smoke, annual labor earnings decrease by $123 billion across the U.S. (in 2018 dollars). These reductions are primarily seen across the utilities, crop production, manufacturing, healthcare, and transportation sectors due to decreased workforce participation.
Wildfire Costs
- This winter’s Los Angeles wildfires wiped out generations of family wealth, but were also responsible for approximately $297 million in lost wages for local employees.
- Major wildfires are also associated with a 2.2% drop in home prices in surrounding neighborhoods, closely associated with wildfire proximity, frequency, and scale.
Health Costs
- The cost of healthcare rises in tandem with the worsening of climate change: Californians exposed to wildfire smoke currently face approximately $84.42 in healthcare costs per day of exposure.
- Climate change fuels hotter temperatures, which in turn worsen pollution from ozone and fine particulate matter, causing respiratory and other health problems — both of which contribute more than $70 billion to healthcare costs in California.
- Researchers project that rising temperatures will result in an additional 7,700 deaths annually by the end of the century due to heat-related illness.
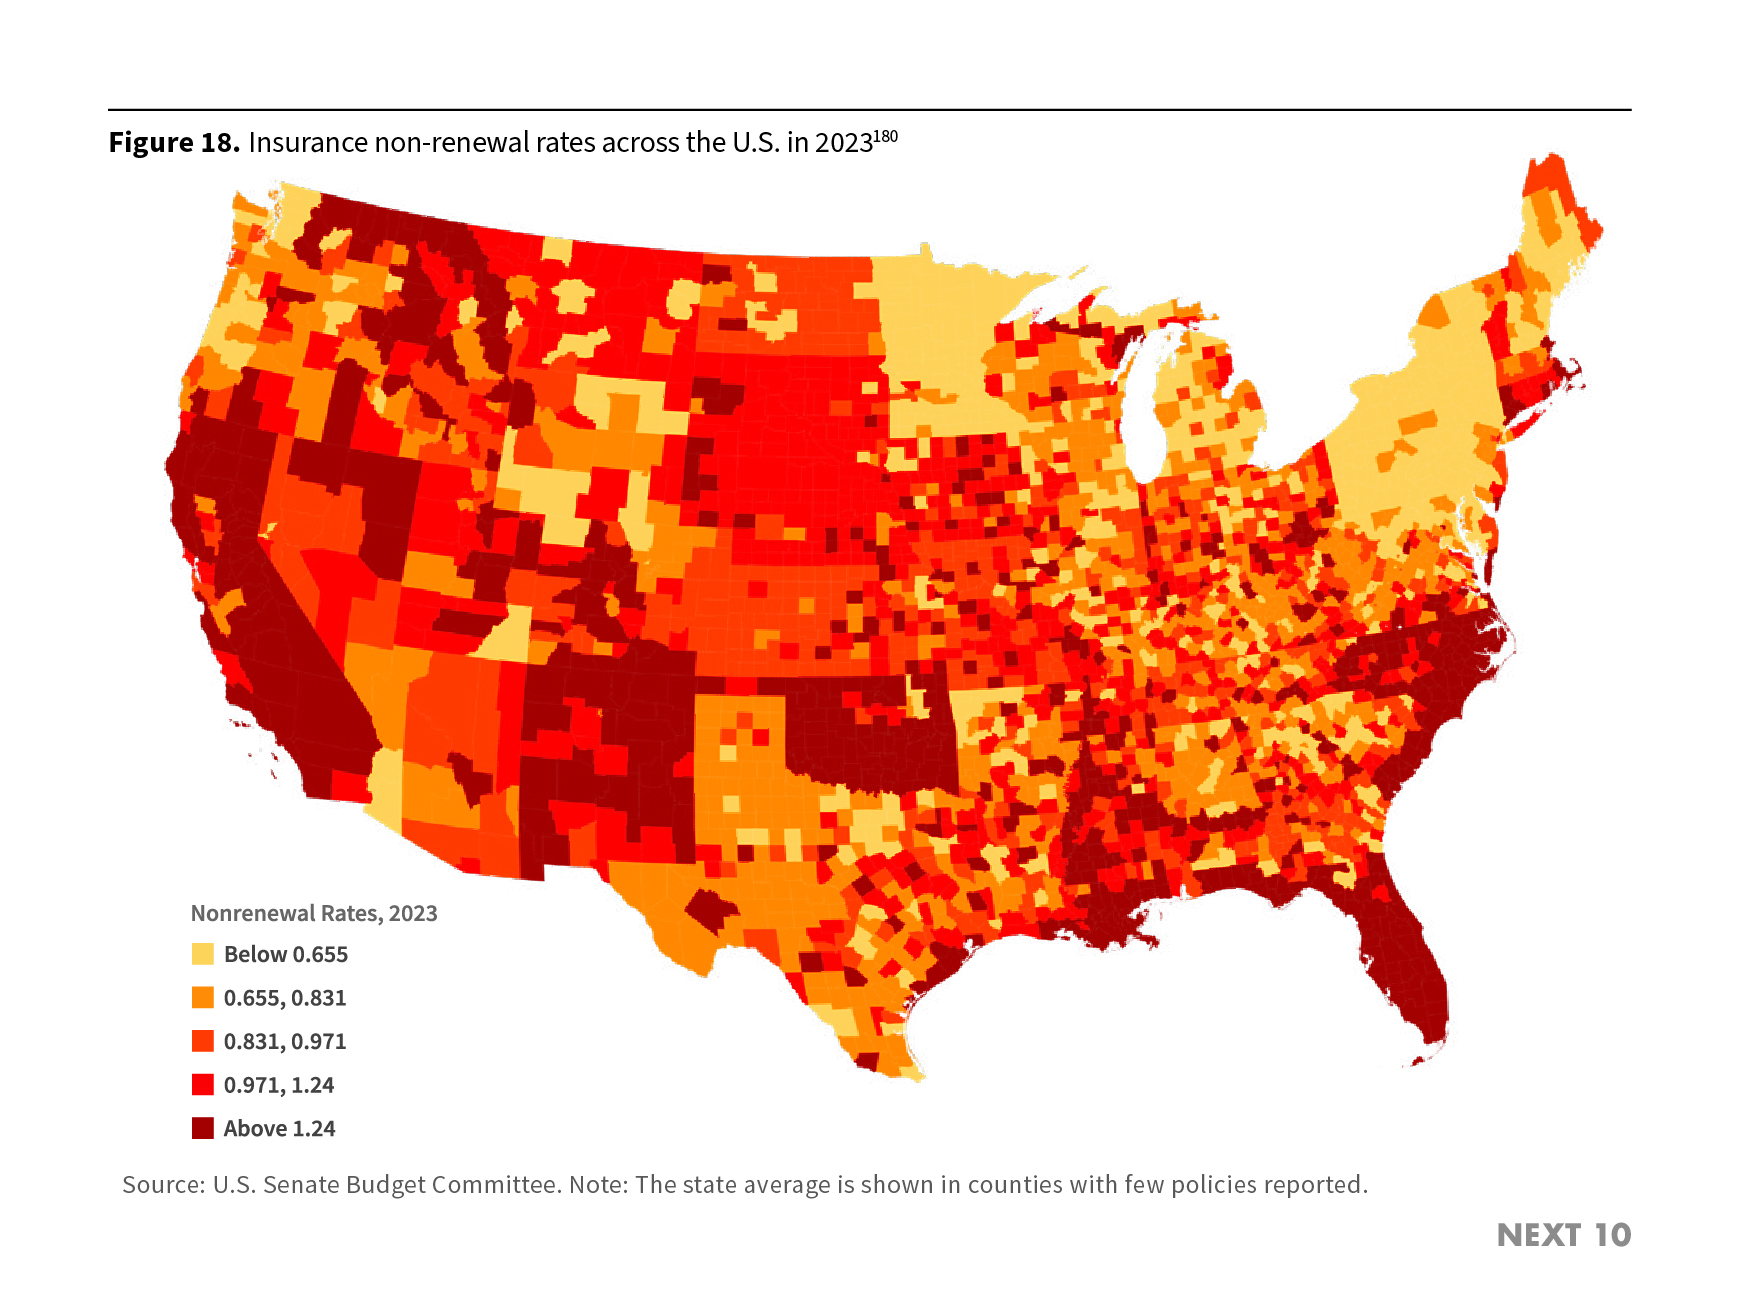
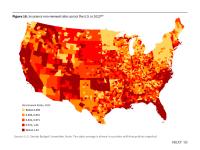
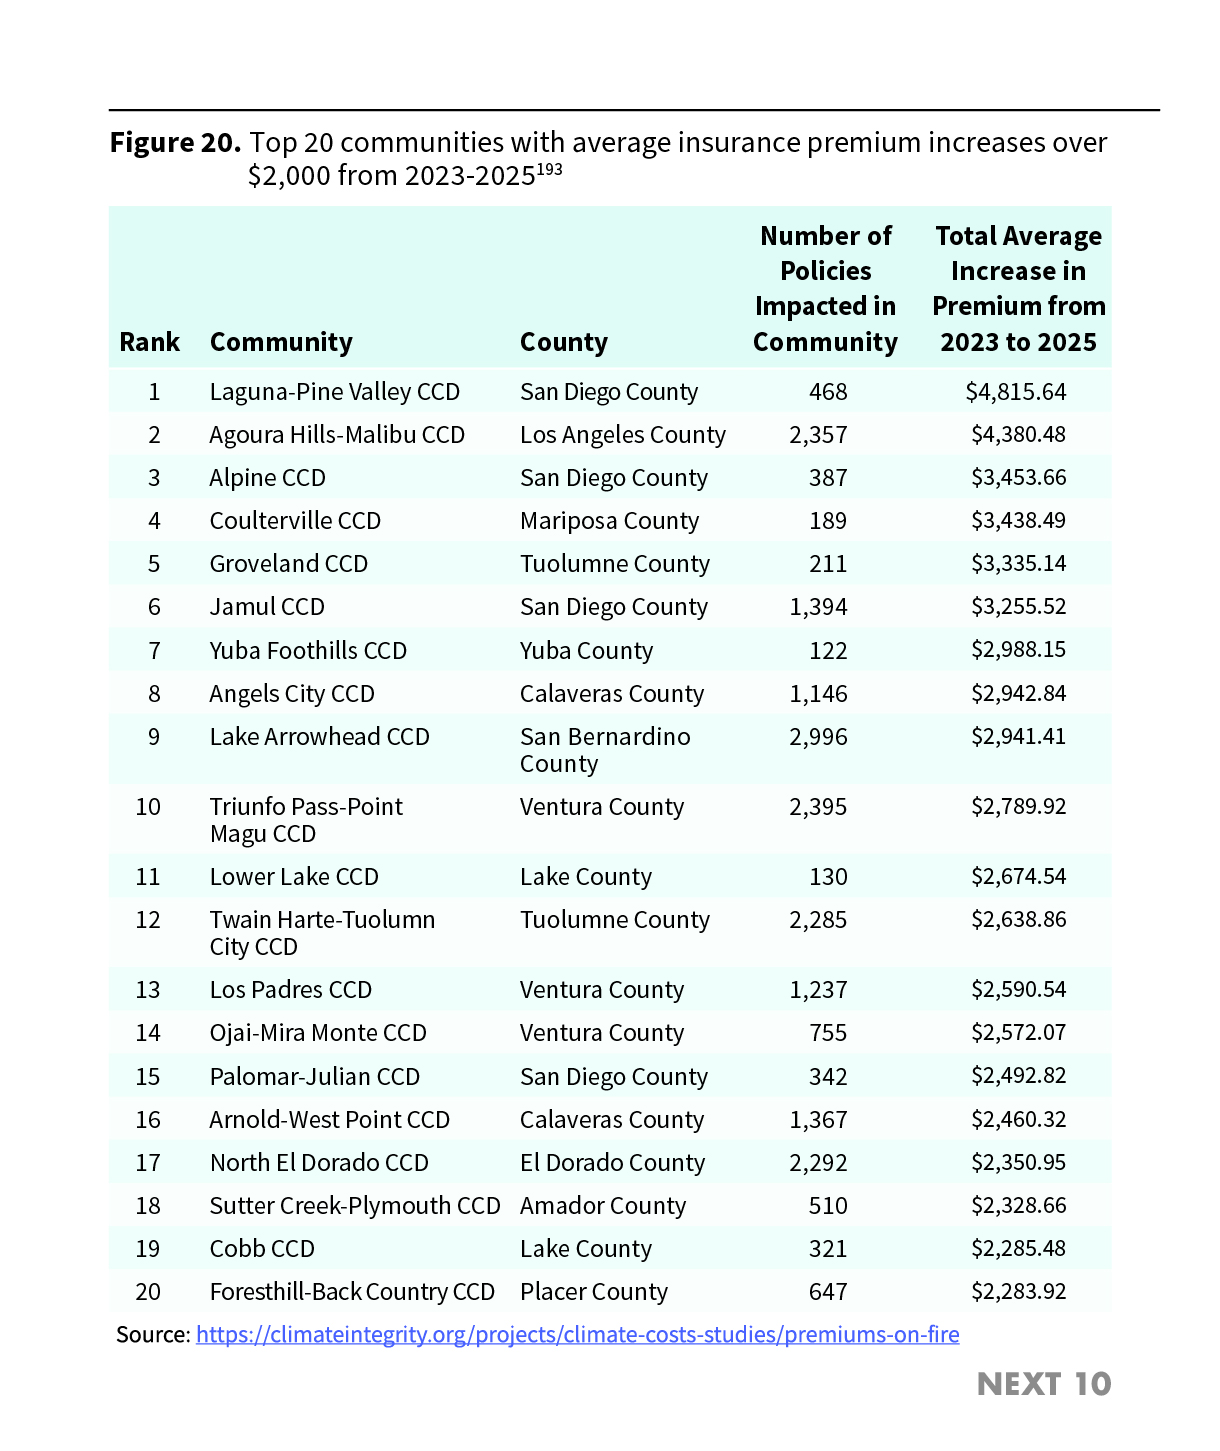
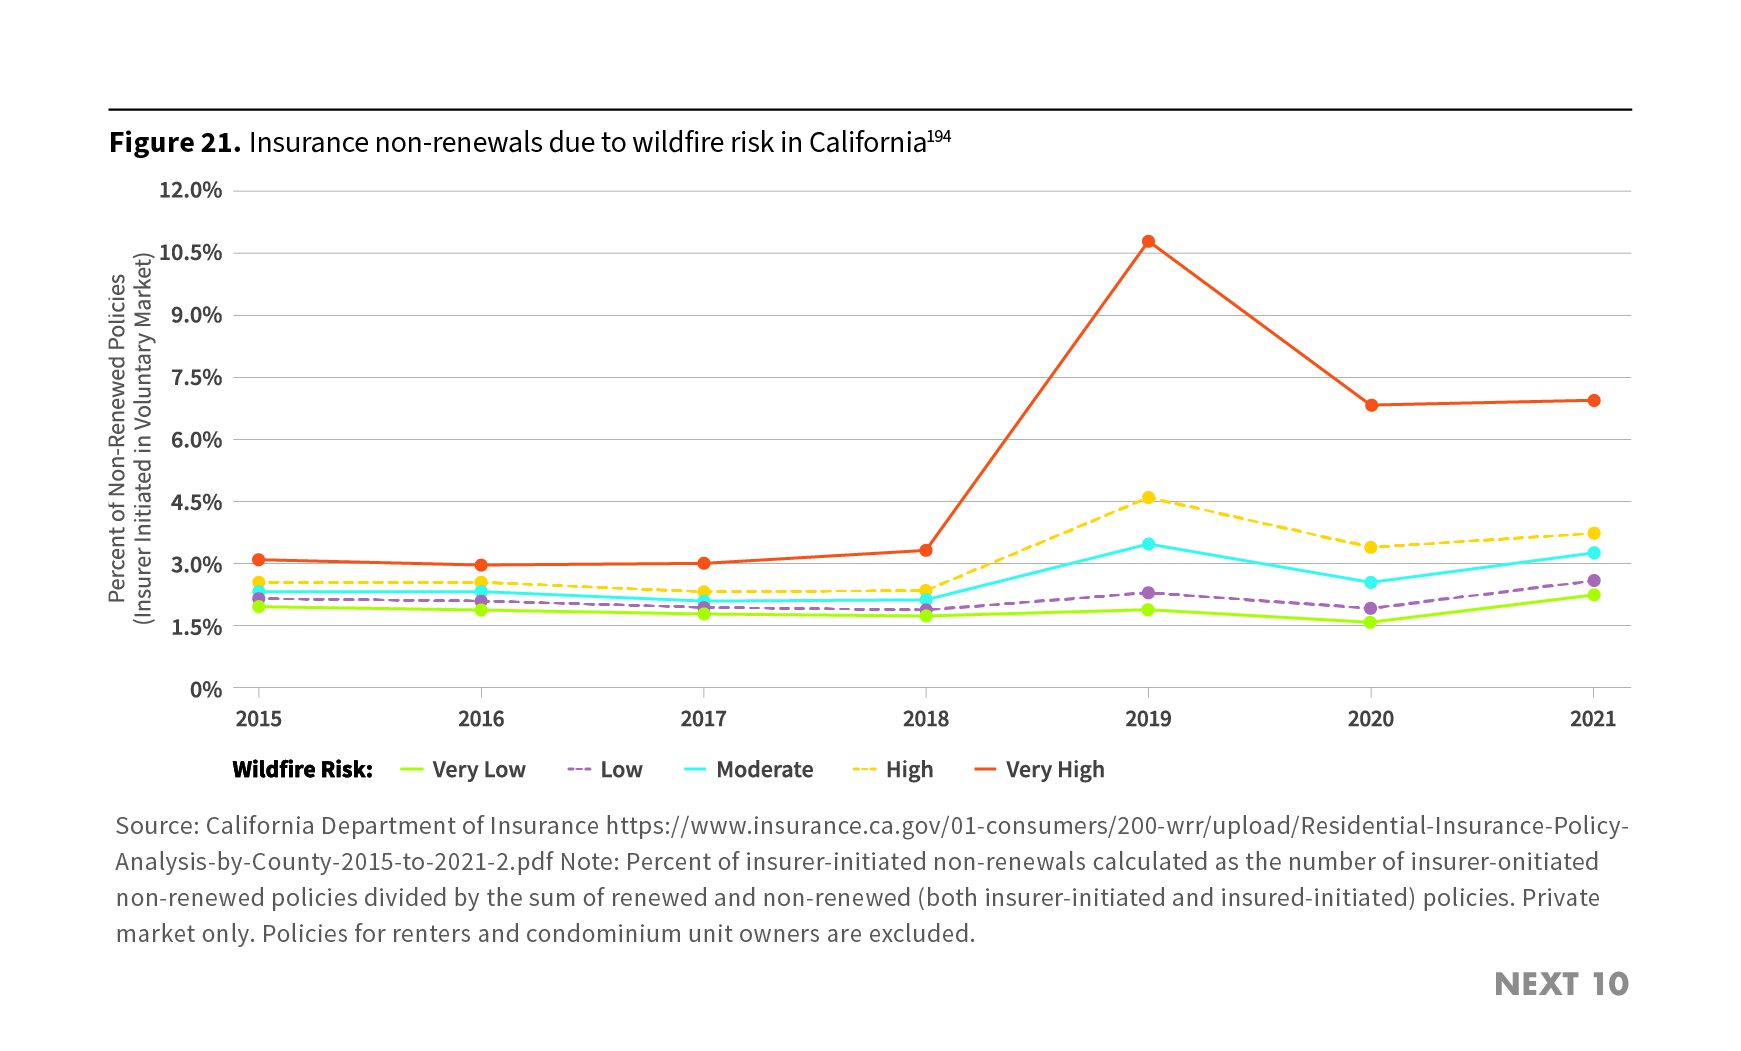
Insurance Costs
- Home insurance premiums rose over 23% between 2017 and 2022 as severe wildfire seasons incurred record-breaking infrastructure damages across the state.
- The 2020 wildfire season is estimated to have generated between $5 billion and $9 billion in insured losses, while the 2017 and 2018 wildfire seasons each produced over $10 billion in insured losses.
Food Costs
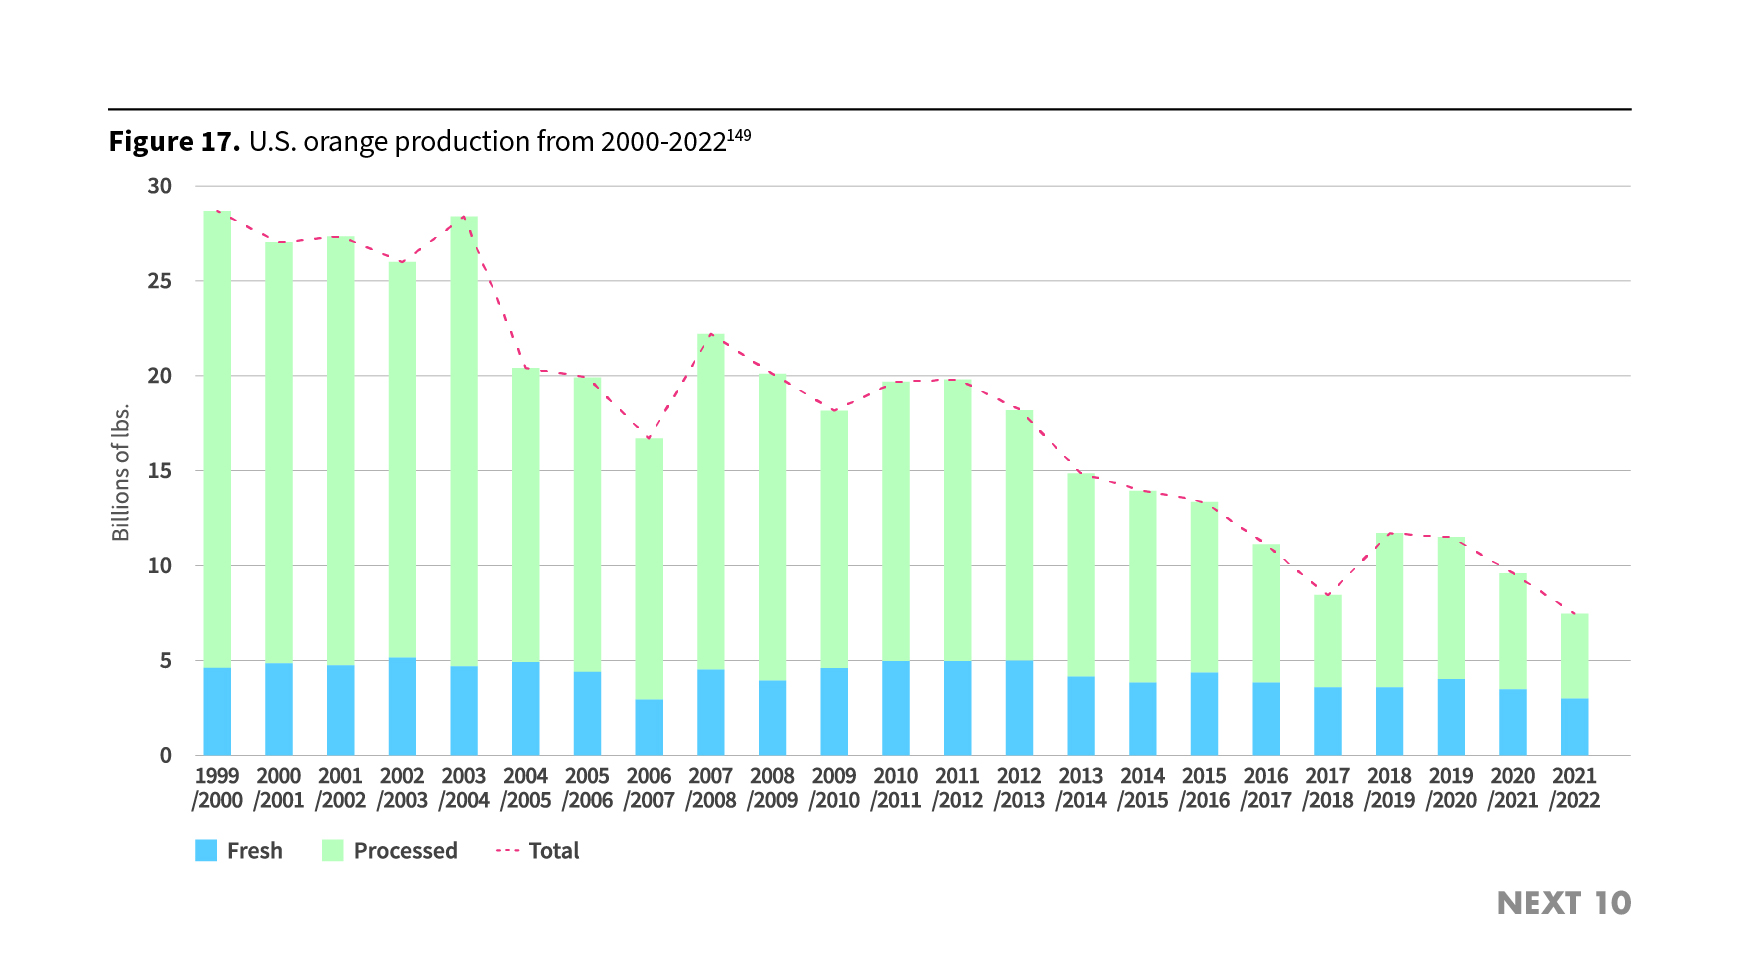
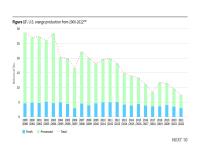
- Climate-related disruptions affect costs of food items. For example, orange juice concentrate prices in the U.S. (majority of which is produced in California and Florida) nearly doubled from 2020 to 2024 due to storm damage and climate-related stresses.
Next 10 cannot grant permission to use graphics from this publication; additional permissions may be required from the copyright holder. Please view our Terms of Use policy for more information or contact Next 10 at info@next10.org with any questions.