Publications
Expanding Access to Sustainable Transportation in California
Next 10’s latest brief ranks urban and rural counties and regions throughout California on clean transportation progress—and finds surprising good news stories from certain rural counties despite a continual upitck in vehicle miles traveled across the state.
While solutions may differ across urban, suburban, and rural counties, local and state leaders must increase access to clean transportation alternatives across the state if California is to address the climate crisis and protect public health in areas with historically high air pollution levels. Transportation remains the largest source of greenhouse gas emissions in California, accounting for 41 percent of all statewide emissions in 2017, with on-road passenger vehicles alone representing 28 percent of statewide emissions.
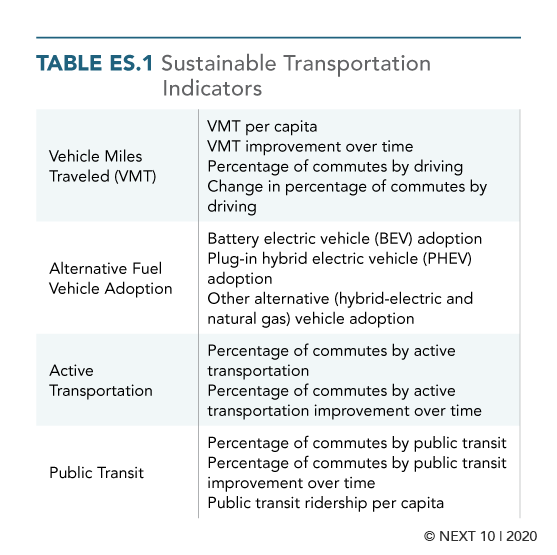
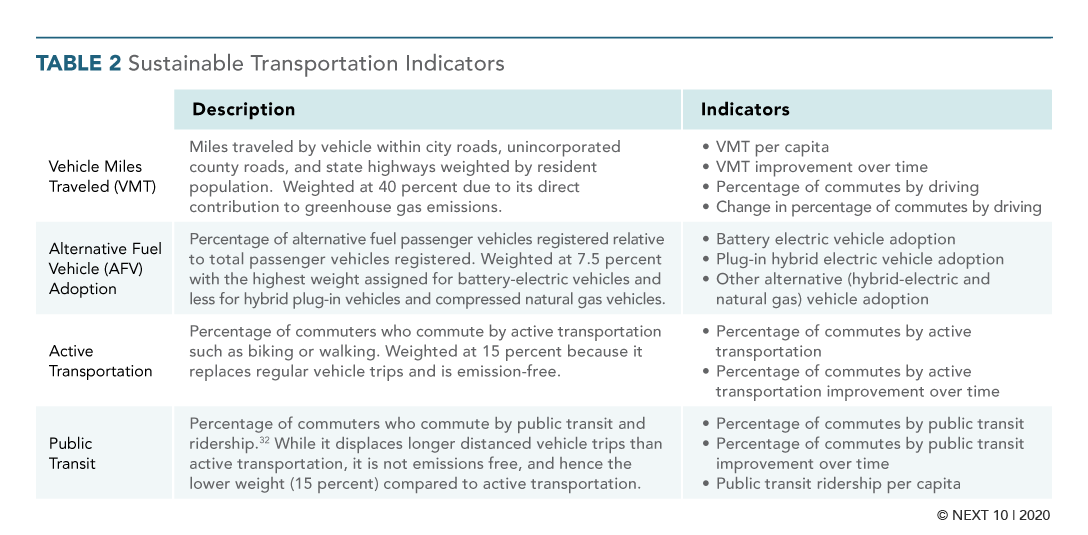
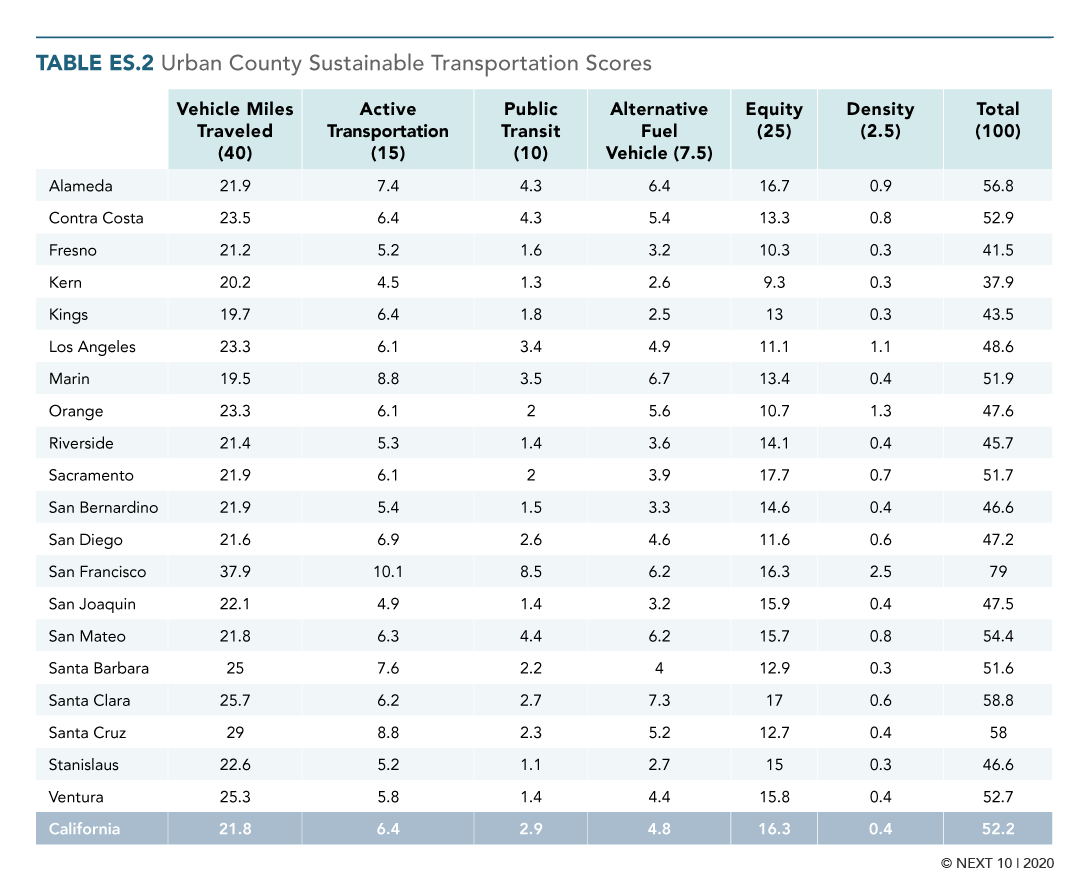
The report, Expanding Access to Sustainable Transportation in California, was prepared by Beacon Economics and looks at 12 sustainable transportation indicators across four main categories—vehicle miles traveled reductions, clean vehicle adoption, and active transportation and public transit use—to compare how California counties and some of the largest regions are performing when it comes to providing equitable access to clean transportation choices, while recognizing that solutions will look different in rural vs. urban counties.
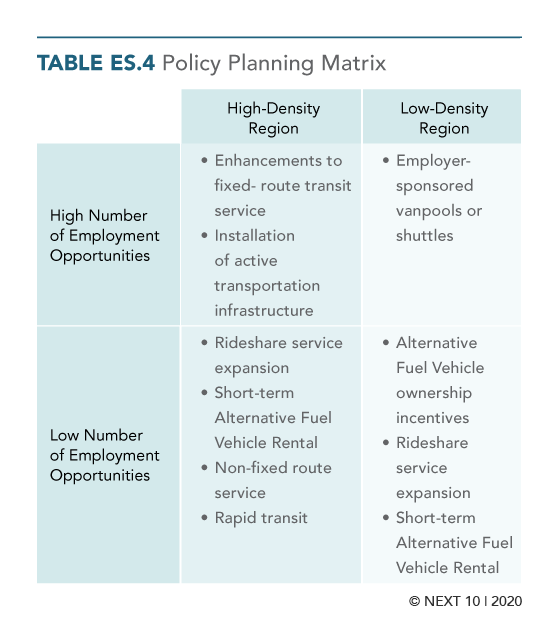
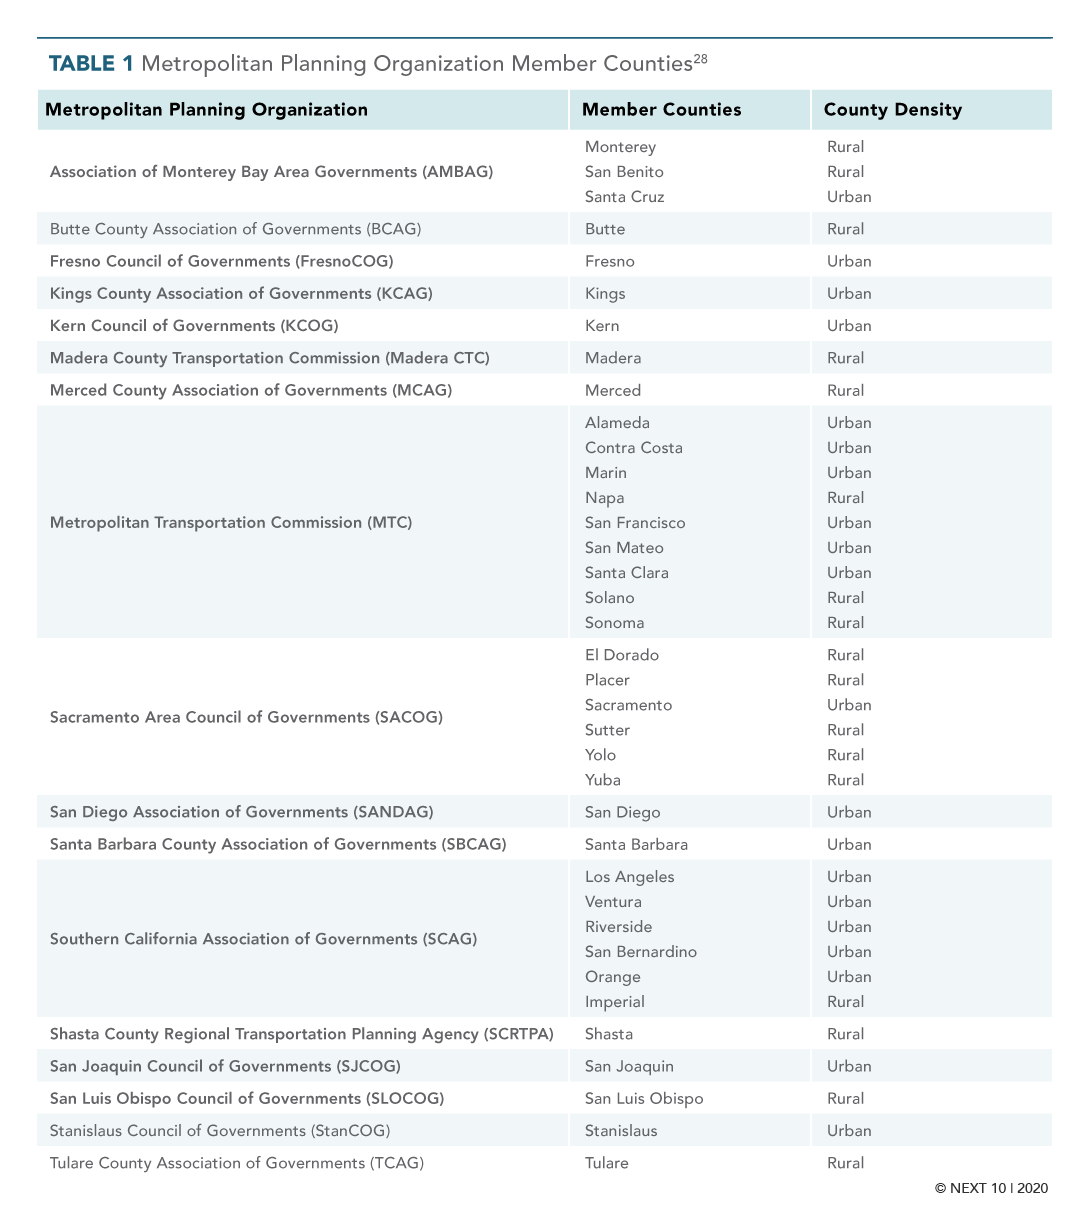
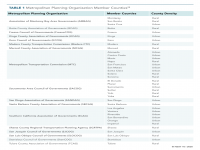
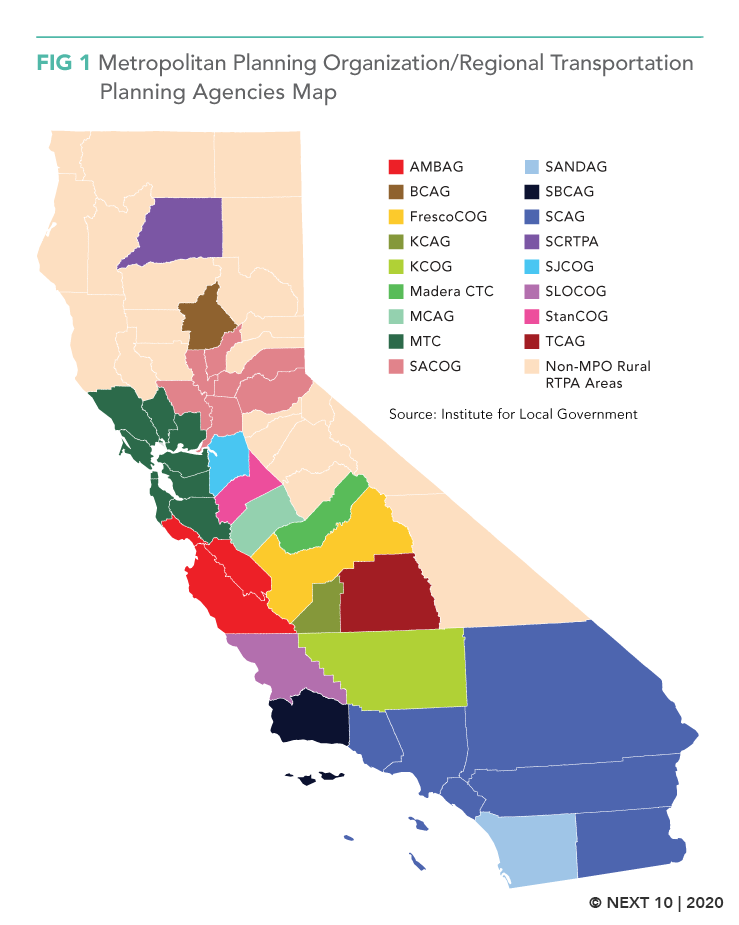
The brief also examines performance through a regional lens, as large-scale transportation planning, management, and funding streams are typically conducted at the regional level through a transportation authority or metropolitan planning organization (MPO). Home to some of the nation’s largest MPOs, California provides a number of examples for how best to incorporate equitable access to clean transportation choices into regional planning. The Bay Area ranks the highest in the state in sustainable transportation performance, while the Sacramento region is home to leading rural counties.
Next 10 owns the rights to this publication. Any usage of content from this publication is subject to our Terms of Use.
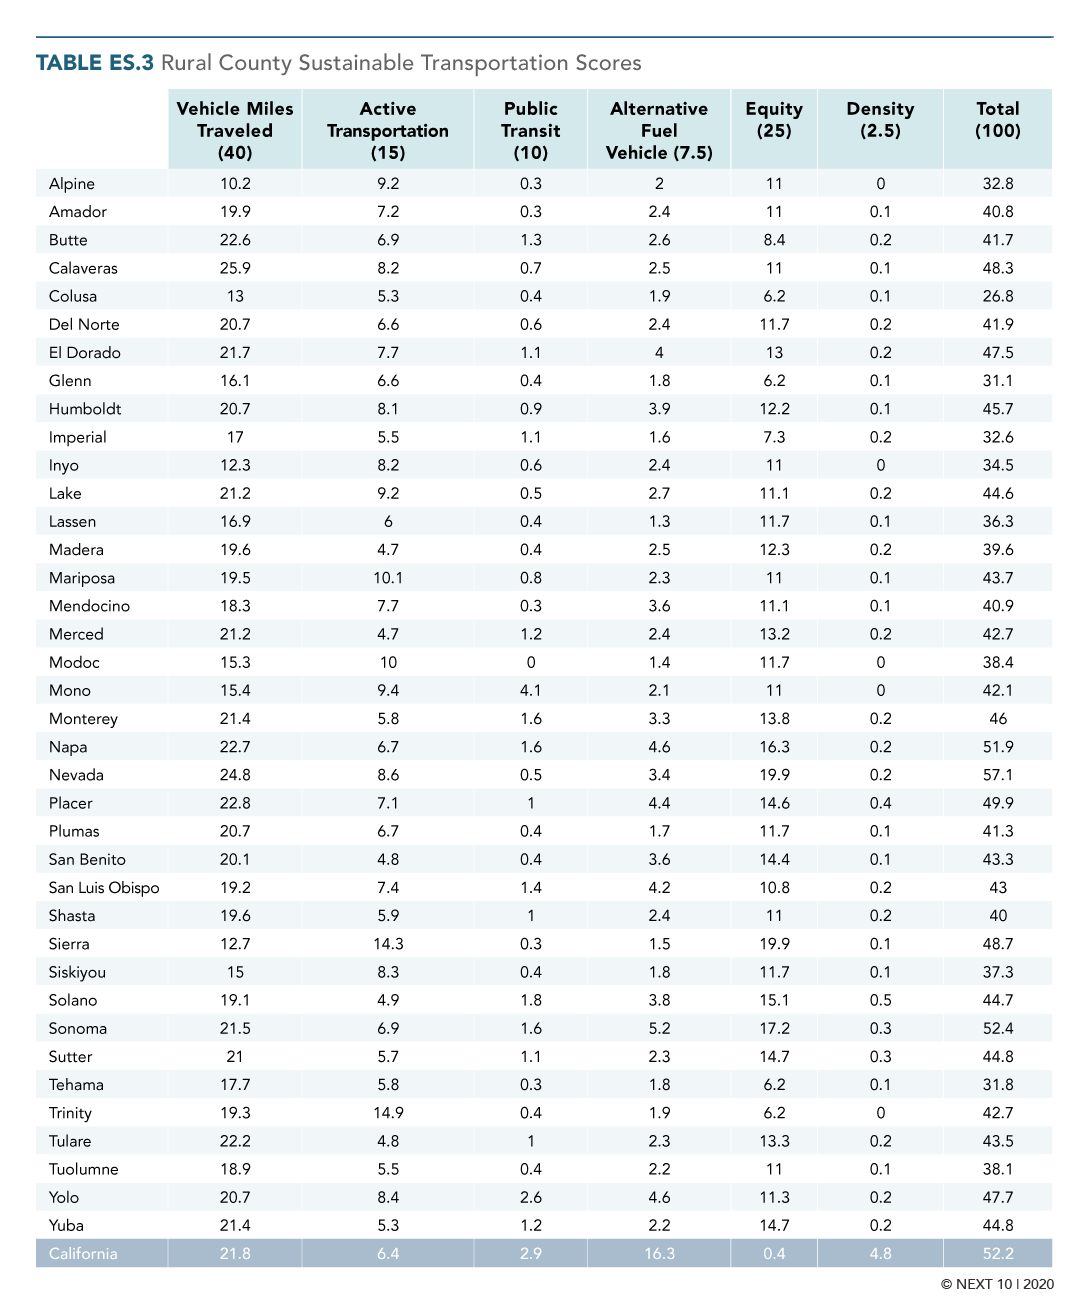

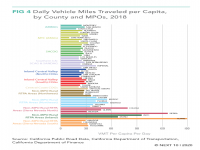
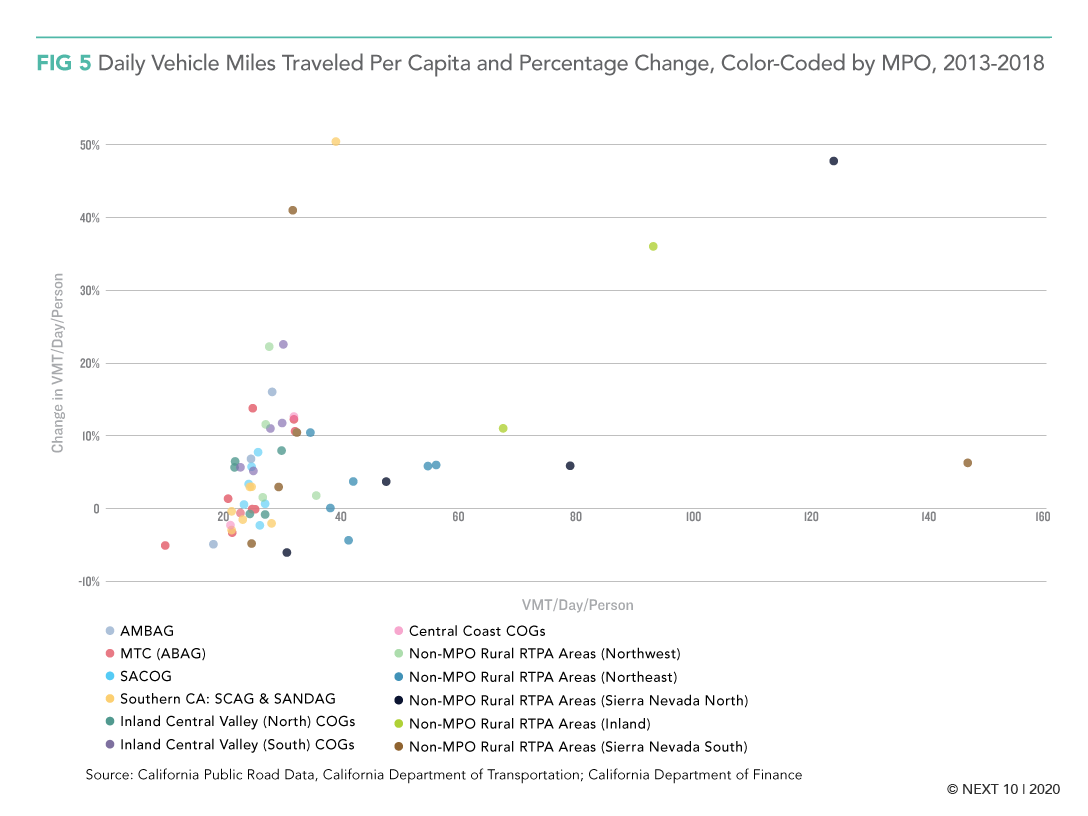
- Rural counties are leading by driving less: Surprisingly, despite their higher daily average VMT, several rural counties have cut VMT through innovative planning and programs.
- Statewide: Six rural counties (Calaveras, Merced, Napa, Nevada, Placer, and Plumas) saw a reduction in VMT per capita between 2013 and 2018.
- Nevada County: Reduced VMT per capita by 6 percent—the largest decline statewide.
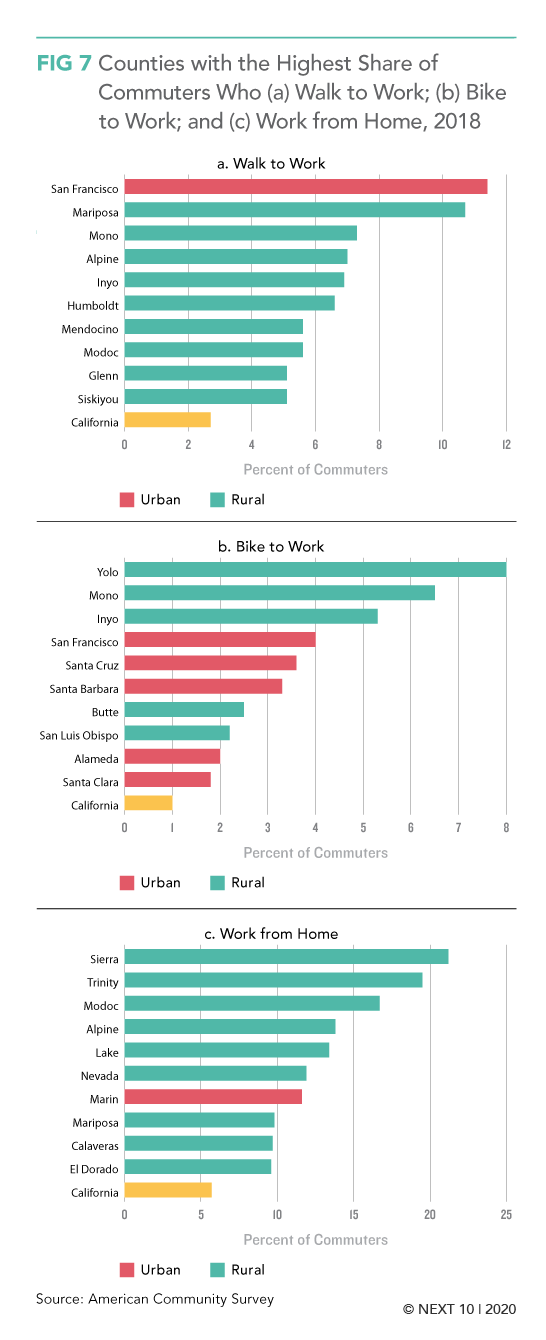
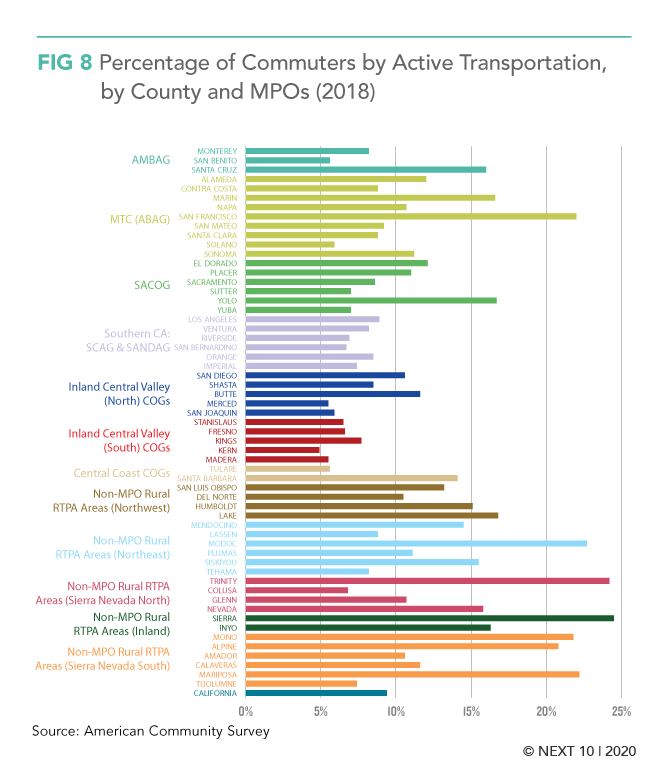
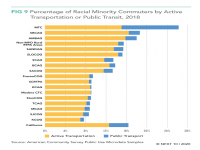
- Rural counties lead on active transportation to work, too: Four rural counties have a higher share of commuters by active transportation than San Francisco (22%): Sierra County (24.5%), Trinity County (24.2%), Modoc County (22.7%), and Mariposa County (22.2%).
- Statewide, the ten counties with the best performance in terms of active transportation use are majority rural: Trinity, Sierra, Mariposa, Modoc, Mono, Alpine, and Lake.
- Active transportation includes walking, biking, scooters, and working from home.
- Working from home could provide opportunity for improving air quality and addressing climate: Social isolation policies are clearly affecting traffic volumes across the state.
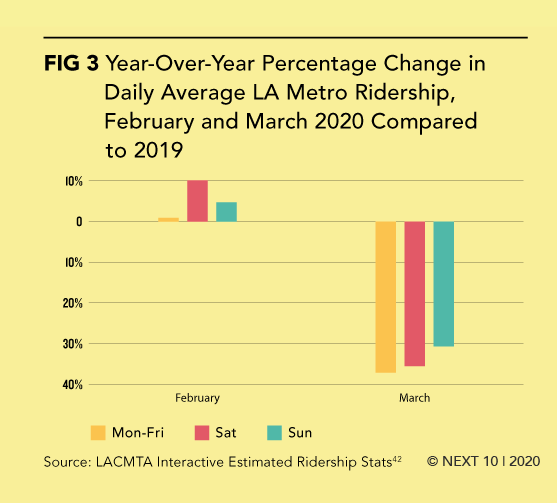
- In Los Angeles County, VMT dropped 34 percent from 96 million miles in early March to 63 million miles in early April—contributing to a 31 percent decrease in PM 2.5 pollutants. Overall, Southern California experienced a 20 percent improvement in air quality during this period.
- Some California companies, such as Twitter and Square in the Bay Area, have already announced that they will allow most employees to work from home indefinitely—even after the pandemic ends. Studies suggest that as many as 29 to 37 percent of workers nationwide could potentially work remotely full-time – if these trends continue post-COVID-19, it could have a meaningful impact on air quality improvements and GHG emissions reductions.
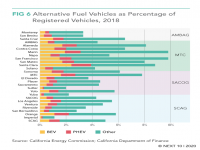
- California urban counties lead on clean vehicle adoption, but some rural counties are catching up: Rates of adoption for clean vehicles remain higher in urban areas and are generally linked to higher incomes.
- California’s urban centers are leaders nationwide in terms of clean vehicle adoption, with the state home to top five U.S. cities in terms of electric vehicle adoption. Large urban counties tend to have higher percentages clean energy vehicle market share than rural counties in California: Santa Clara (8.8%), San Francisco (9.9%), San Diego (5.1%), Los Angeles (5.5%), and Sacramento (4.4%).
- However, rural counties are catching up. Yolo County, with its 220,000 residents, also boasts a nearly 6 percent adoption rate on clean energy vehicles in large part due to the expansion of and continued investment in the deployment of clean vehicle charging stations.
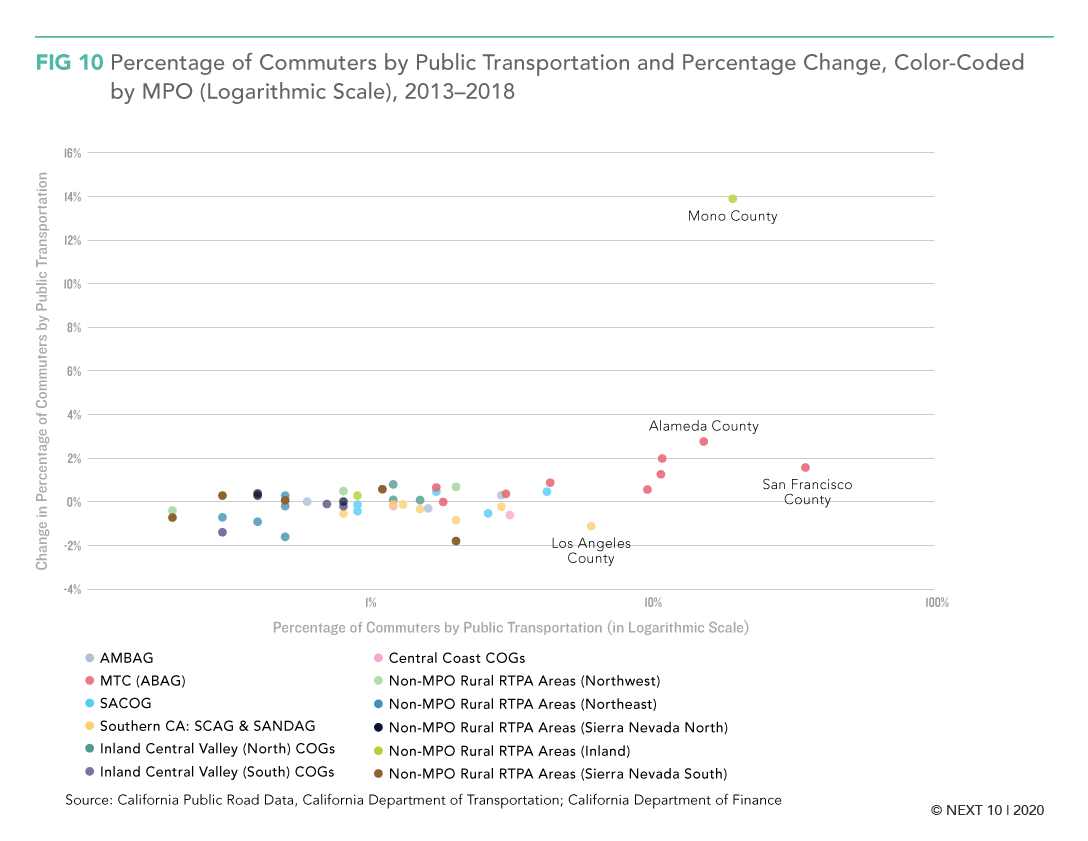
- Statewide, there is a short-term drop-off in public transit ridership, and a need for long-term investment:
- Southern California - Transit ridership has been falling and Southern California has been struggling to attract and retain riders. Between 2013 and 2018, transit use fell 16.7 percent in San Bernardino (serving 1.5% of total commuters as of 2018) and 7.1 percent in Riverside (serving 1.3% of total commuters in 2018).
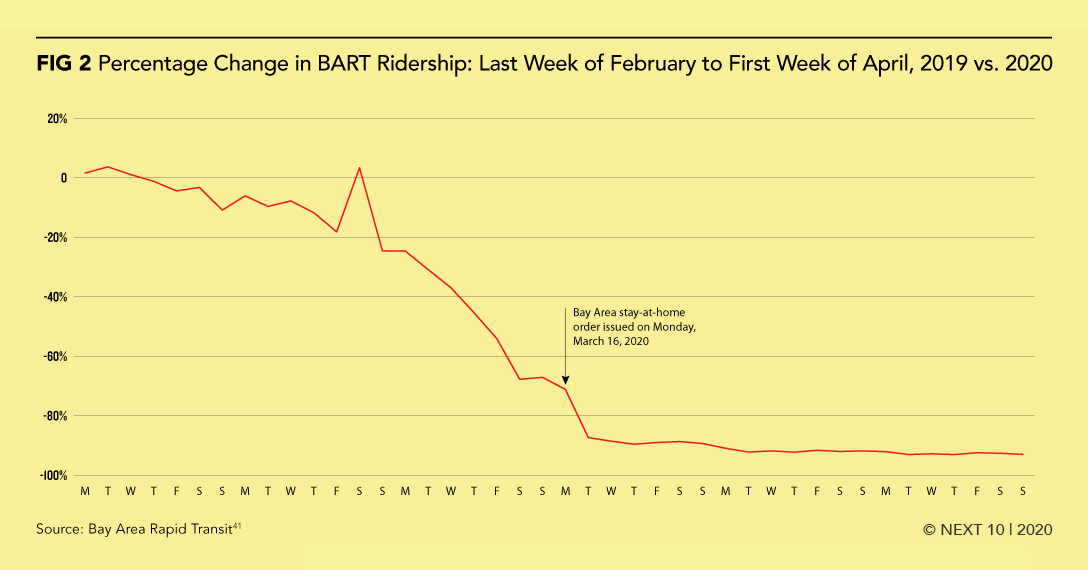
- Northern California - Ridership on BART had been growing prior to the pandemic but has dropped dramatically due to COVID-19.
Regional Success Snapshots:
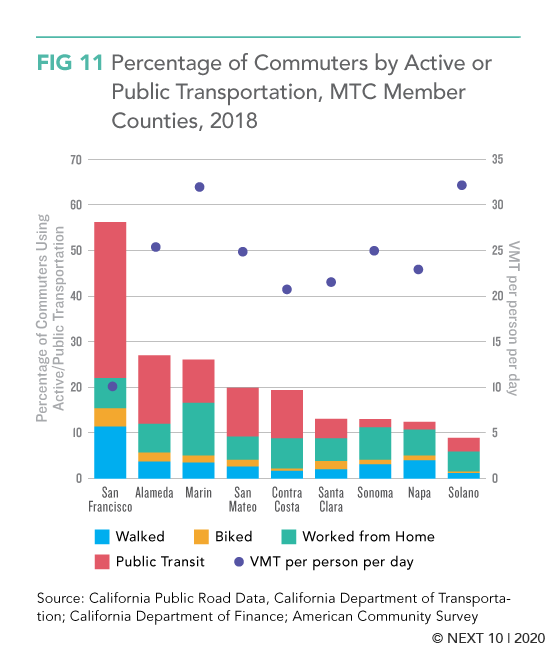
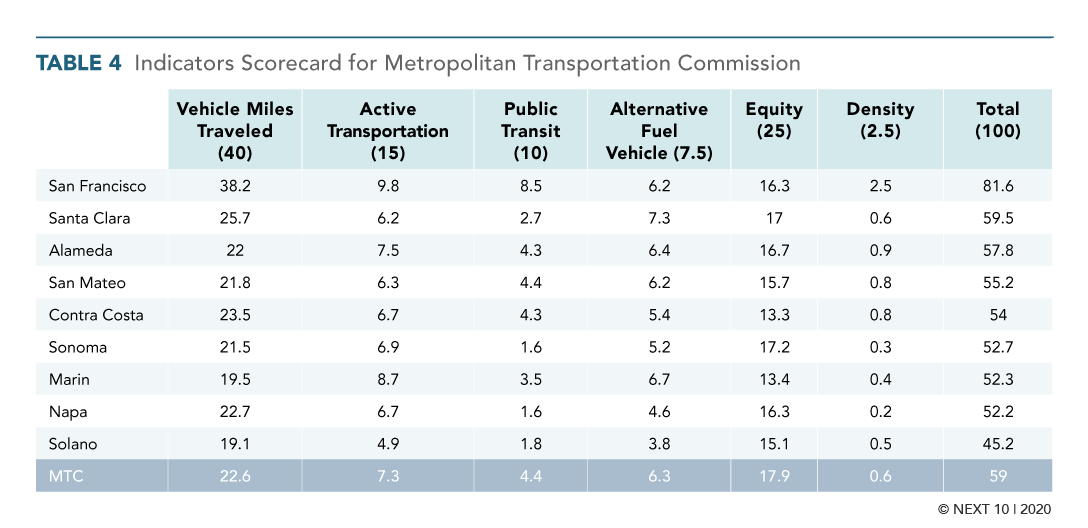
- The Bay Area ranks highest in the state in sustainable transportation performance:
- As the fourth largest MPO in the country, the Bay Area’s Metropolitan Planning Commission (MTC) and Association of Bay Area Governments (ABAG) is home to the two best-performing counties statewide—San Francisco (1st) and Santa Clara (2nd).
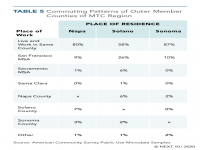
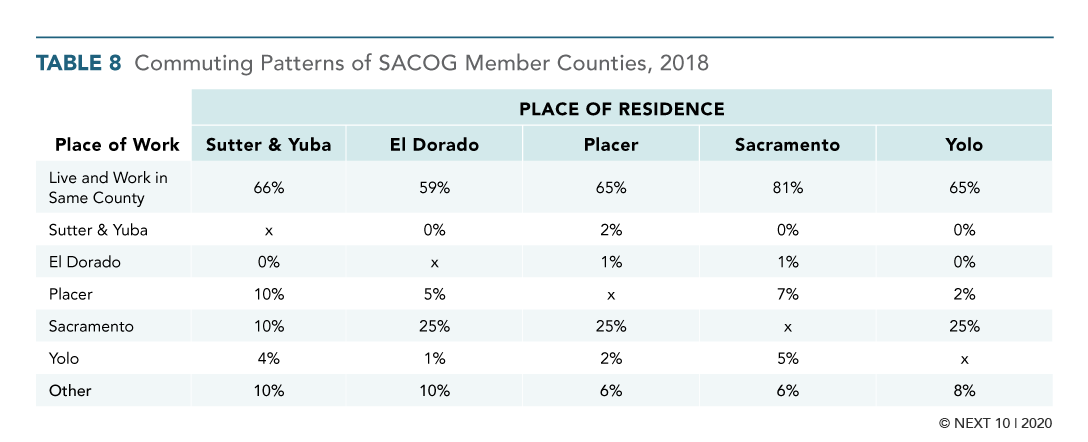
- The balance of jobs and housing has grown increasingly divergent in the MTC region in recent years, underscoring the challenge that a lack of affordable housing has presented in terms of commute patterns. In Solano County, for example, under 60 percent of the county’s residents worked in the same county in 2018, compared to 80 percent of Napa County’s residents and 87 percent of Sonoma County’s residents. Over a quarter of Solano’s residents commute to the San Francisco metro area, while six percent commute to the Sacramento Area and Napa County.
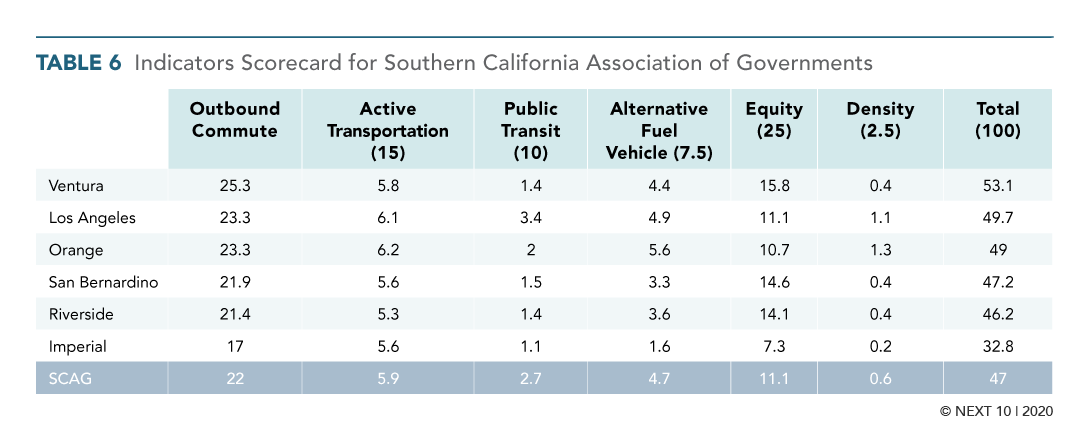
- Southern California’s diverse population is just as diverse in terms of sustainable transportation performance:
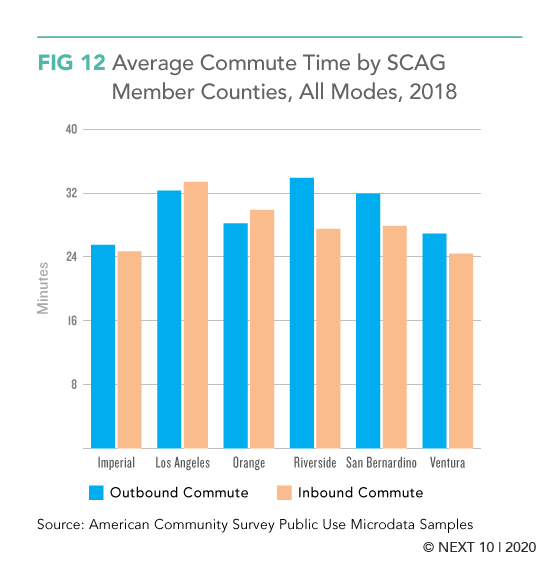
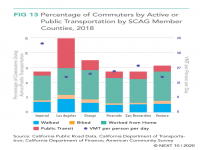
- The Southern California Association of Governments (SCAG) serves as the largest MPO in both the state and the nation, overseeing planning for a region that accounts for approximately 25 percent of the state’s land mass and a population of more than 19 million.
- Most counties in the SCAG region achieved scores close to the statewide average of 52.2, with the exception of Ventura County (53.1), who had a lower average daily VMT per capita than all other SCAG counties.
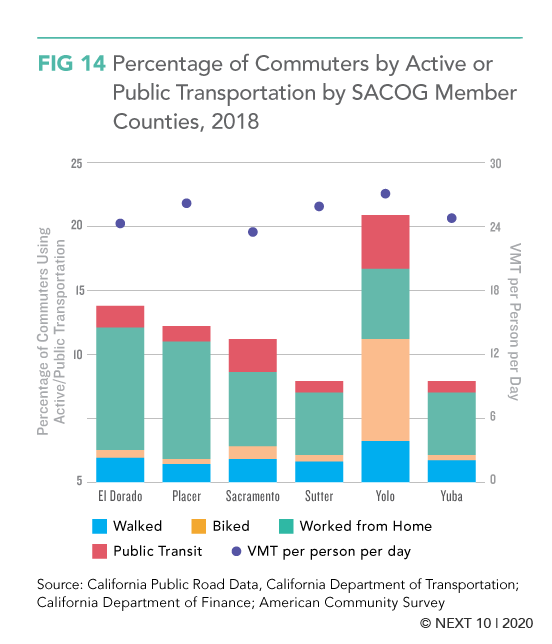
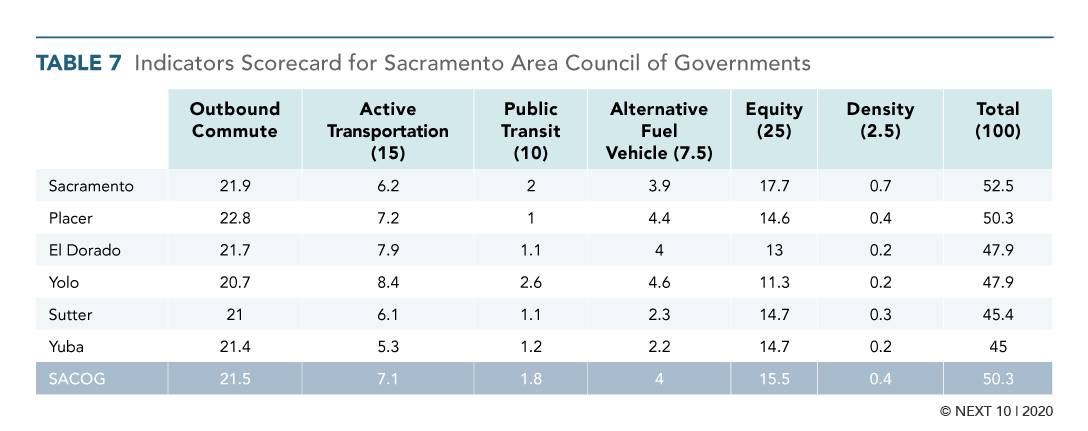
- The Sacramento region is home to leading rural counties:
- SACOG performed slightly better than SCAG overall, but similar trends persist—rural counties and counties with low household income fared worse than the region’s average, and only Sacramento County (52.4) met or exceeded the statewide average score (52.2).
- Some of the region’s more rural counties ranked highest within SACOG for both alternative fuel vehicle adoption and active transportation (El Dorado, Placer, Yolo).
Next 10 owns the copyright to all graphics in this section, and they are available for download and limited use, subject to our Terms of Use. Please contact Next 10 at info@next10.org with any questions.