Publications
Getting to Implementation: The Status of Local Climate Action in California
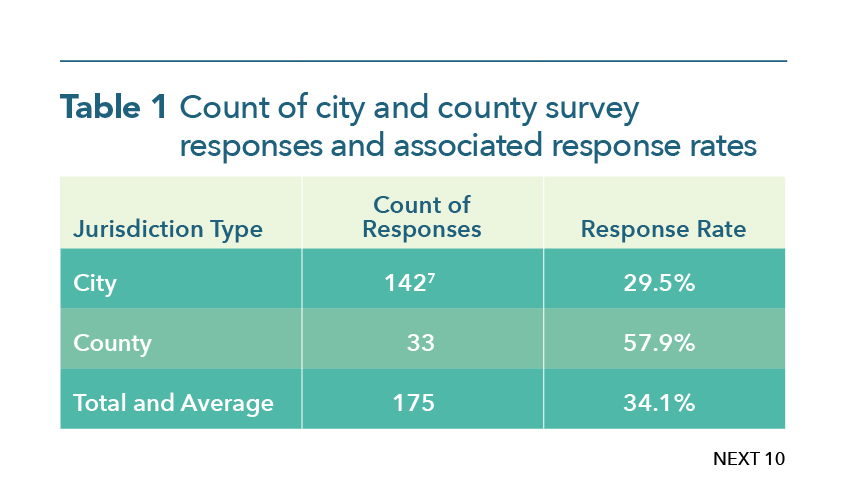
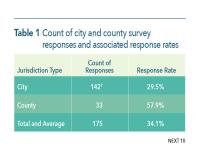
Many California cities need additional staffing and planning to capitalize on historic influx of federal climate cash. Even local governments with detailed blueprints for slashing greenhouse emissions often lack the dedicated resources needed to realize ambitious climate pledges. That’s according to our recent report — Getting to Implementation: The Status of Local Climate Action in California — surveyed municipalities across the state to gauge the progress of local efforts to reduce greenhouse gas emissions and protect residents against the worst impacts of climate change, from flooding and drought to wildfires and extreme heat. About a third of cities and counties responded to the survey, representing more than half of the state’s population.
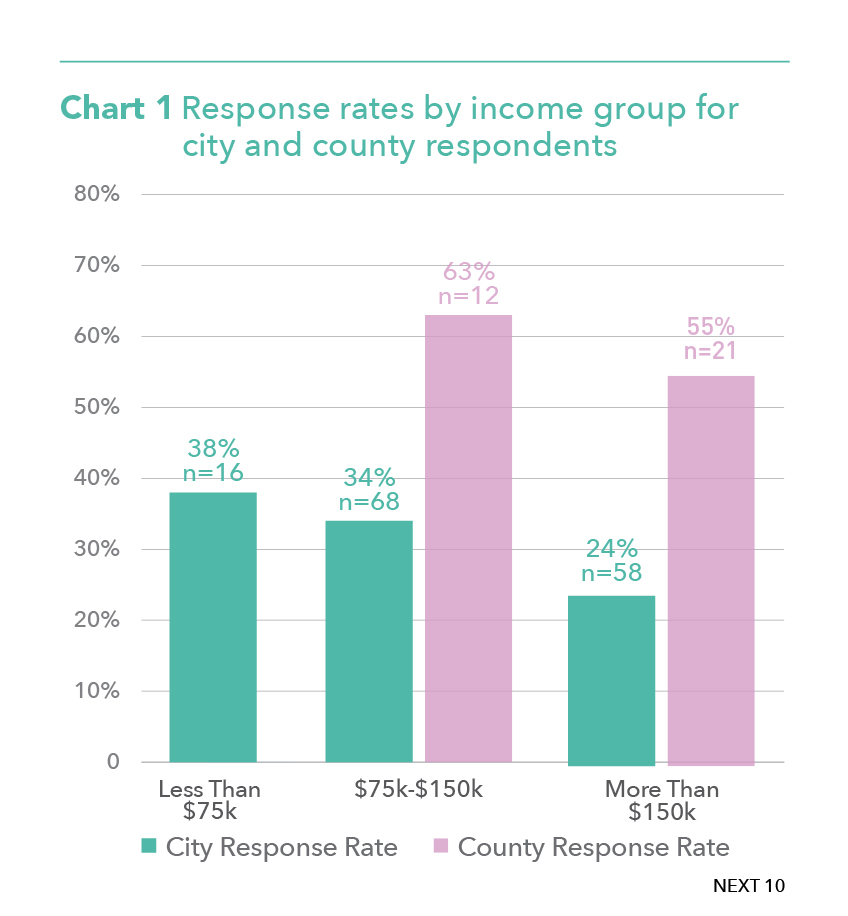
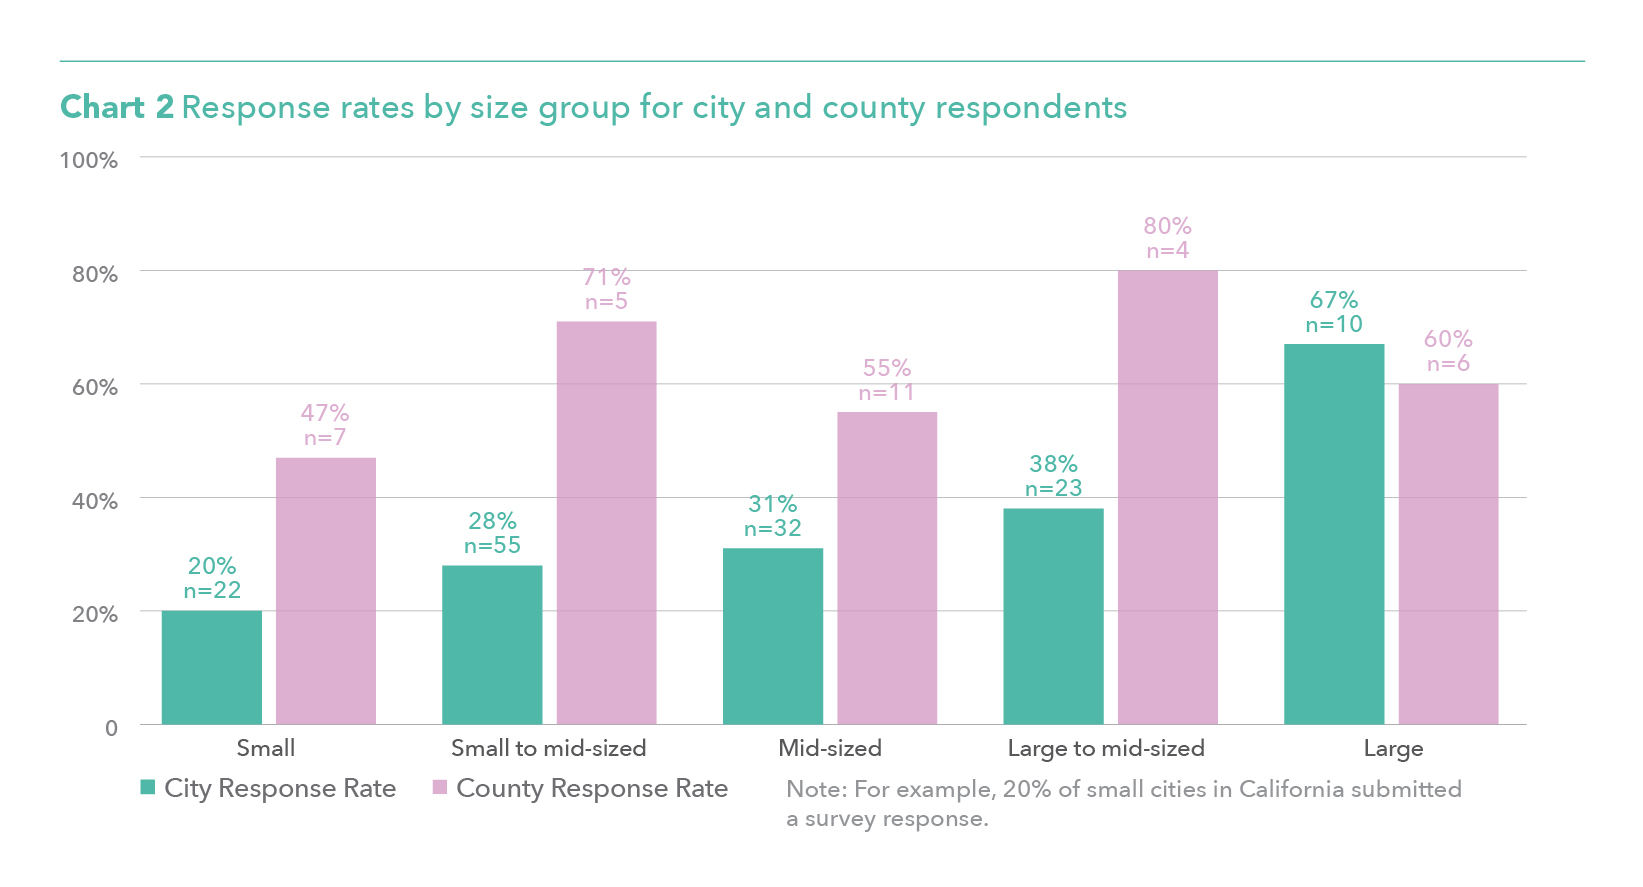
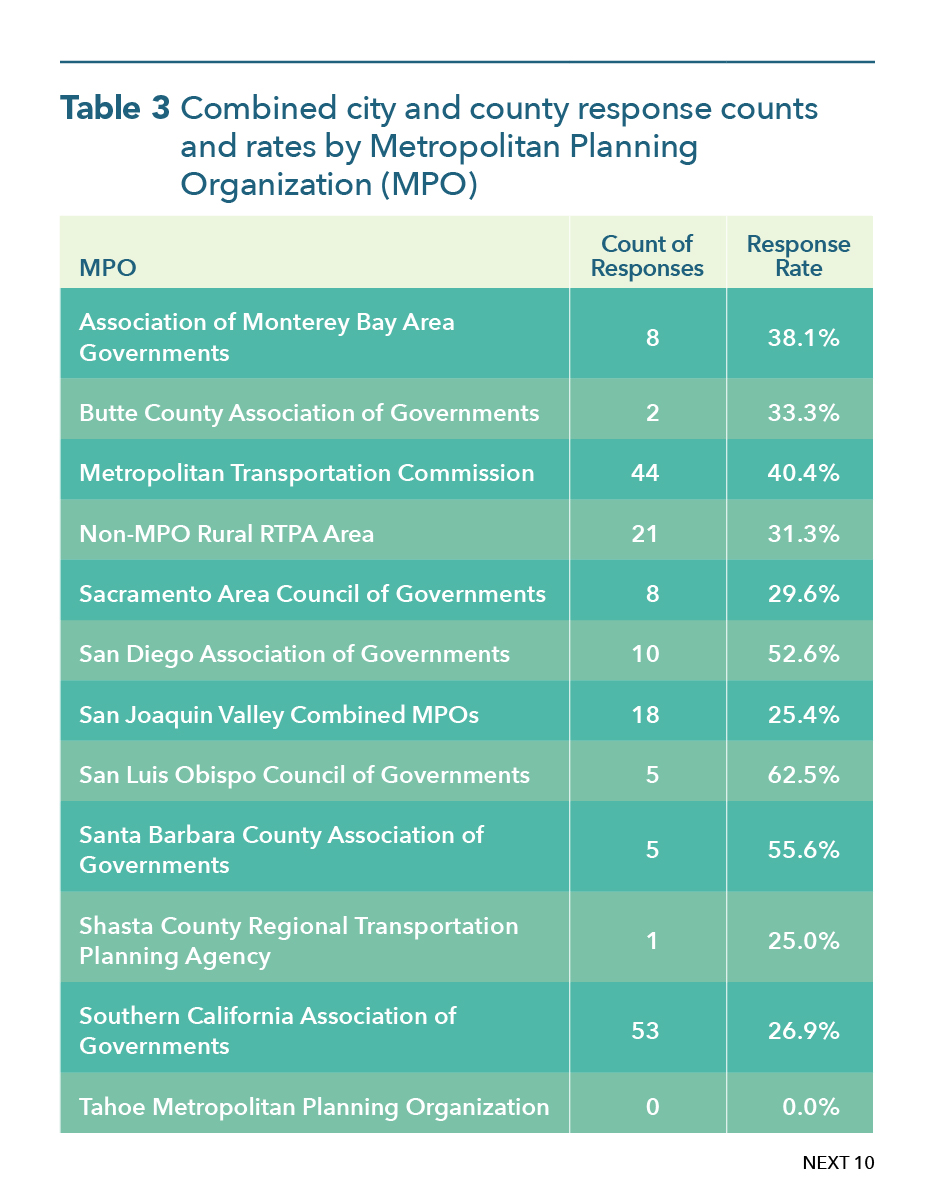
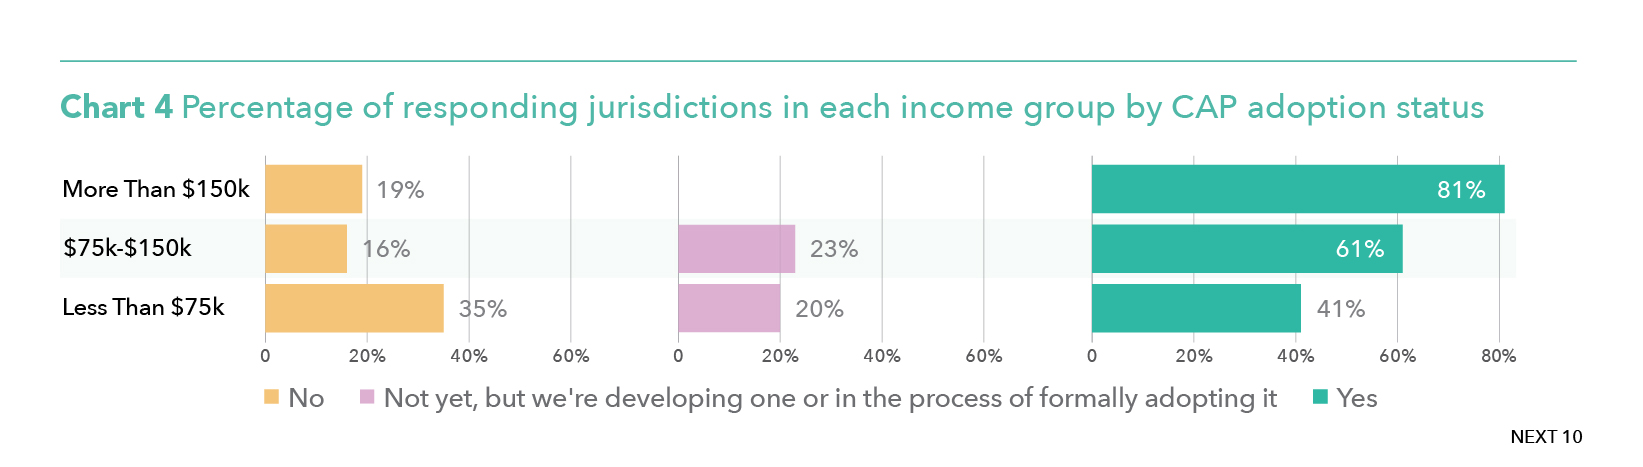
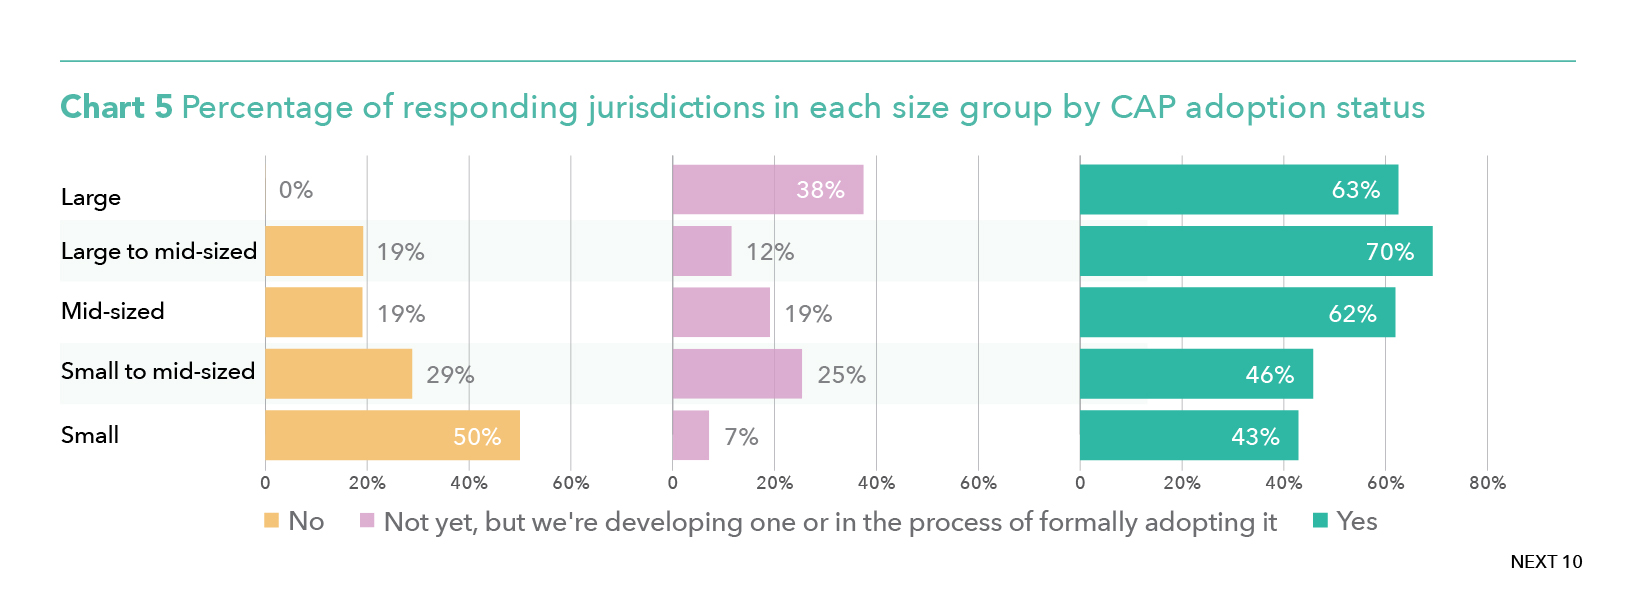
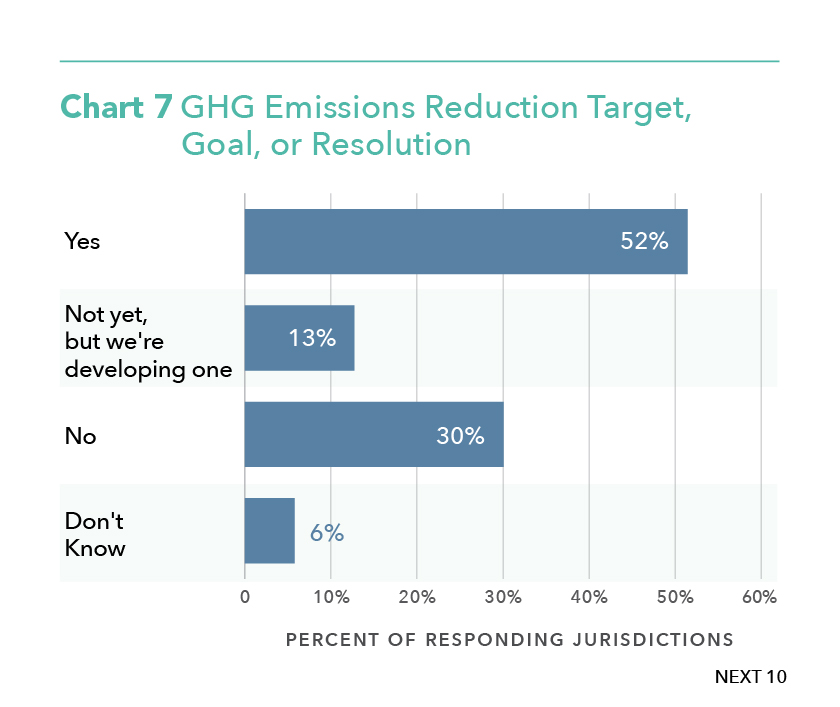
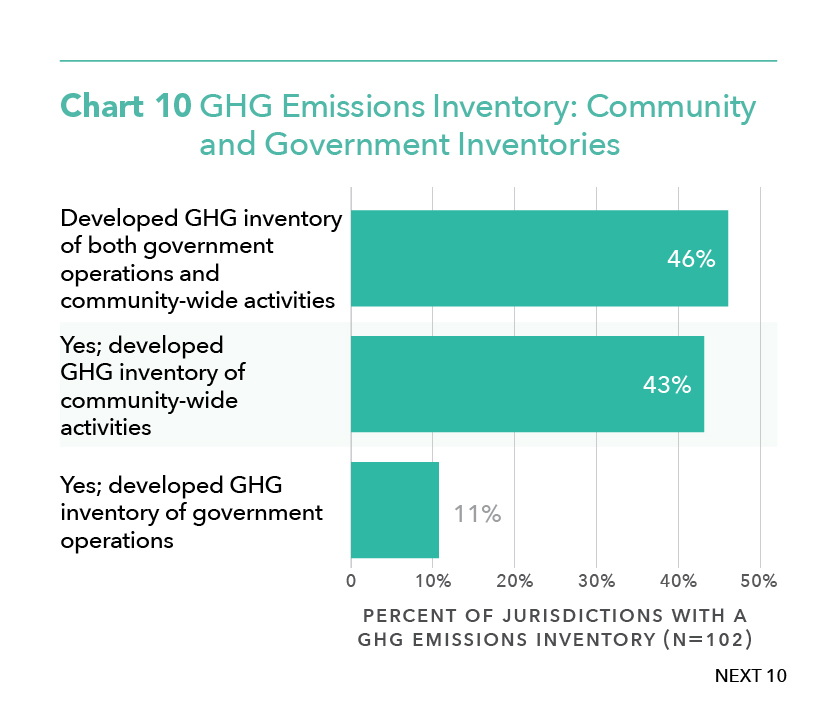
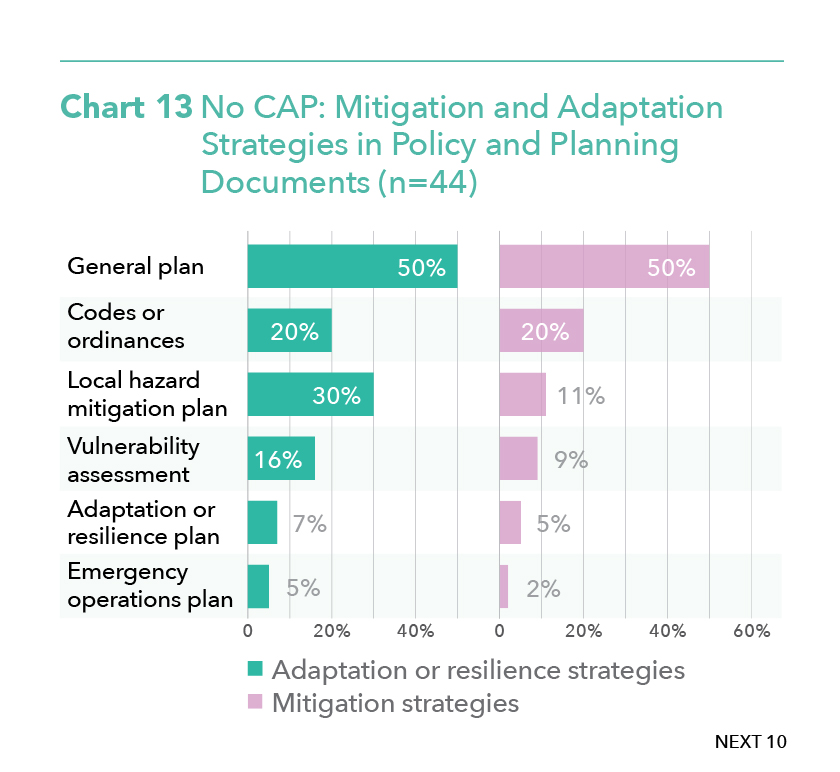
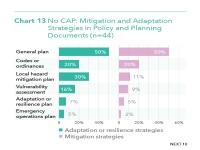
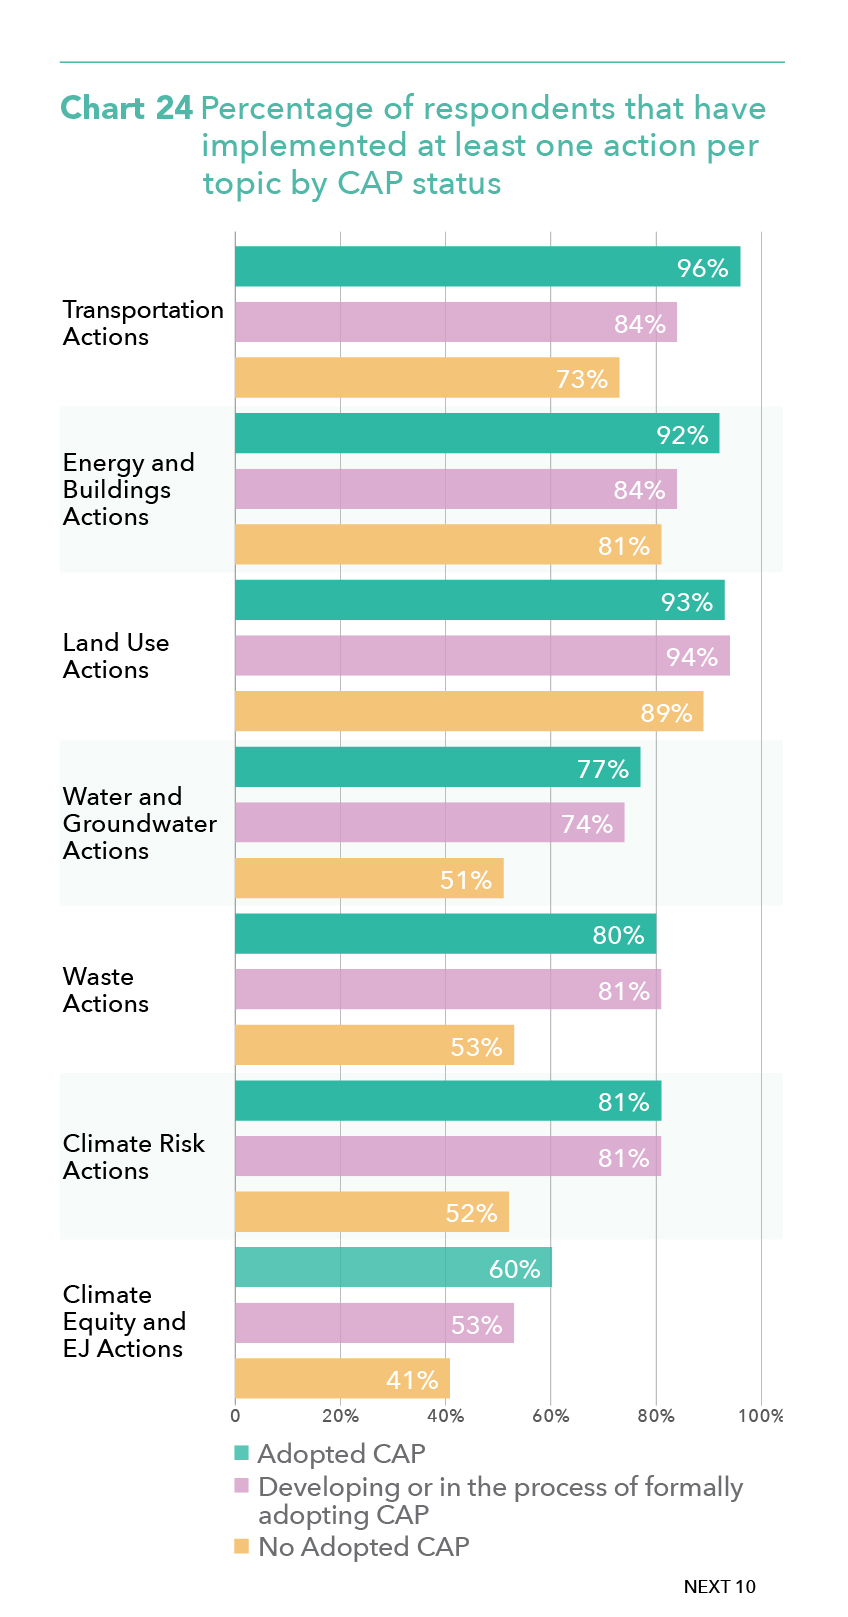
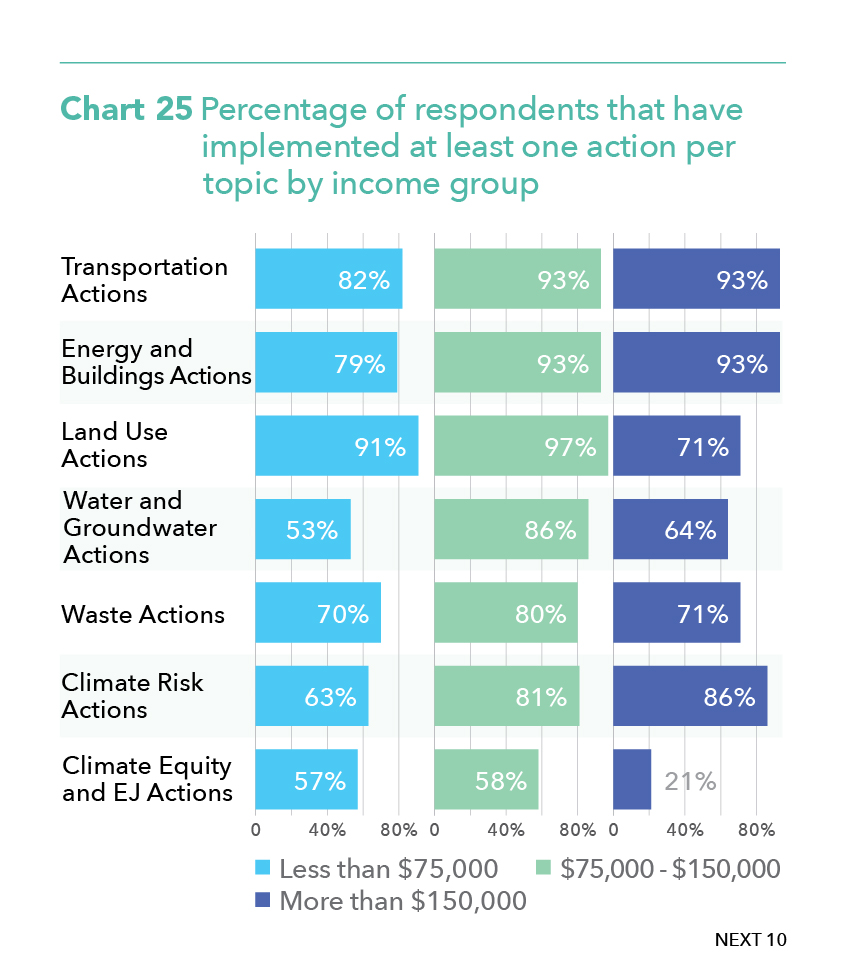
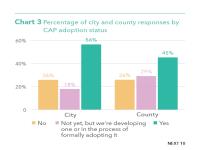
Of the responding jurisdictions, only about half of had adopted an official climate action plan, and these are areas that tend to be larger and wealthier. Smaller, more conservative jurisdictions with lower median household incomes were less likely to have such a document. However, some jurisdictions include climate planning in other documents, such as in their General Plan or Hazard Mitigation Plan.
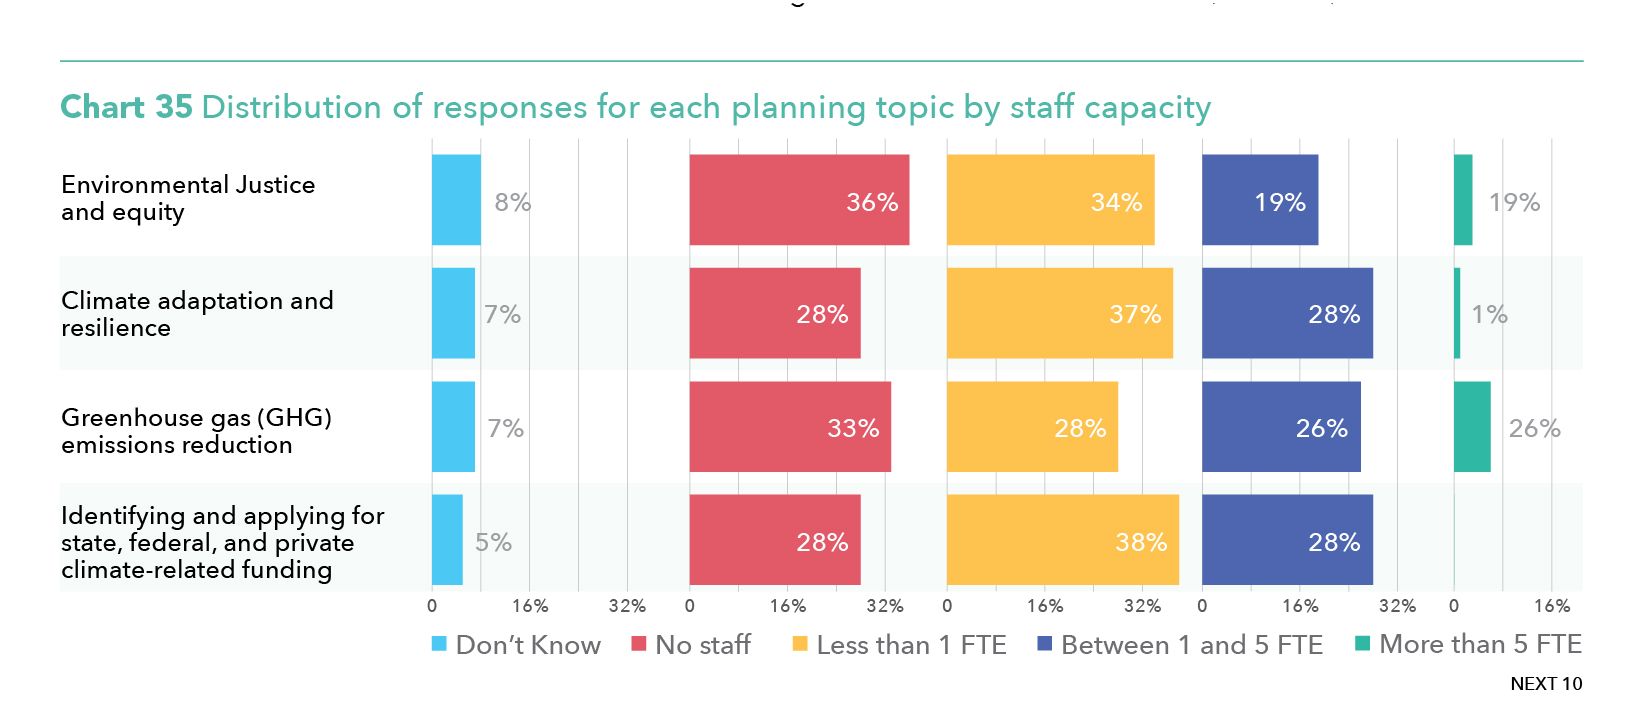
Jurisdictions repeatedly identified a lack of financial resources and adequate staffing as both the biggest barriers and the most important resources for implementing climate policy. Though local governments will automatically qualify for some of the new state and federal funding, large pots of money are allocated through competitive grants. Researchers said that cities and counties with robust staffing and detailed blueprints for addressing the climate emergency will have a significant advantage when applying for these crucial resources. Additionally, only 6% of responding jurisdictions reported having more than five employees working on climate issues, and most local governments maintain less than one full-time position. A third of respondents said they had no staff at all working on reducing greenhouse gas emissions and other actions with climate impacts. However, smaller, and more conservative jurisdictions are more likely to implement policies that support climate goals while achieving other co-benefits for residents, even if they do not have a Climate Action Plan and/or dedicated staff.
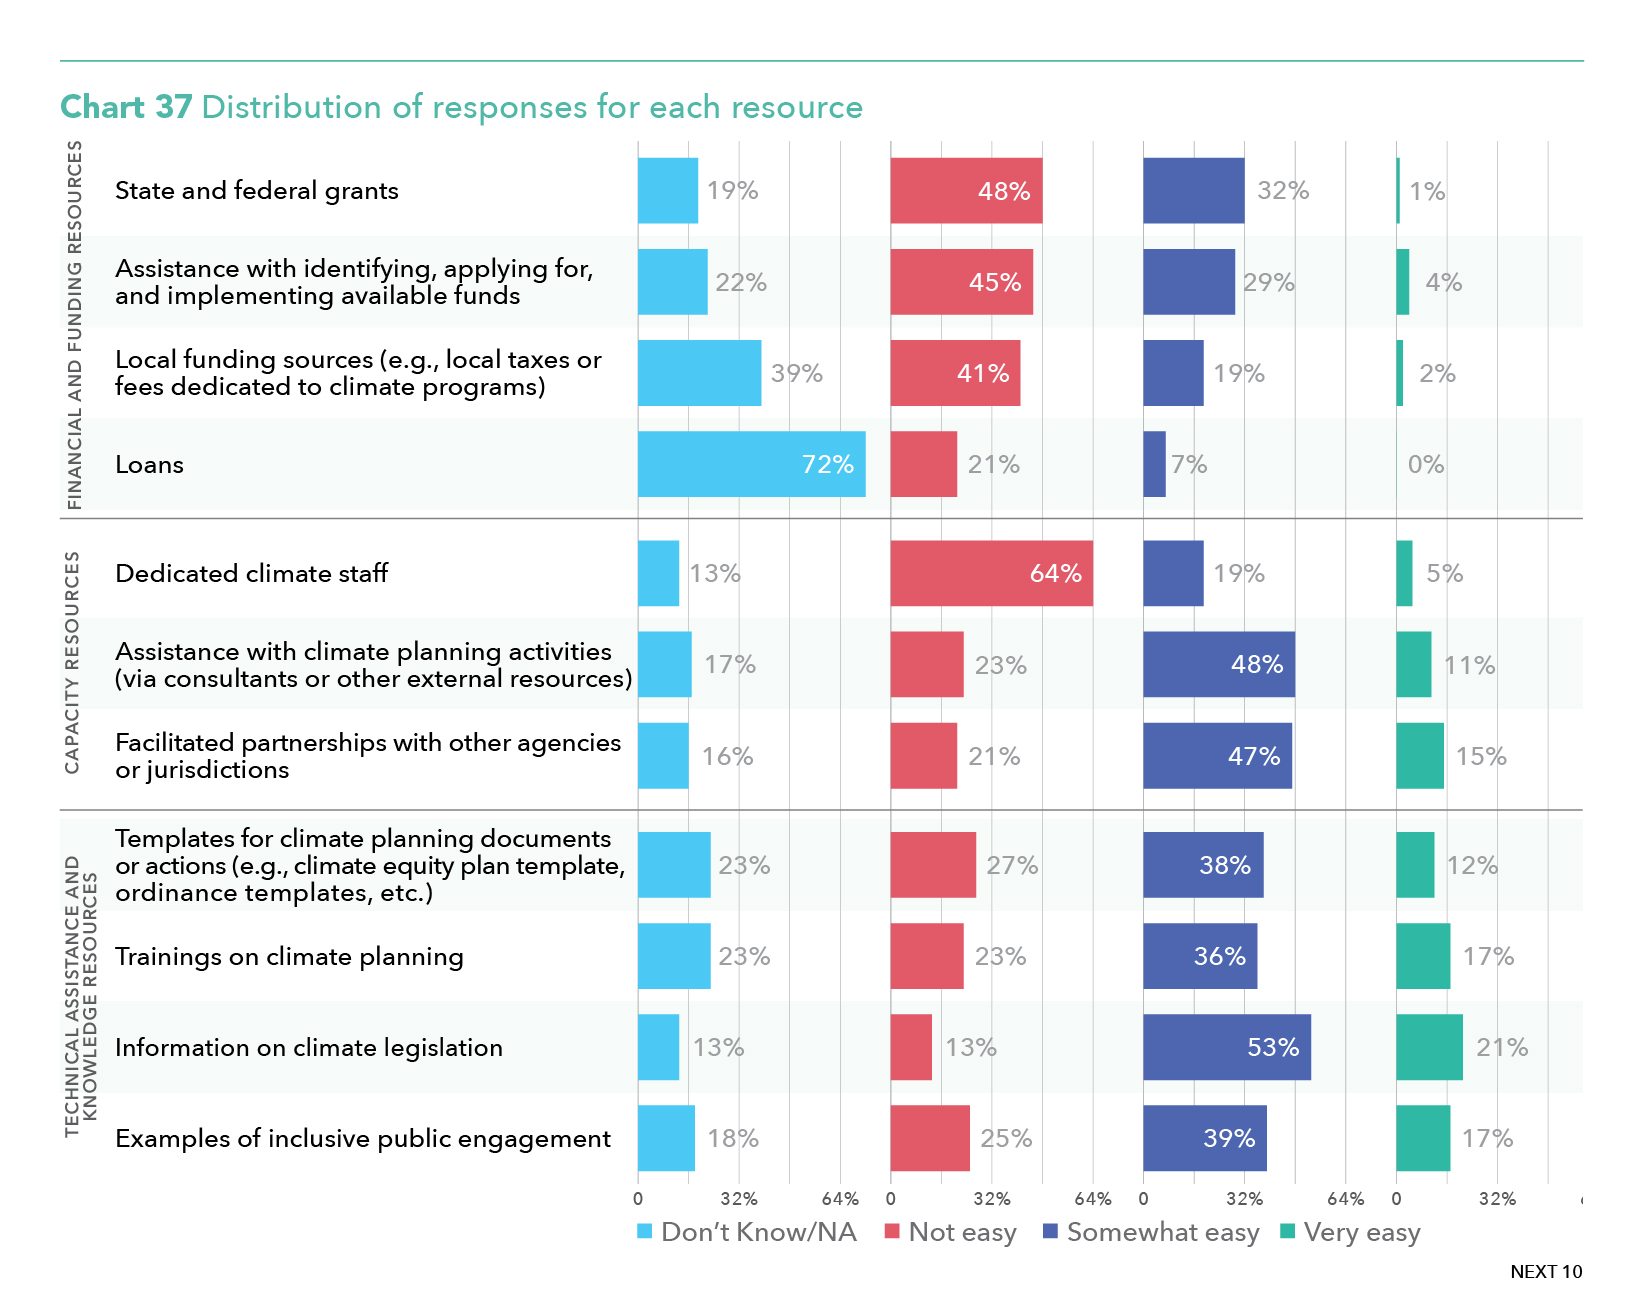
Local officials were well aware of the challenges facing their cities and counties, according to the survey. The large influx of state and federal funding could help many jurisdictions jumpstart their climate programs, but only if they can first secure the new resources. Nearly half of respondents said accessing state or federal grants was “not easy.”
California is at a critical point in its efforts to decarbonize the economy. In 2022, Governor Newsom signed AB 1279, enshrining the state’s carbon neutrality target into law. Meeting this goal will require planning and coordination across all levels of government. This report provides valuable insights into the needs of cities and counties of all sizes, helping policy makers better understand where support is needed in order to achieve California’s ambitious goals.
Next 10, CLEE and ILG will host webinar on Tuesday, November 28th at 11am PT, in which the authors will discuss the key findings from the report and implications for policy. To sign up for the webinar, please click here.
Next 10 is not the sole owner of rights to this publication. Usage of this content is subject to permissions, please contact us at info@next10.org for more information.
Featured Graphics
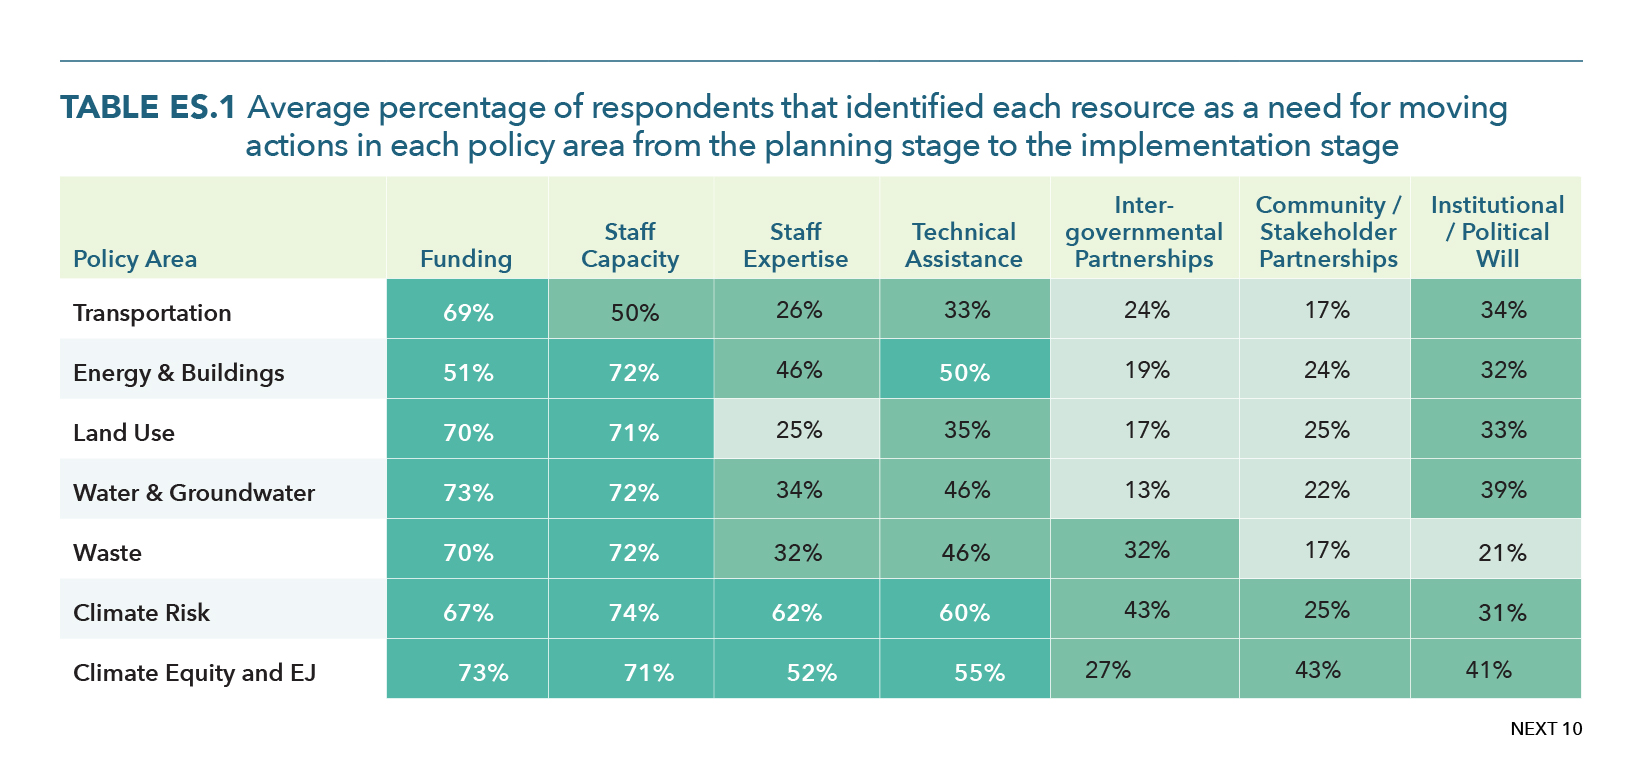

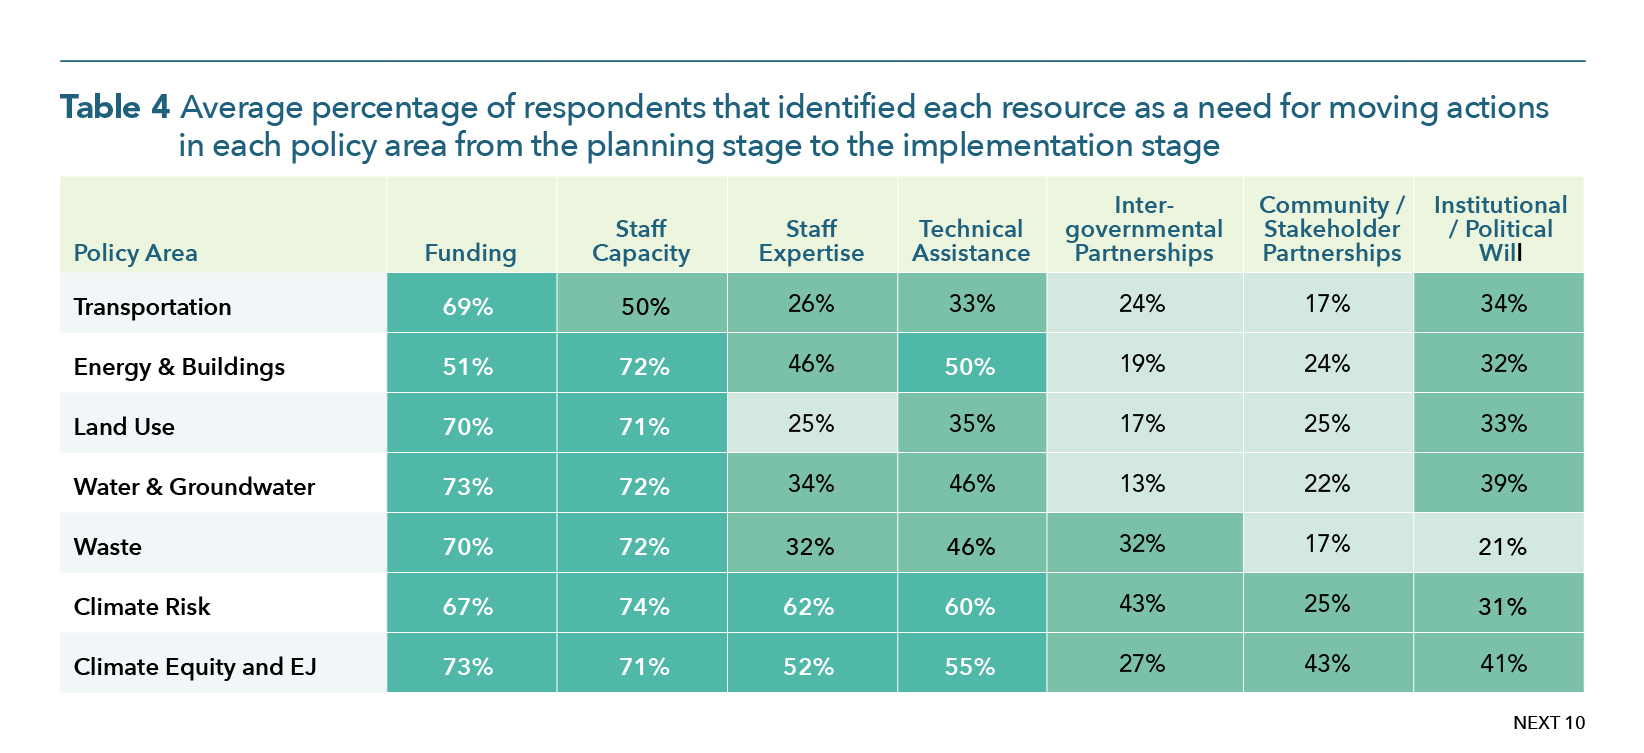
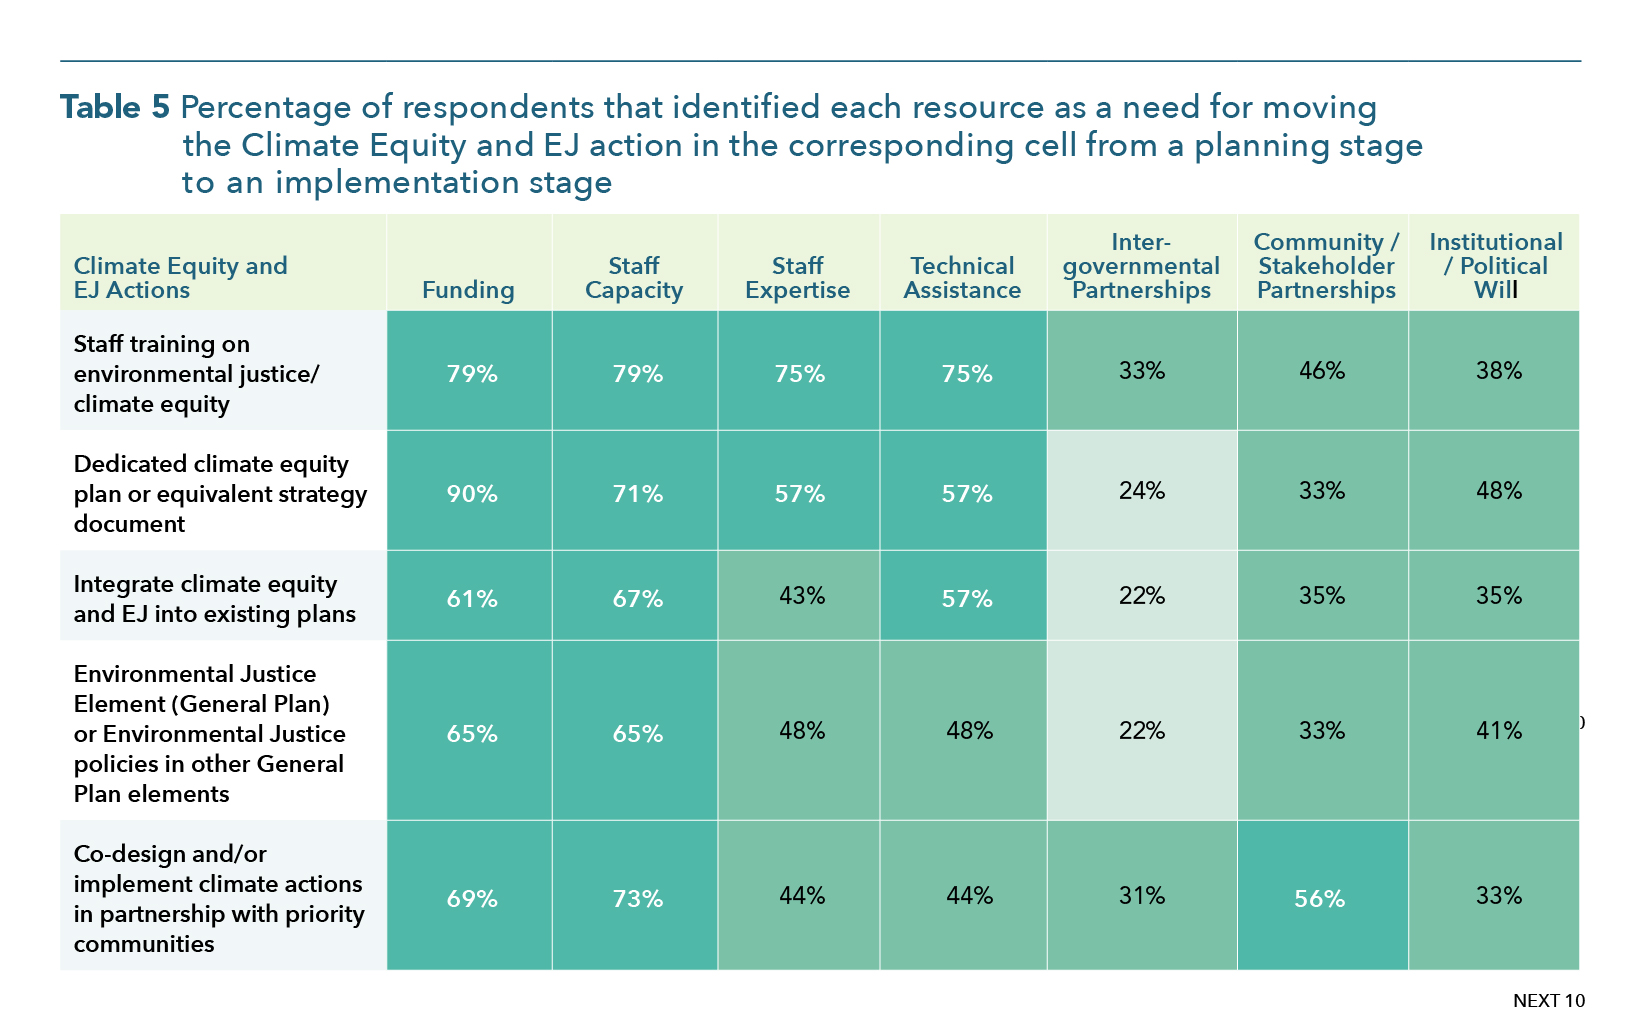
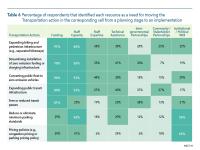
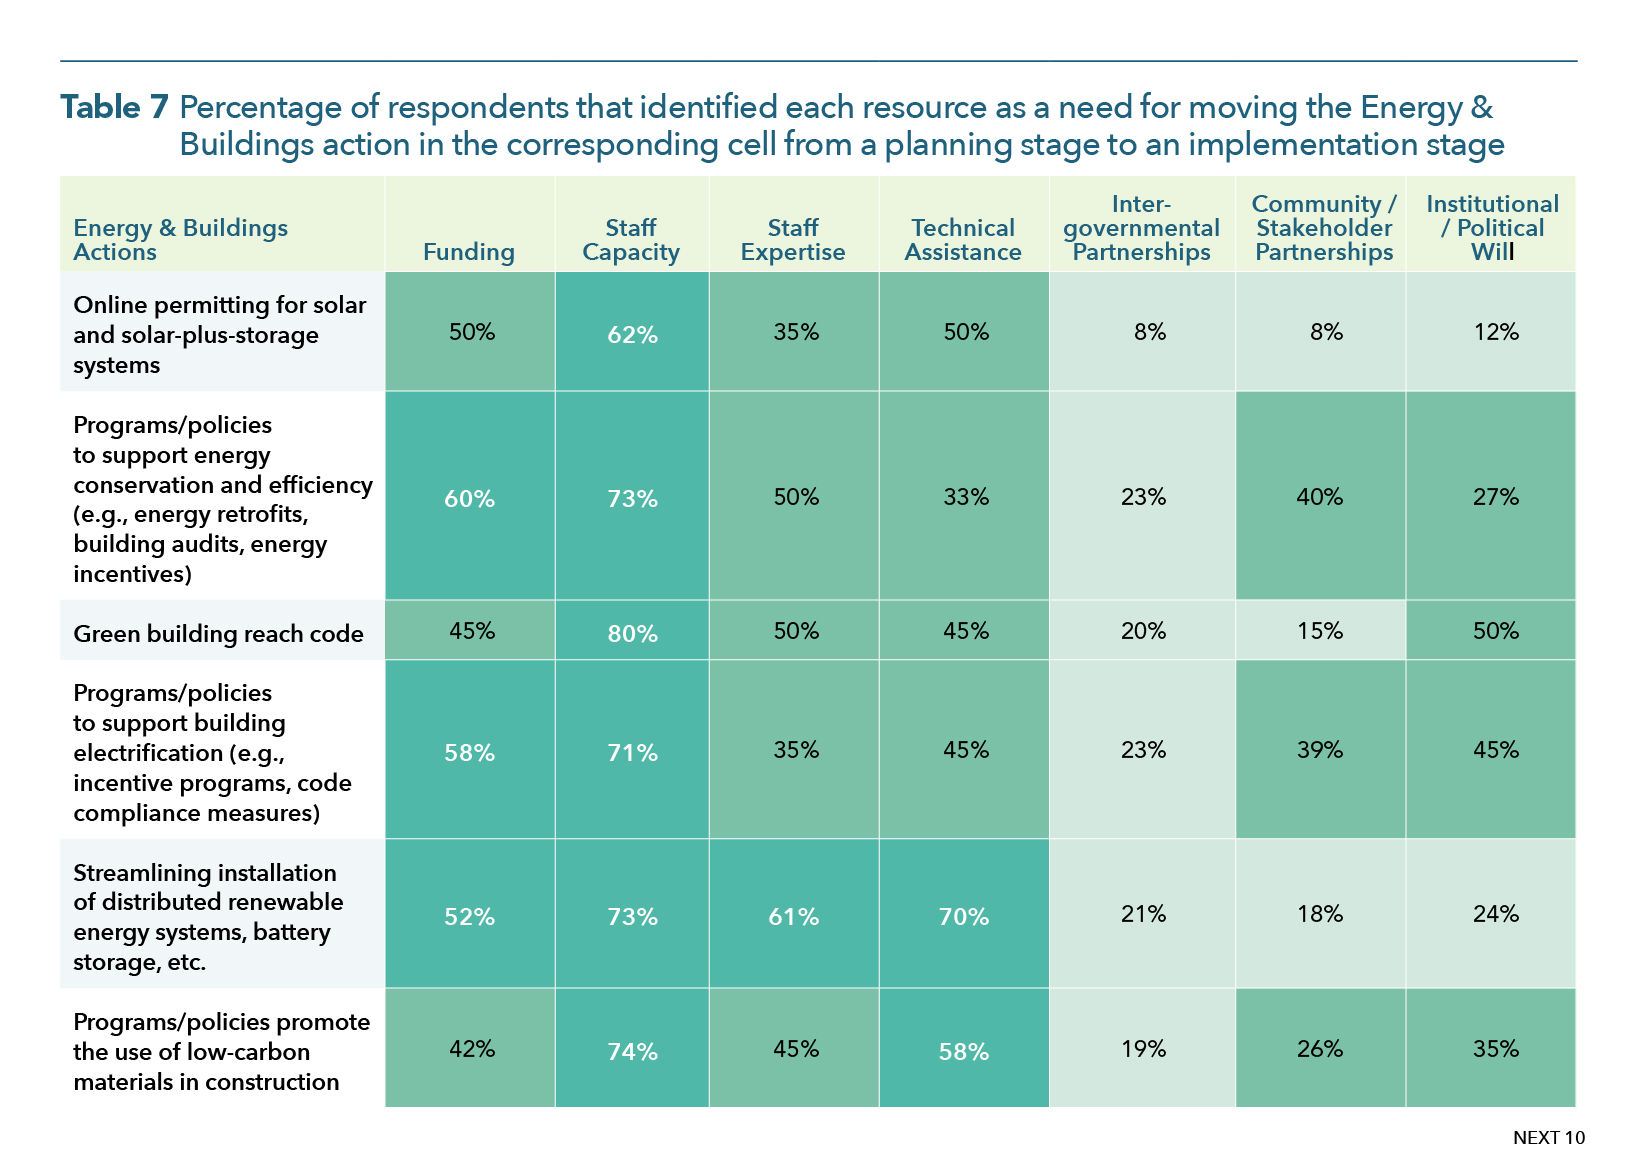
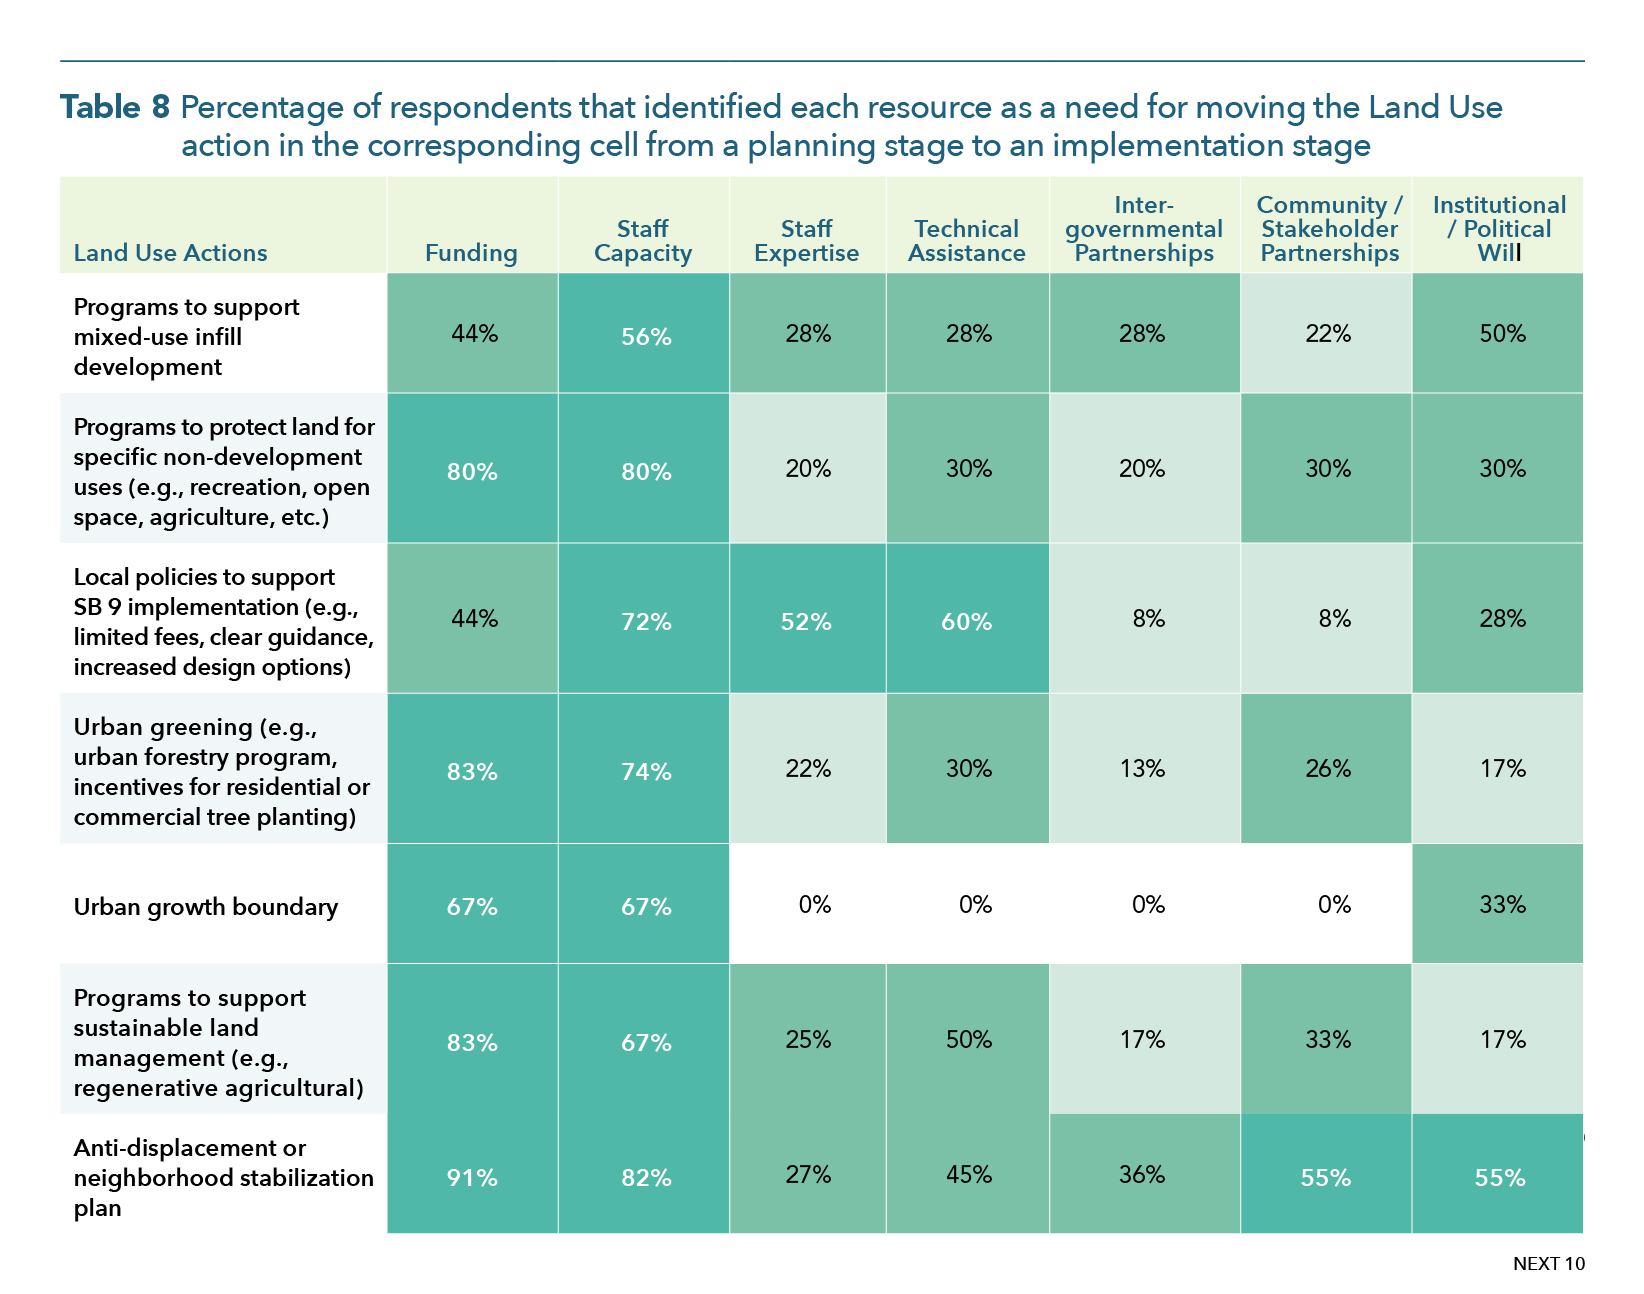
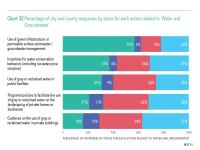
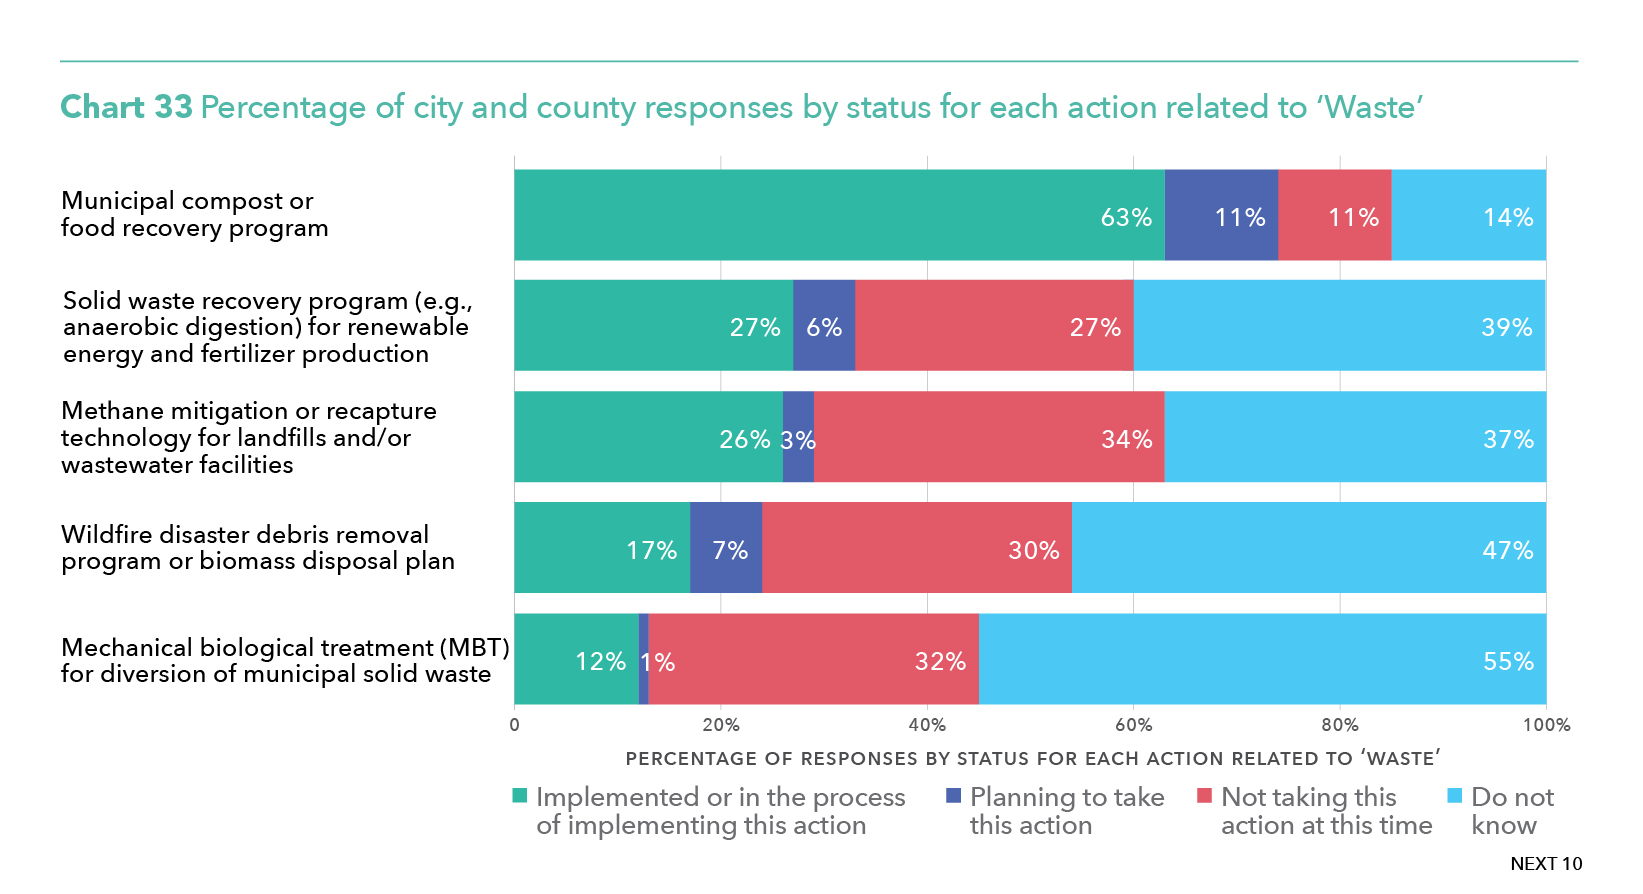
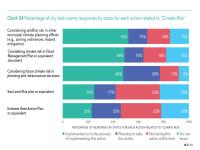
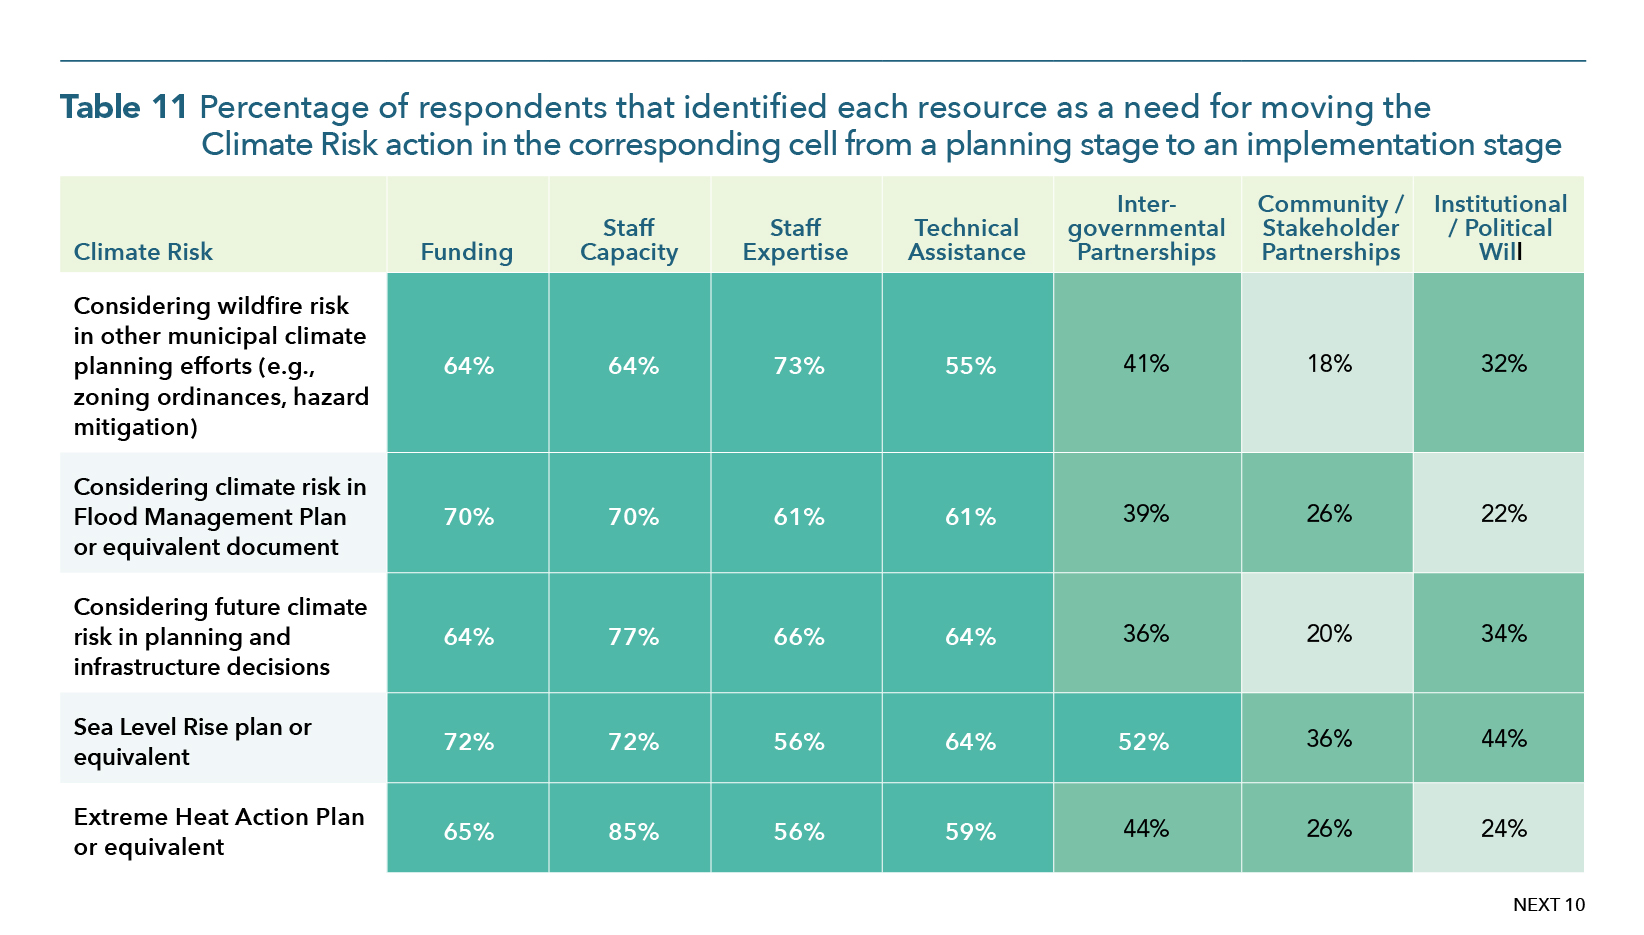
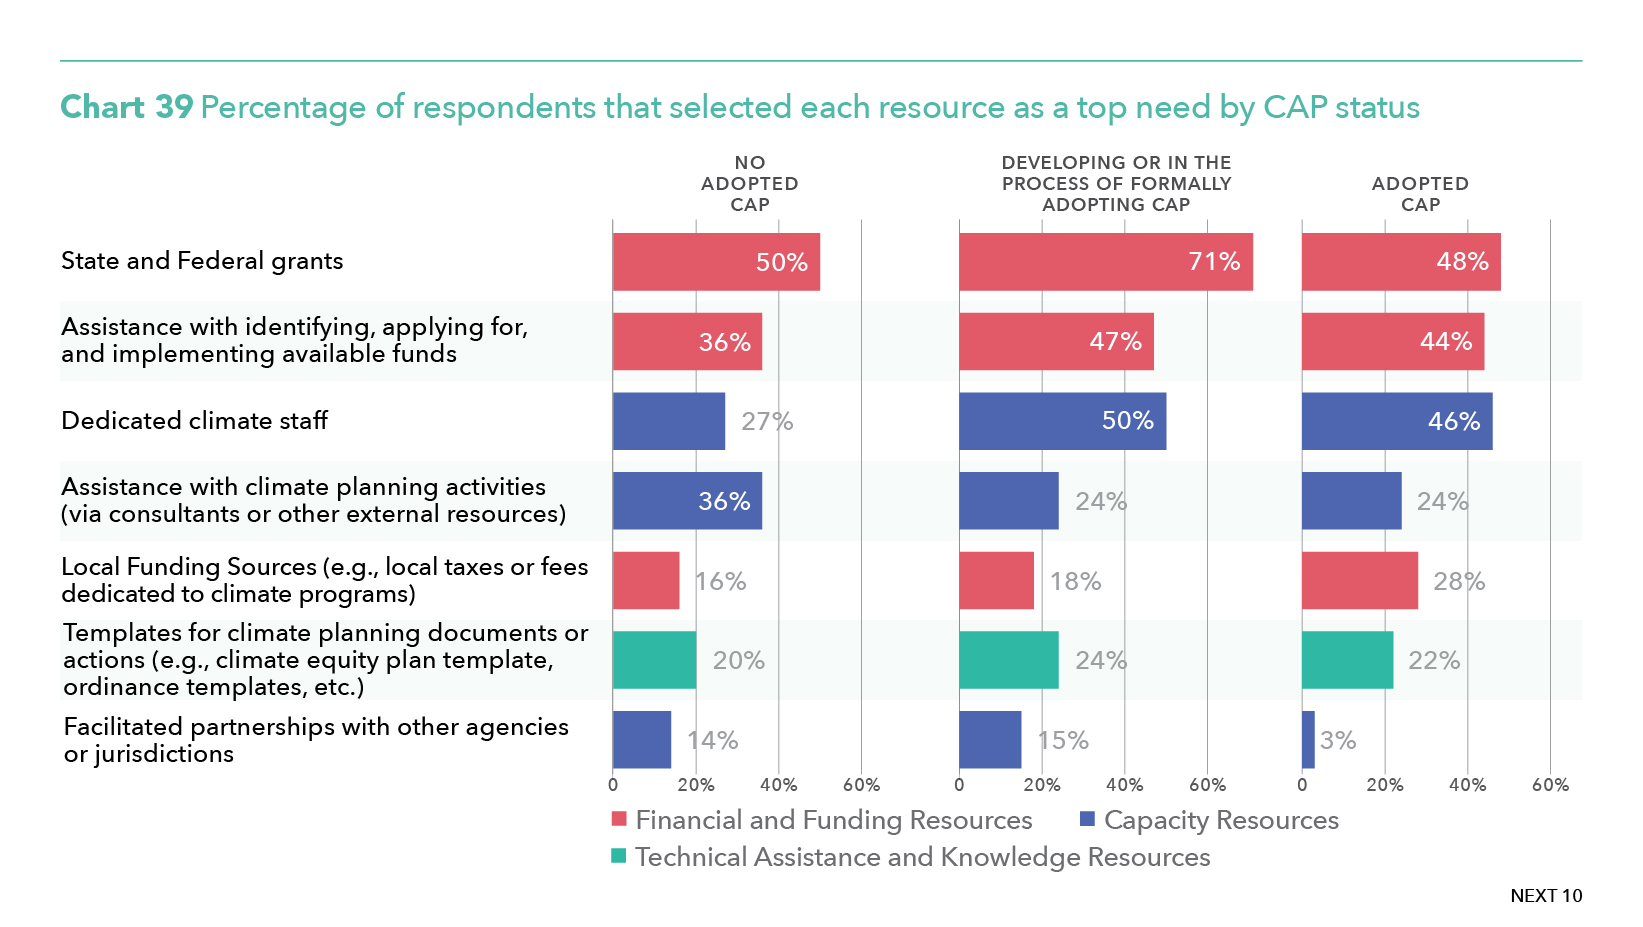
- Staffing capacity and funding were consistently ranked by municipalities among the highest needs for implementation of climate policies, from launching composting programs to promoting dense walkable neighborhoods served by transit. These resources were ranked far above other factors, such as political will and community partnerships.
- The majority of responding jurisdictions had fewer than one full-time staff member dedicated to climate planning. Only about a quarter of respondents had between one and five people working on such issues.
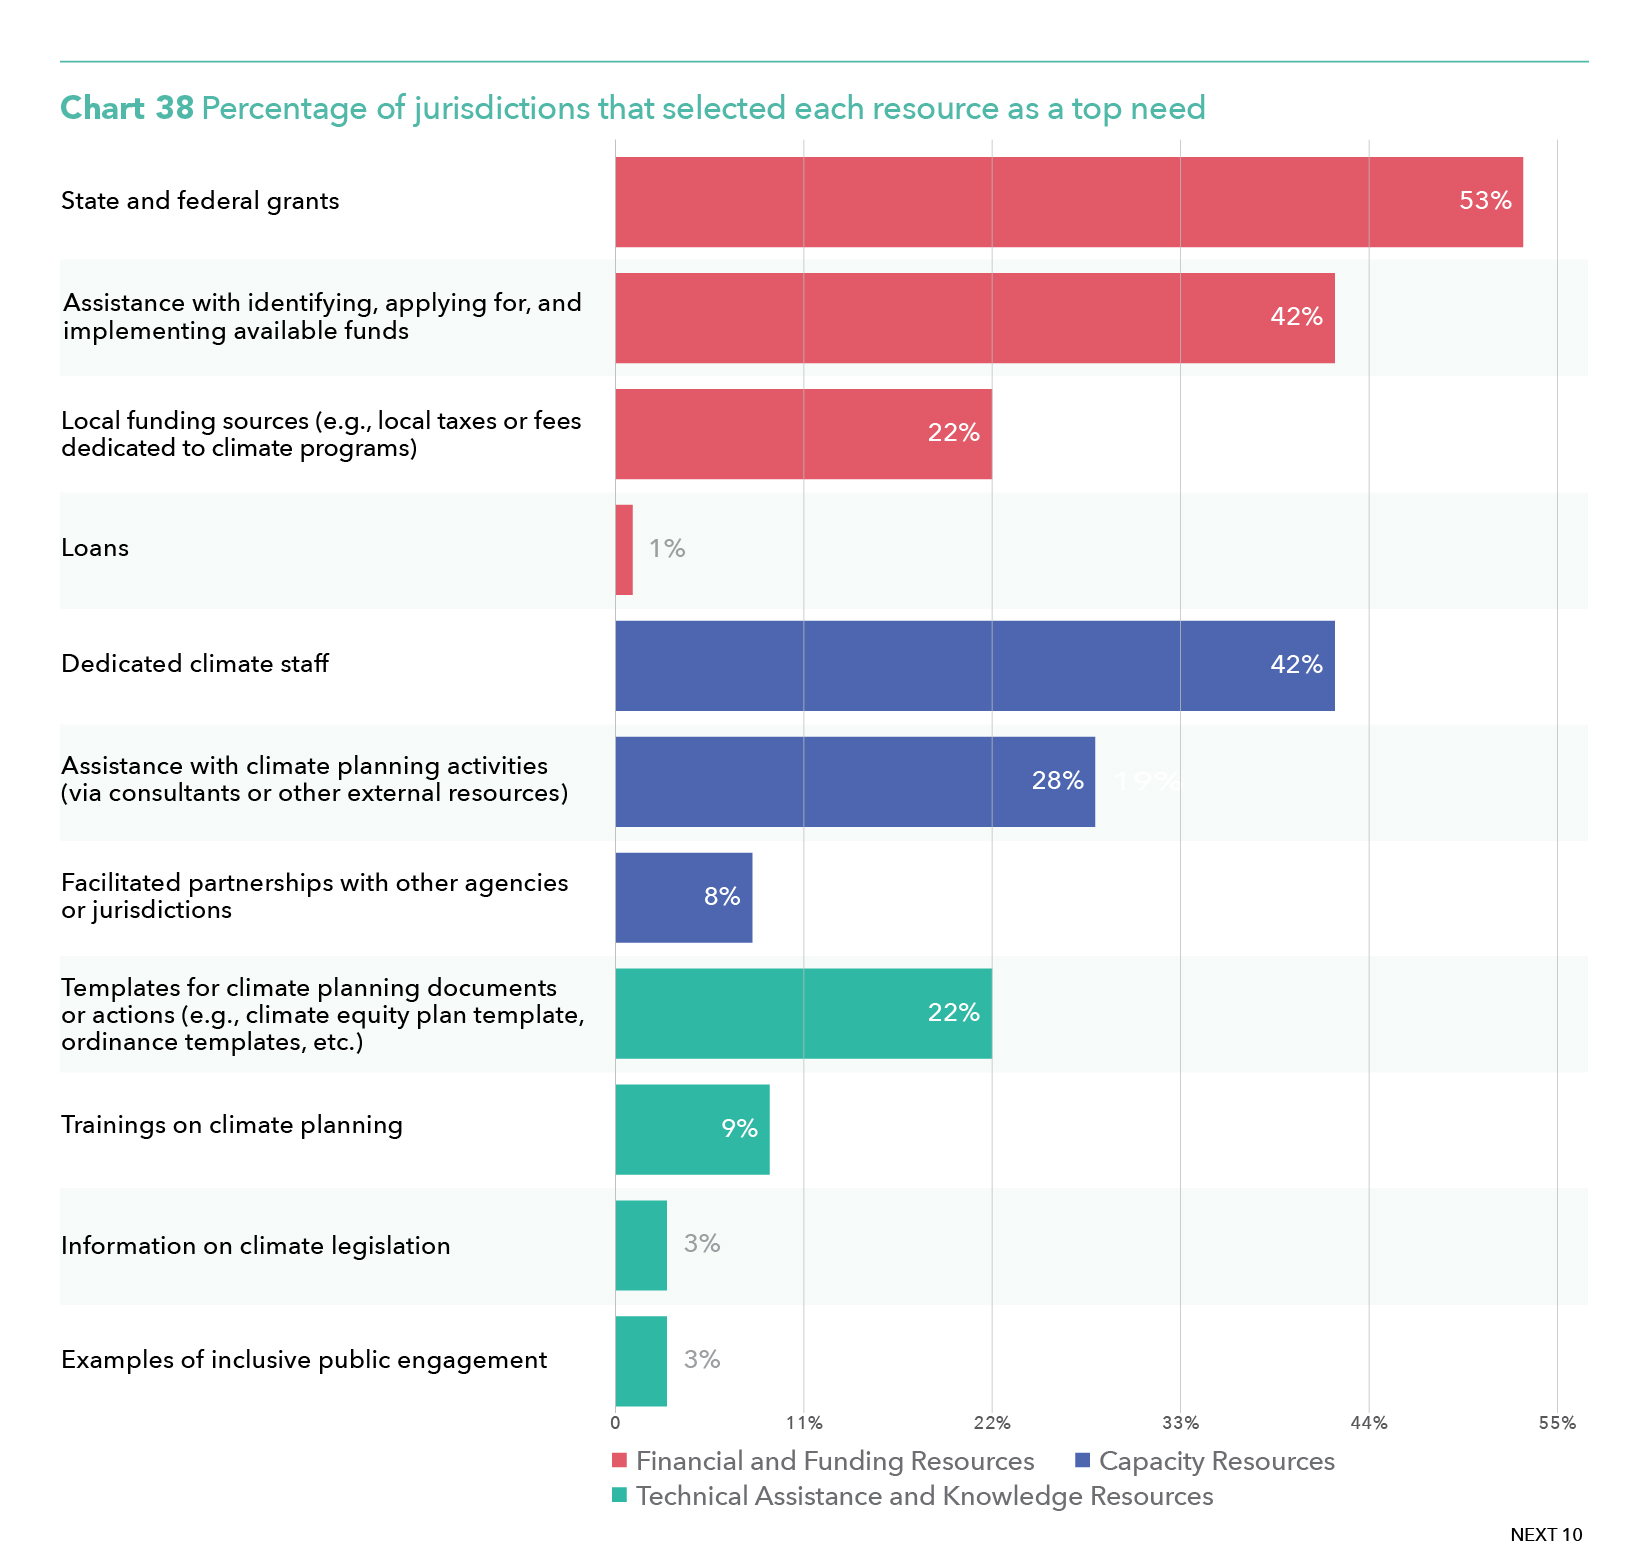
- About 53% of respondents said state and federal grants were a top need, and only 42% said they needed assistance identifying and applying for available funding.
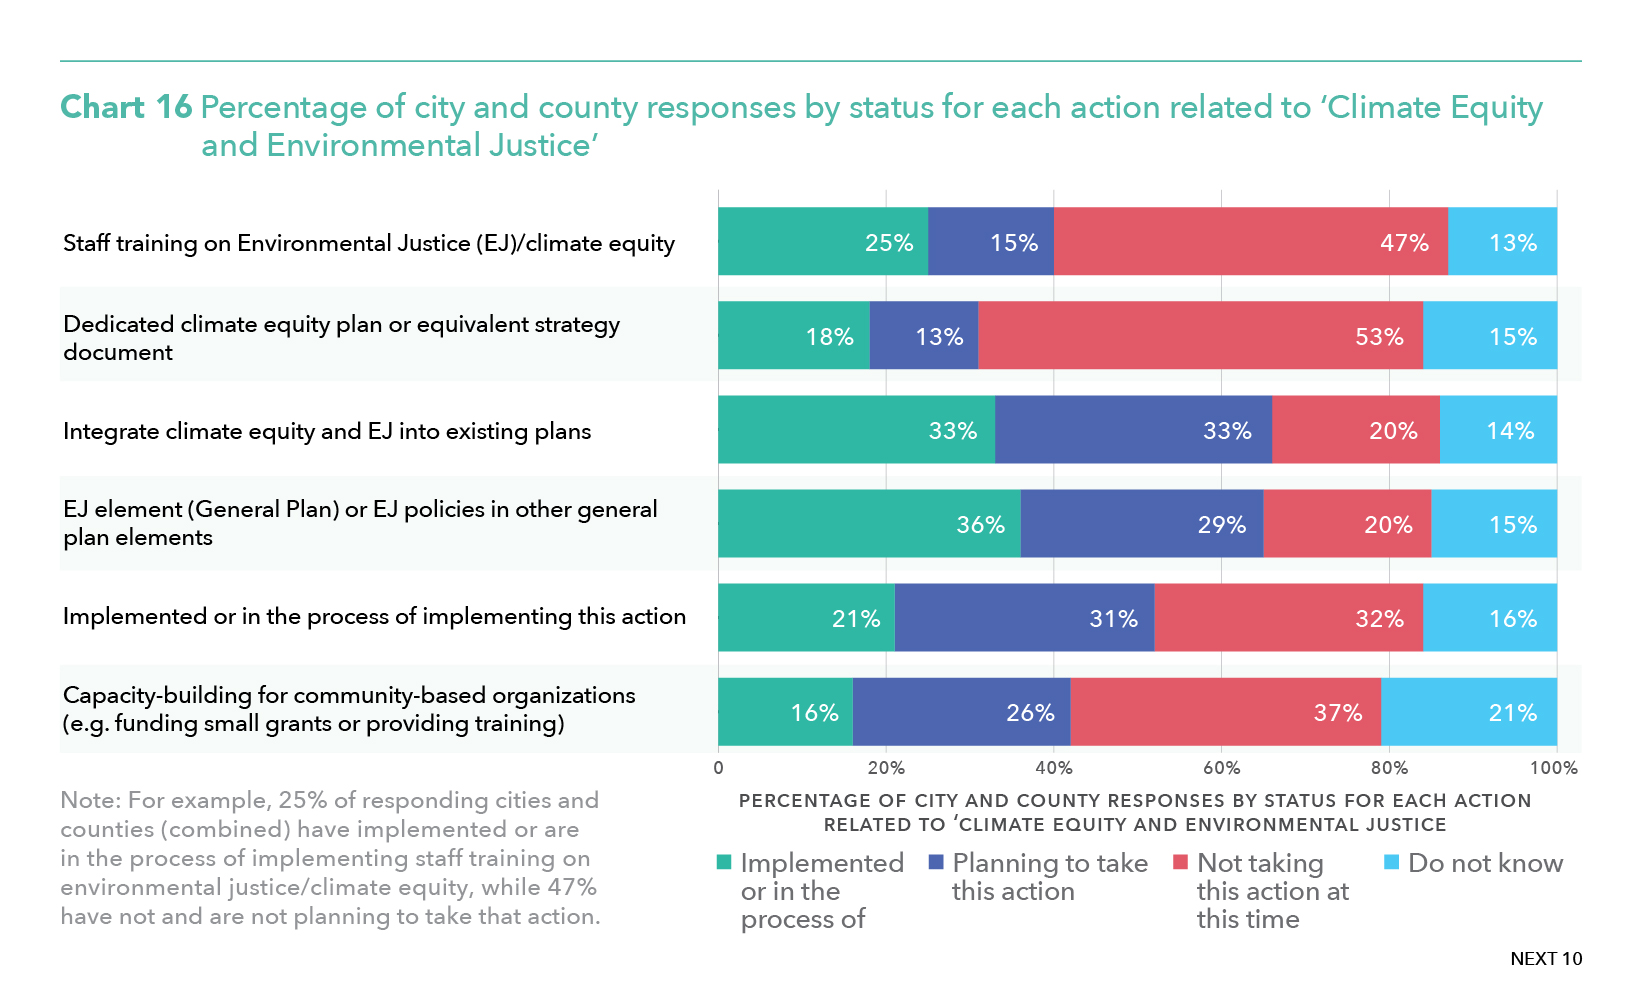
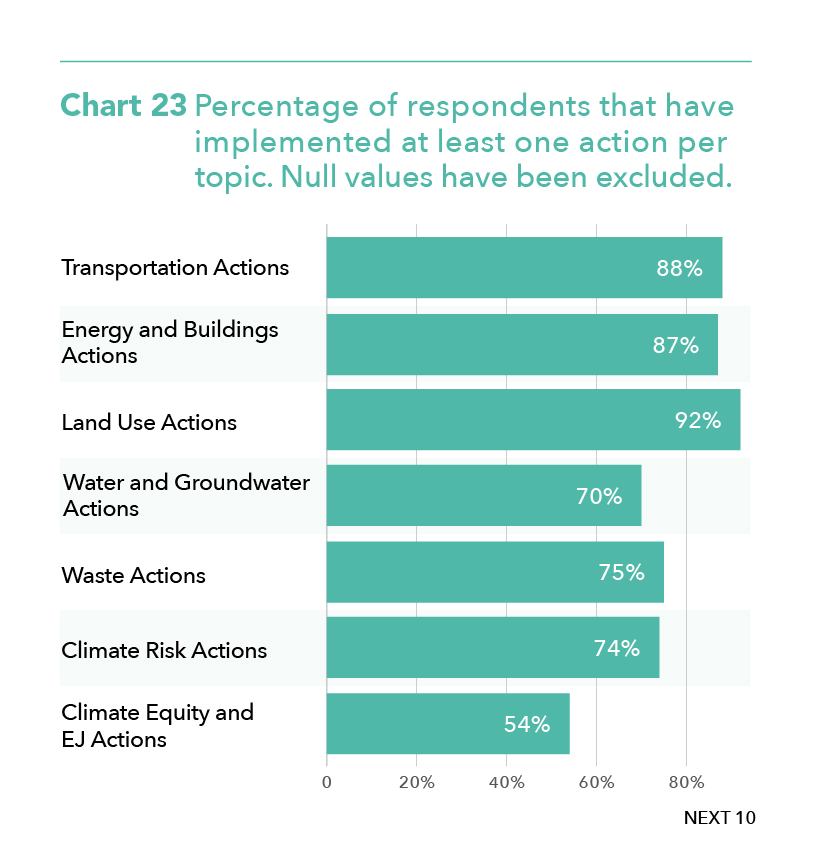
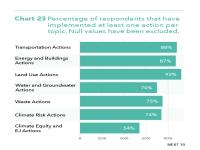
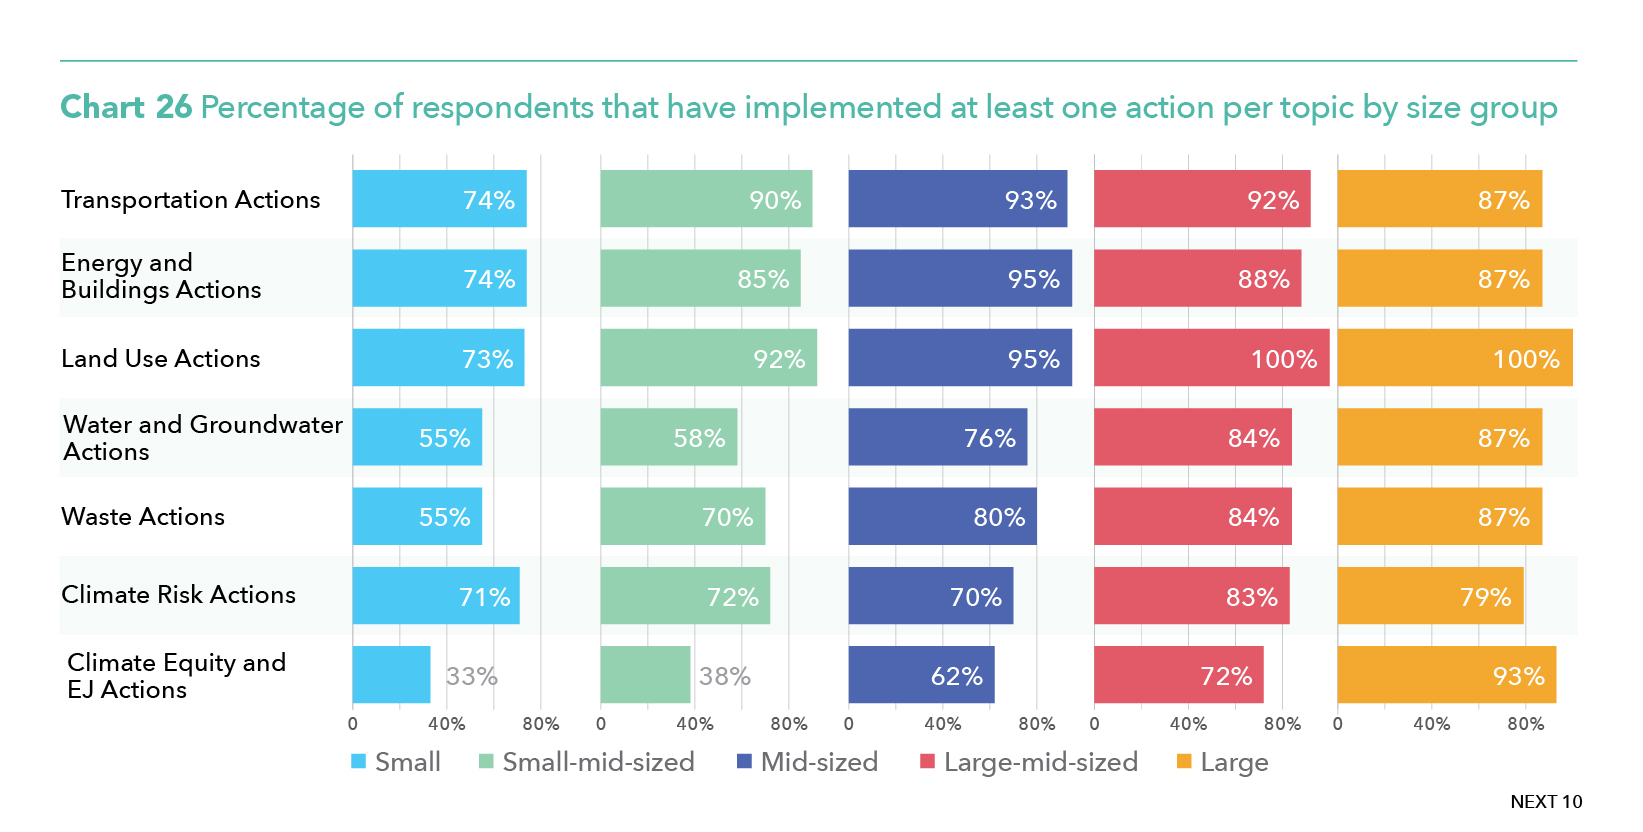
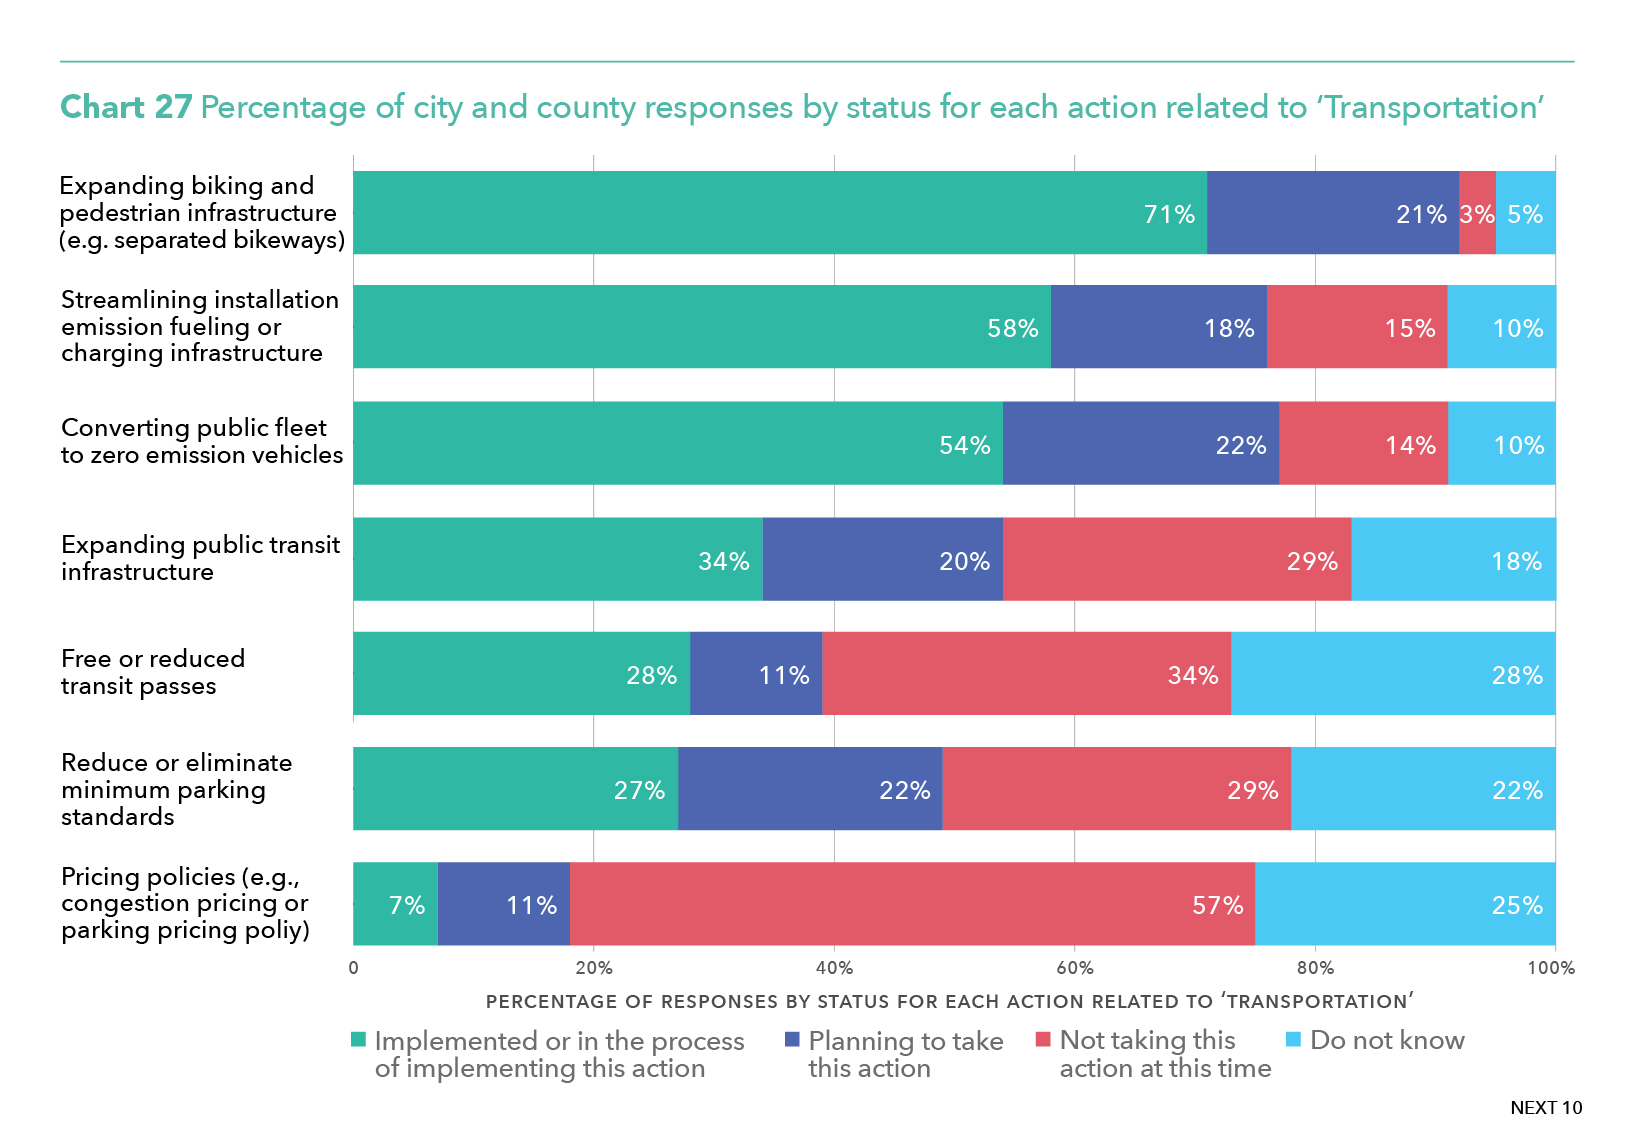
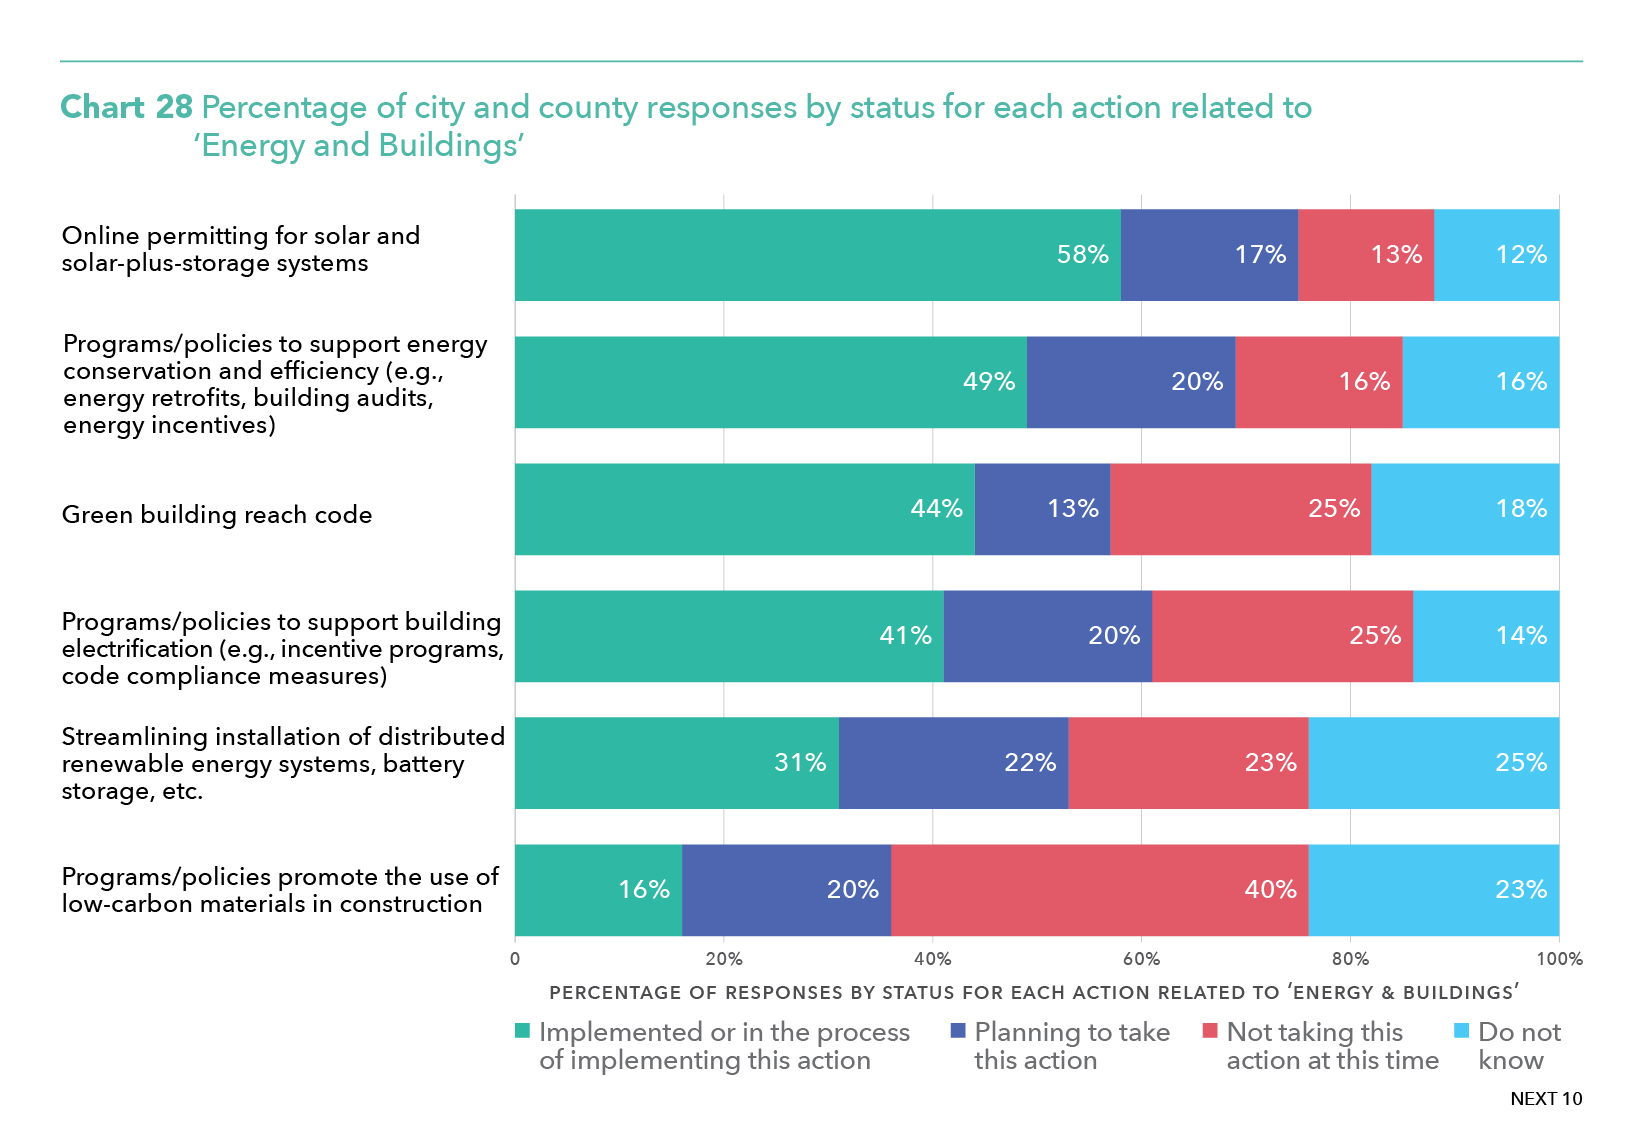
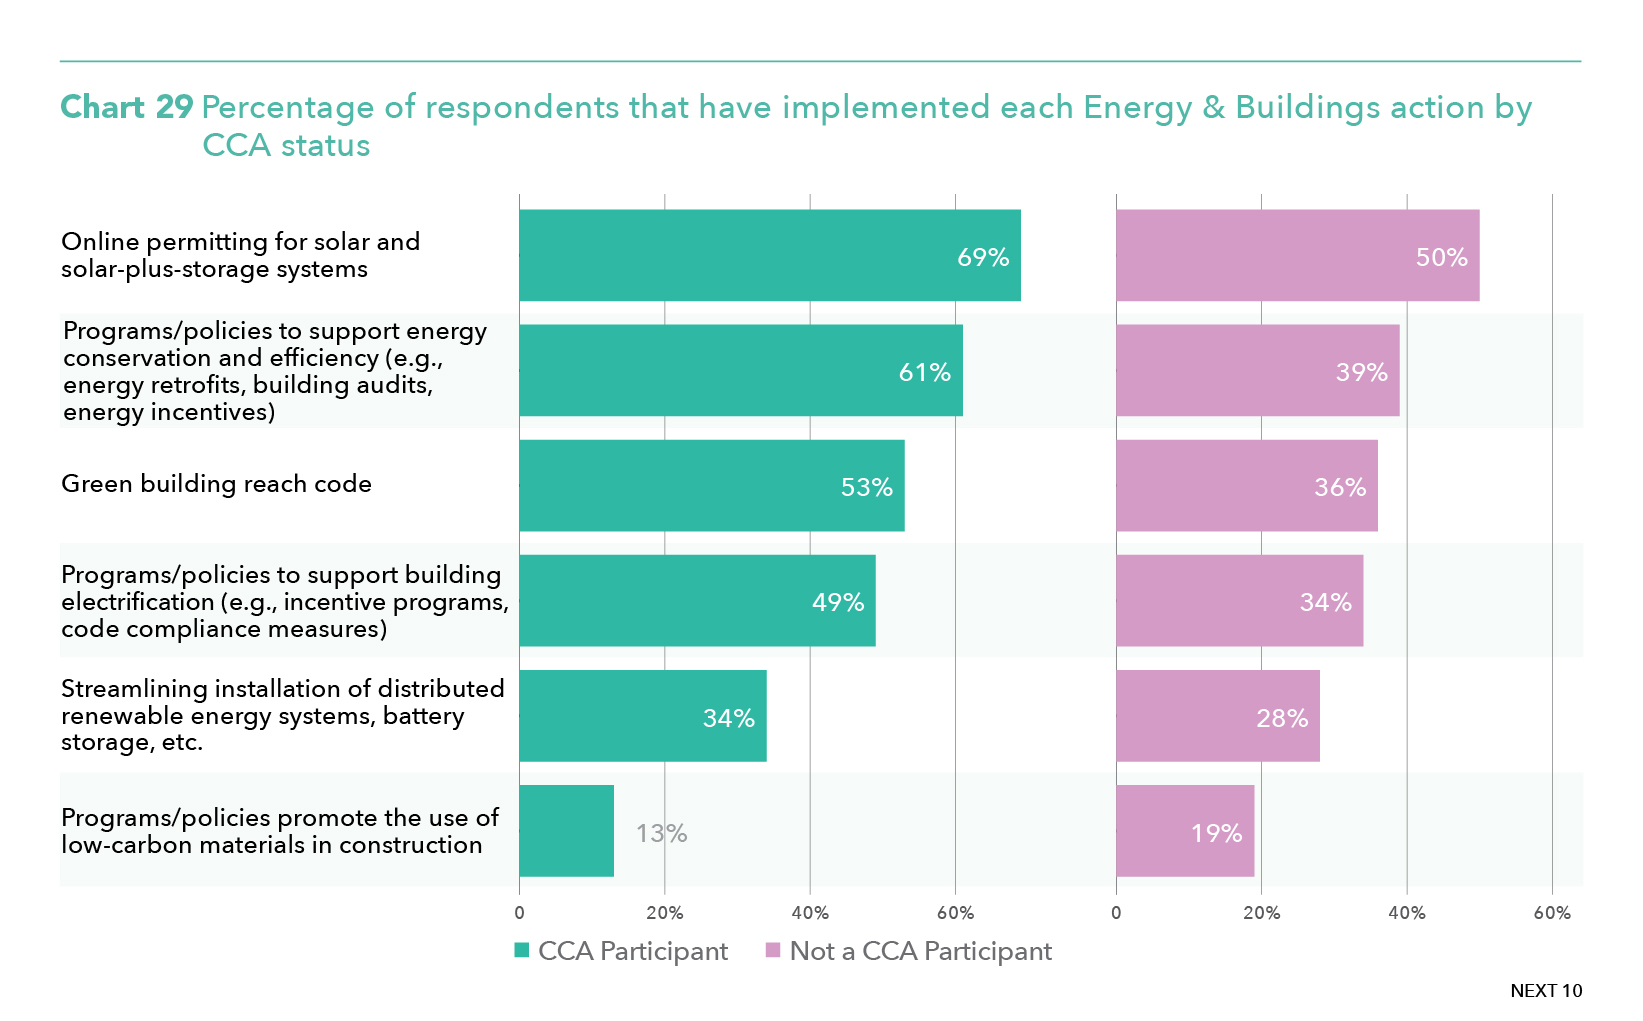
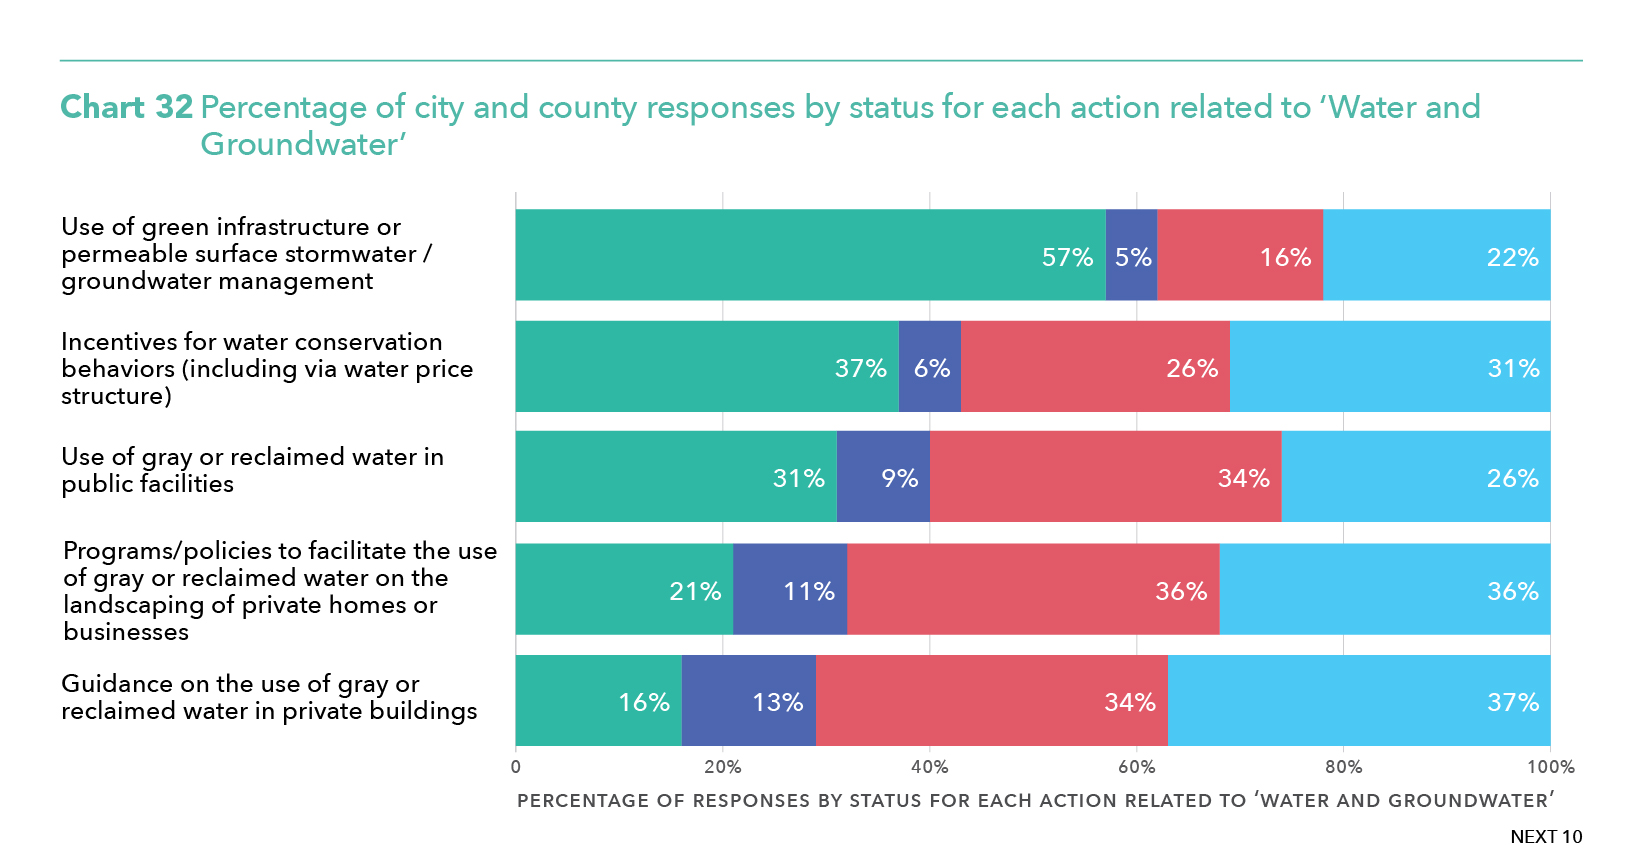
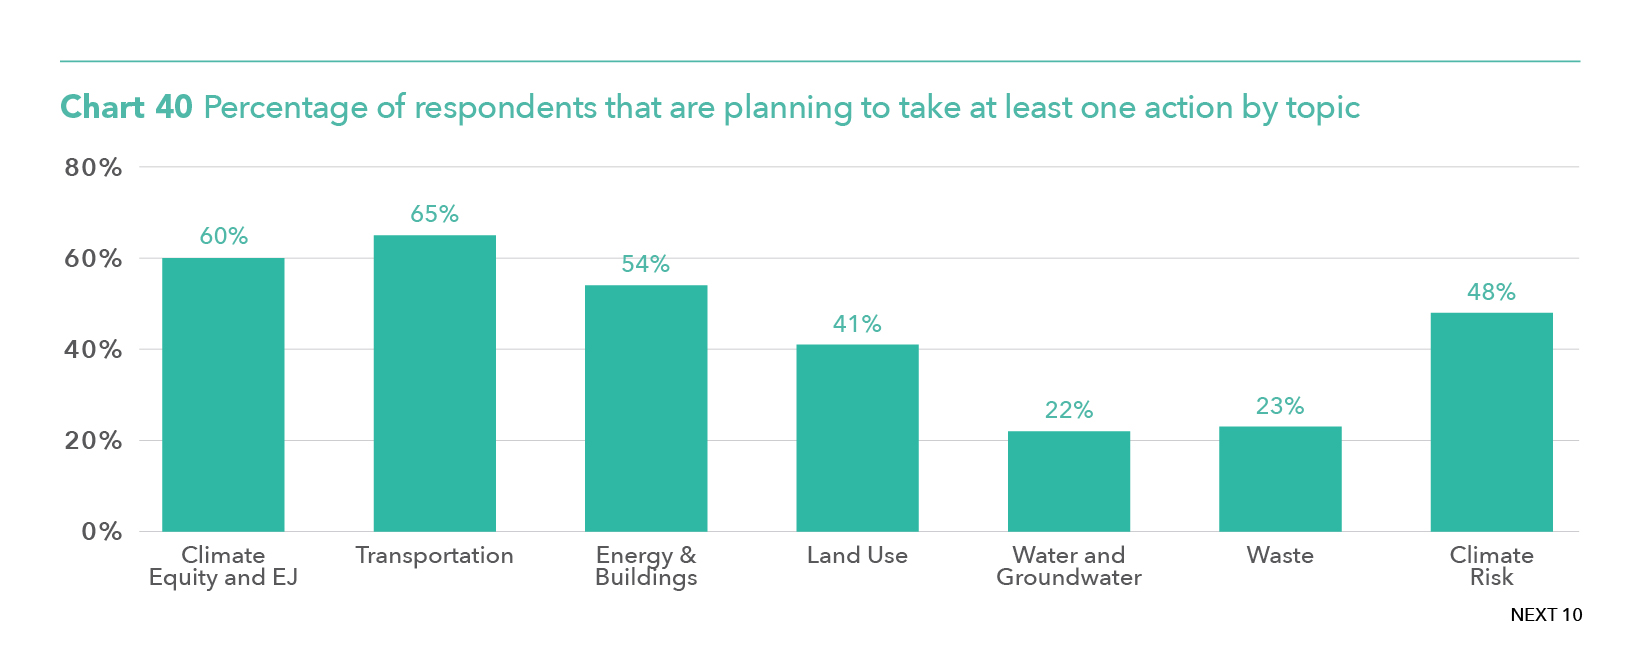
- Responding jurisdictions were most active in implementing climate policies related to land use and transportation, followed by energy and buildings.
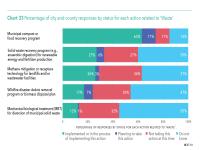
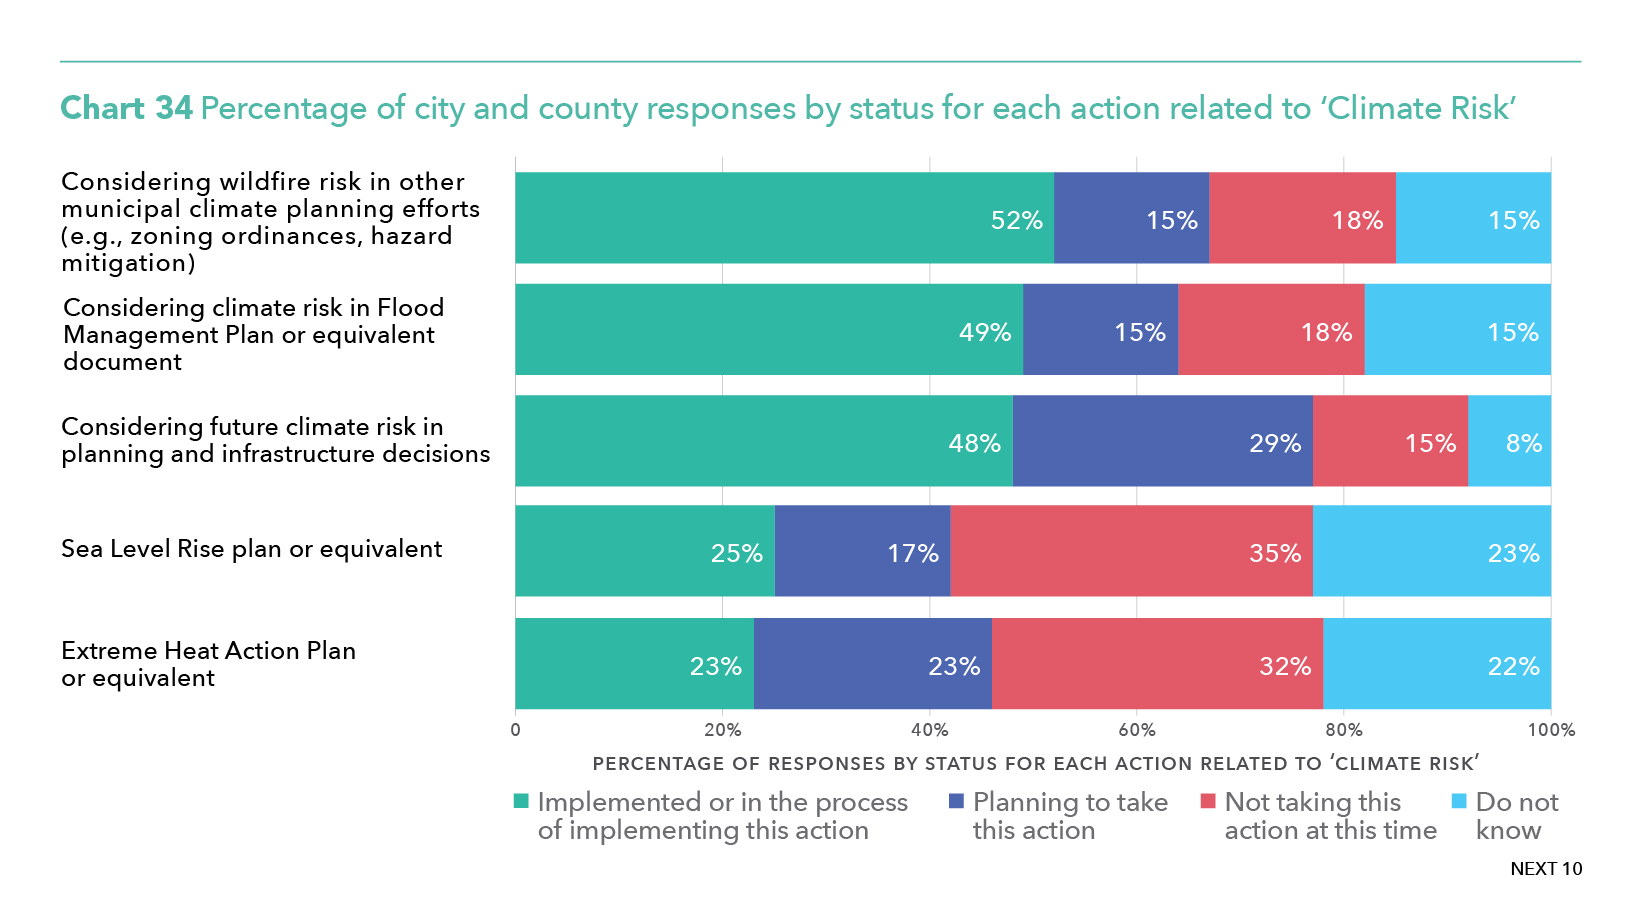
- Many jurisdictions needed additional resources dedicated to protecting residents against climate-driven disasters, such as drought, flooding, wildfire, and extreme heat. However, the results show higher levels of planning activity for wildfire (52%) and flooding (49%) and much lower levels of activity preparing for extreme heat (23%).
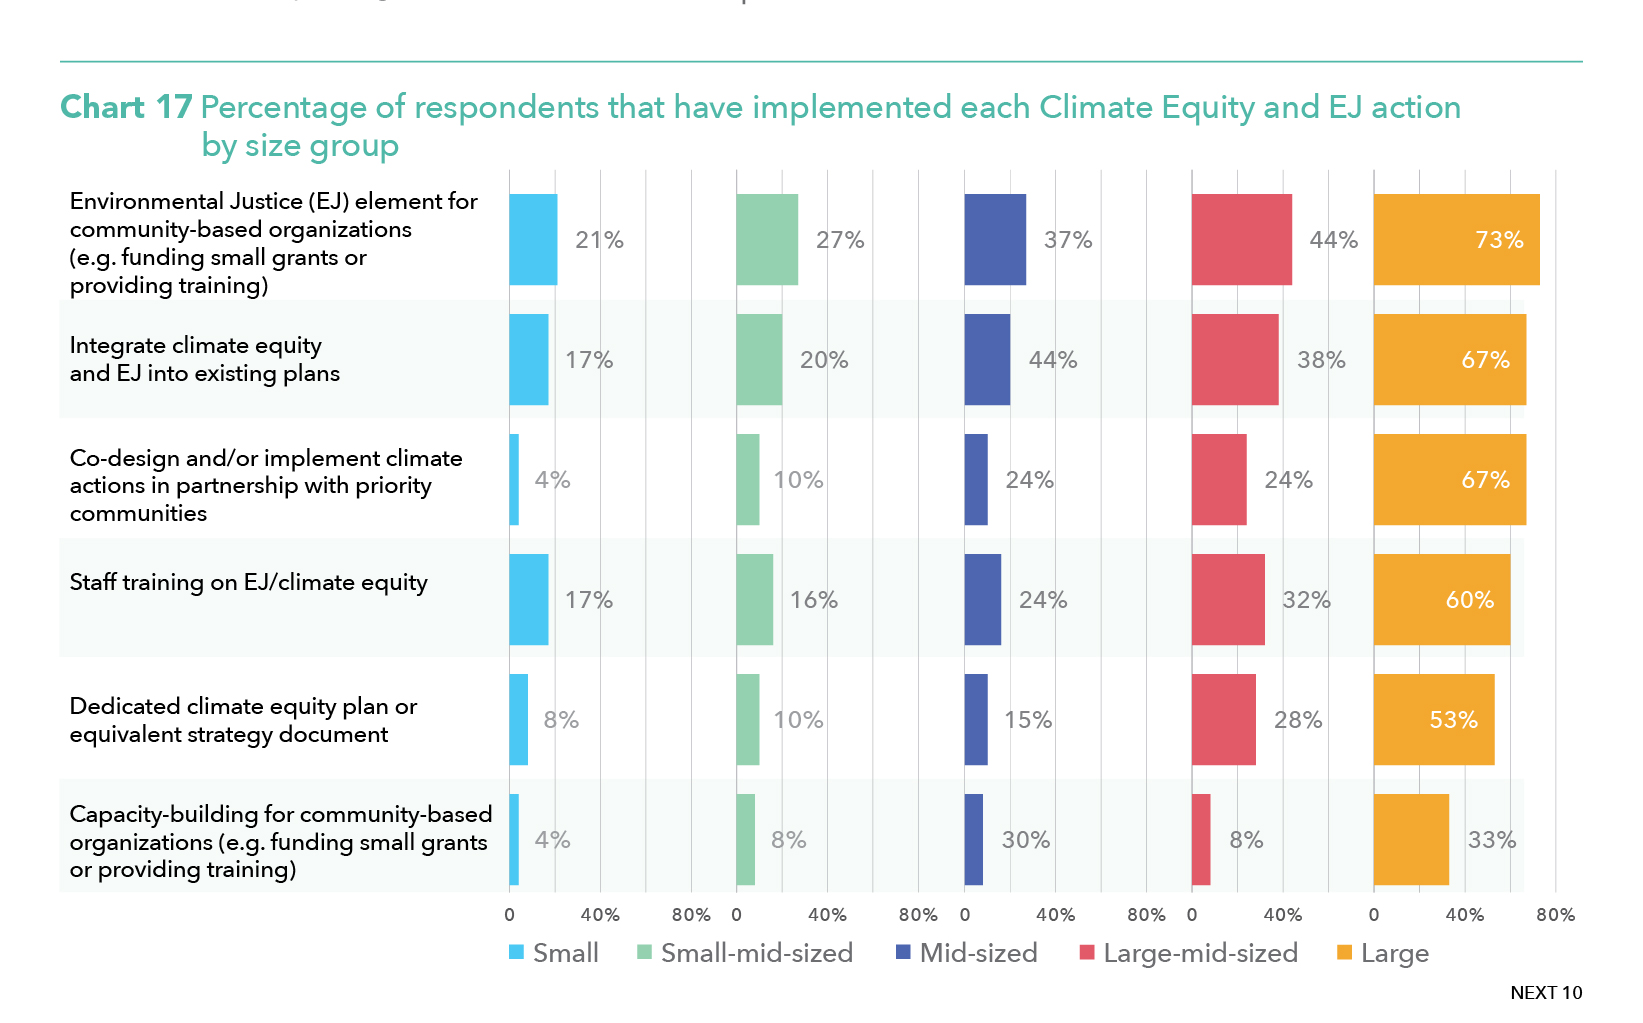
- Respondents in smaller communities are more likely to implement policies that support climate goals while achieving other co-benefits for residents, frequently framing these strategies as in support of public health.
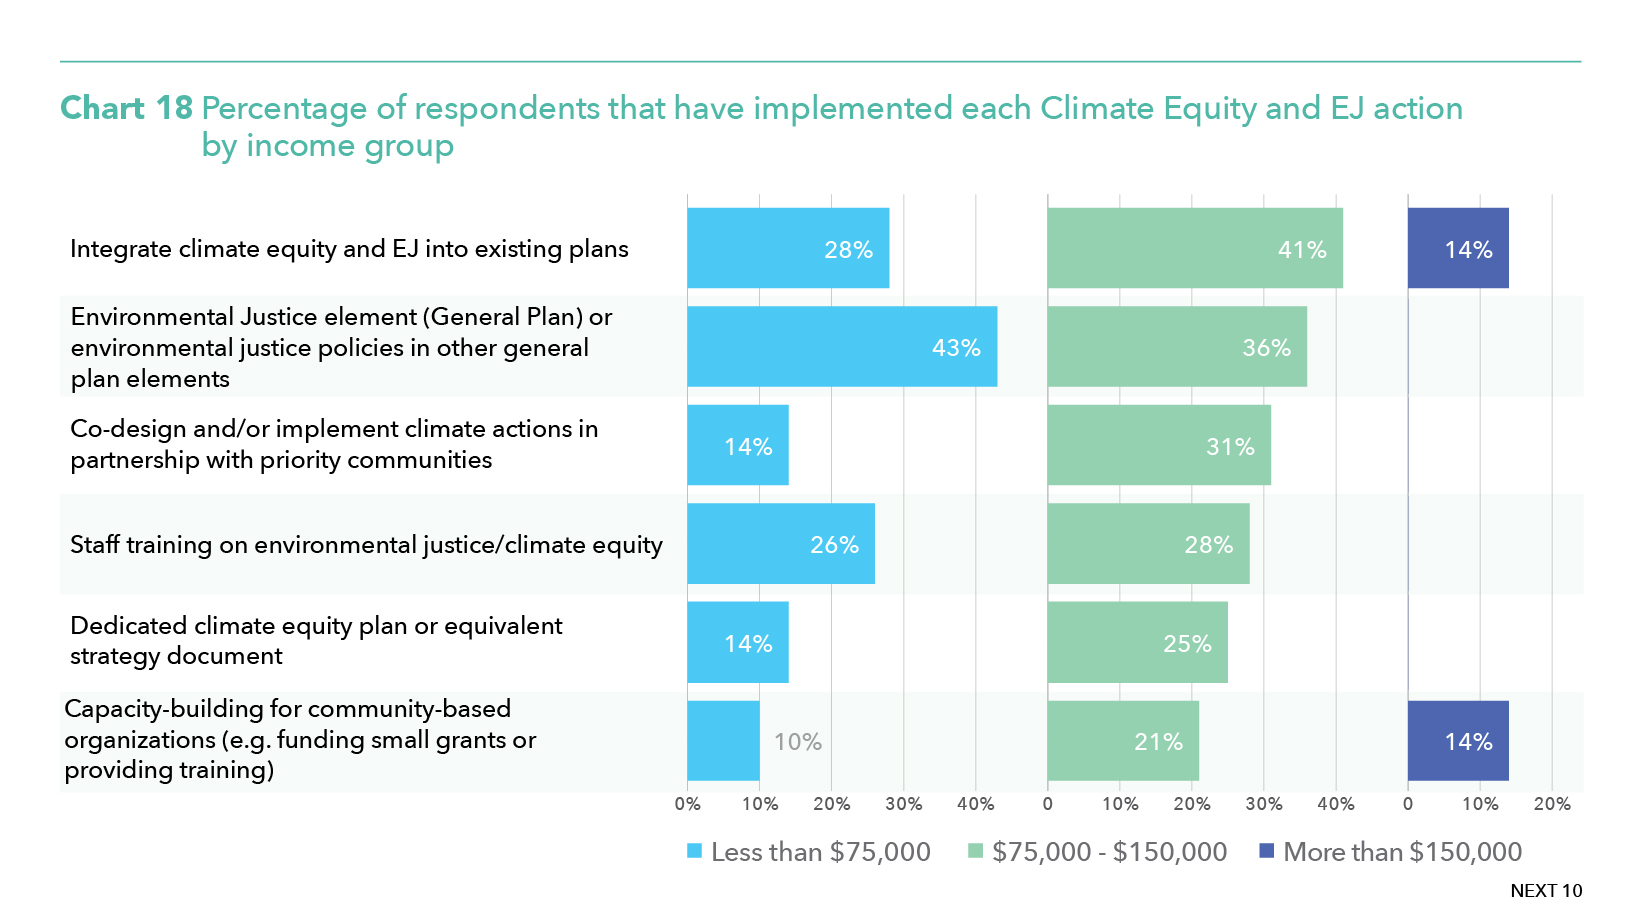
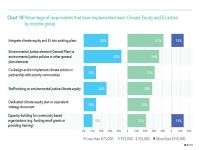
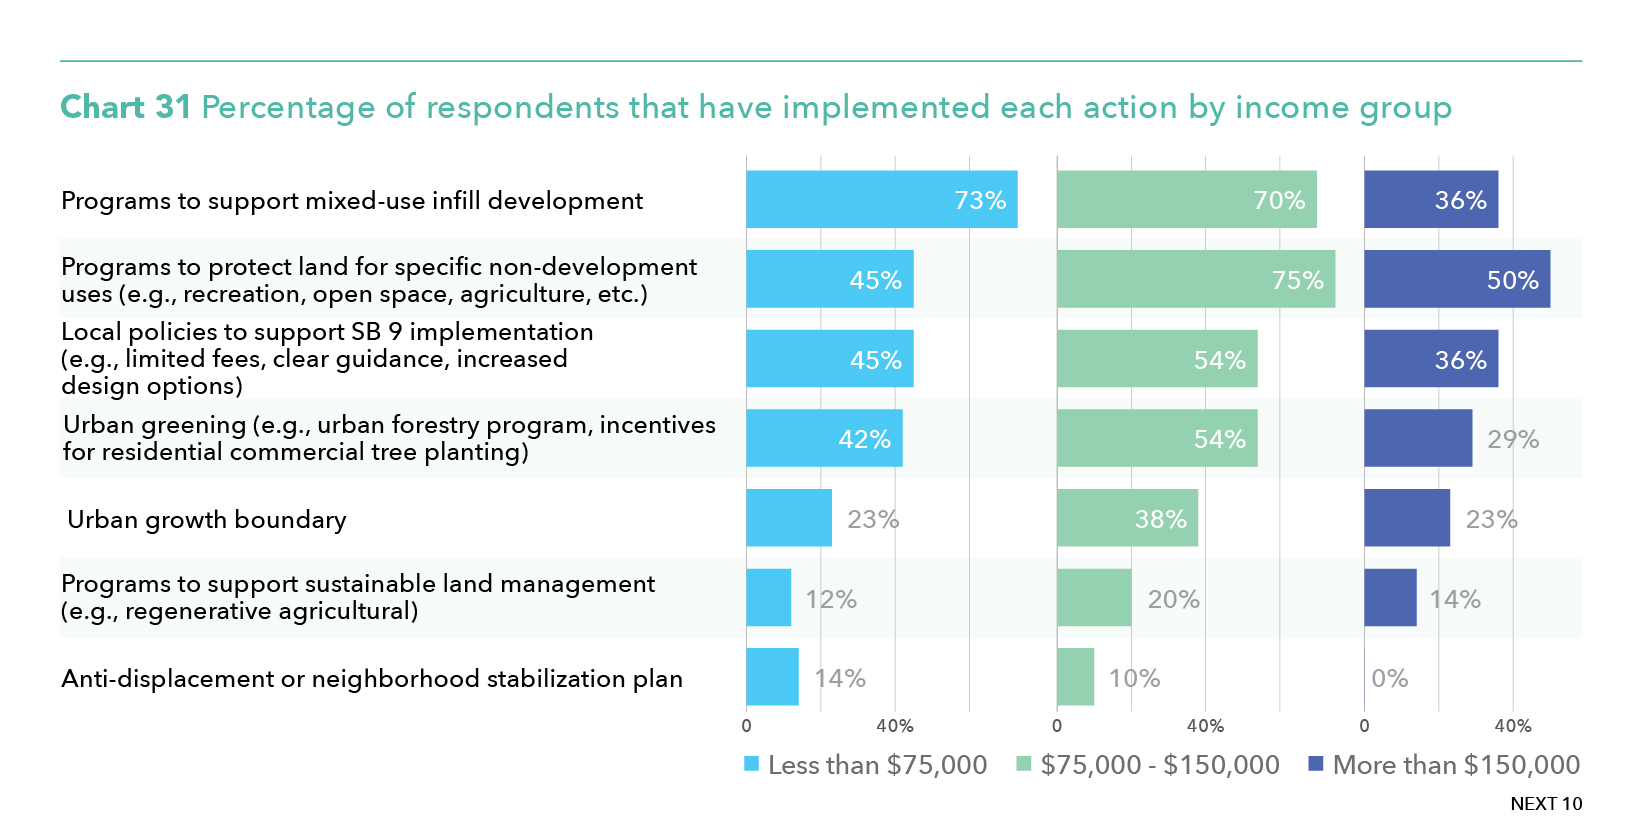
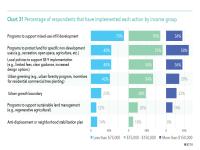
- Respondents in the lowest-income group (43%) were much more likely to implement an environmental justice element or environmental justice policies into other general plan elements than both middle (36%) and high-income groups (0%).
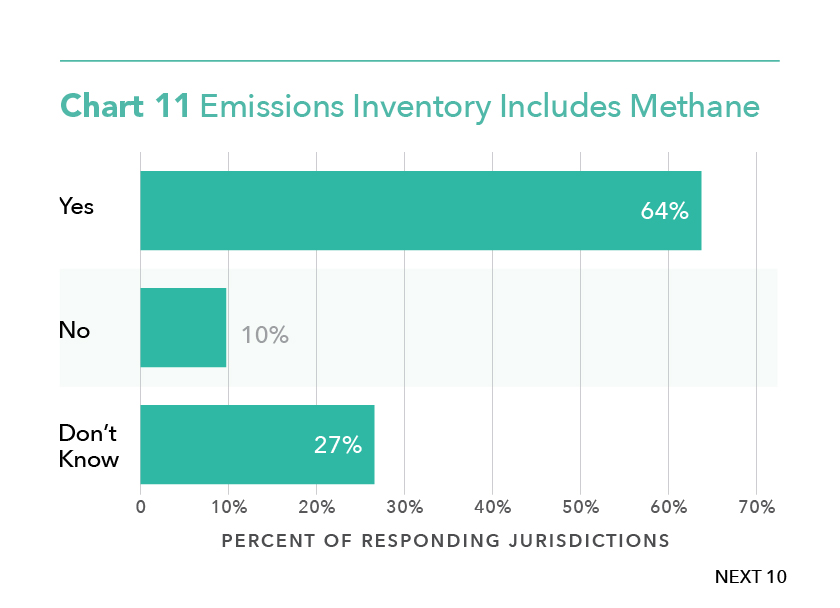
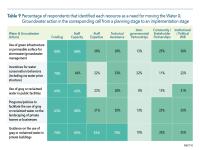
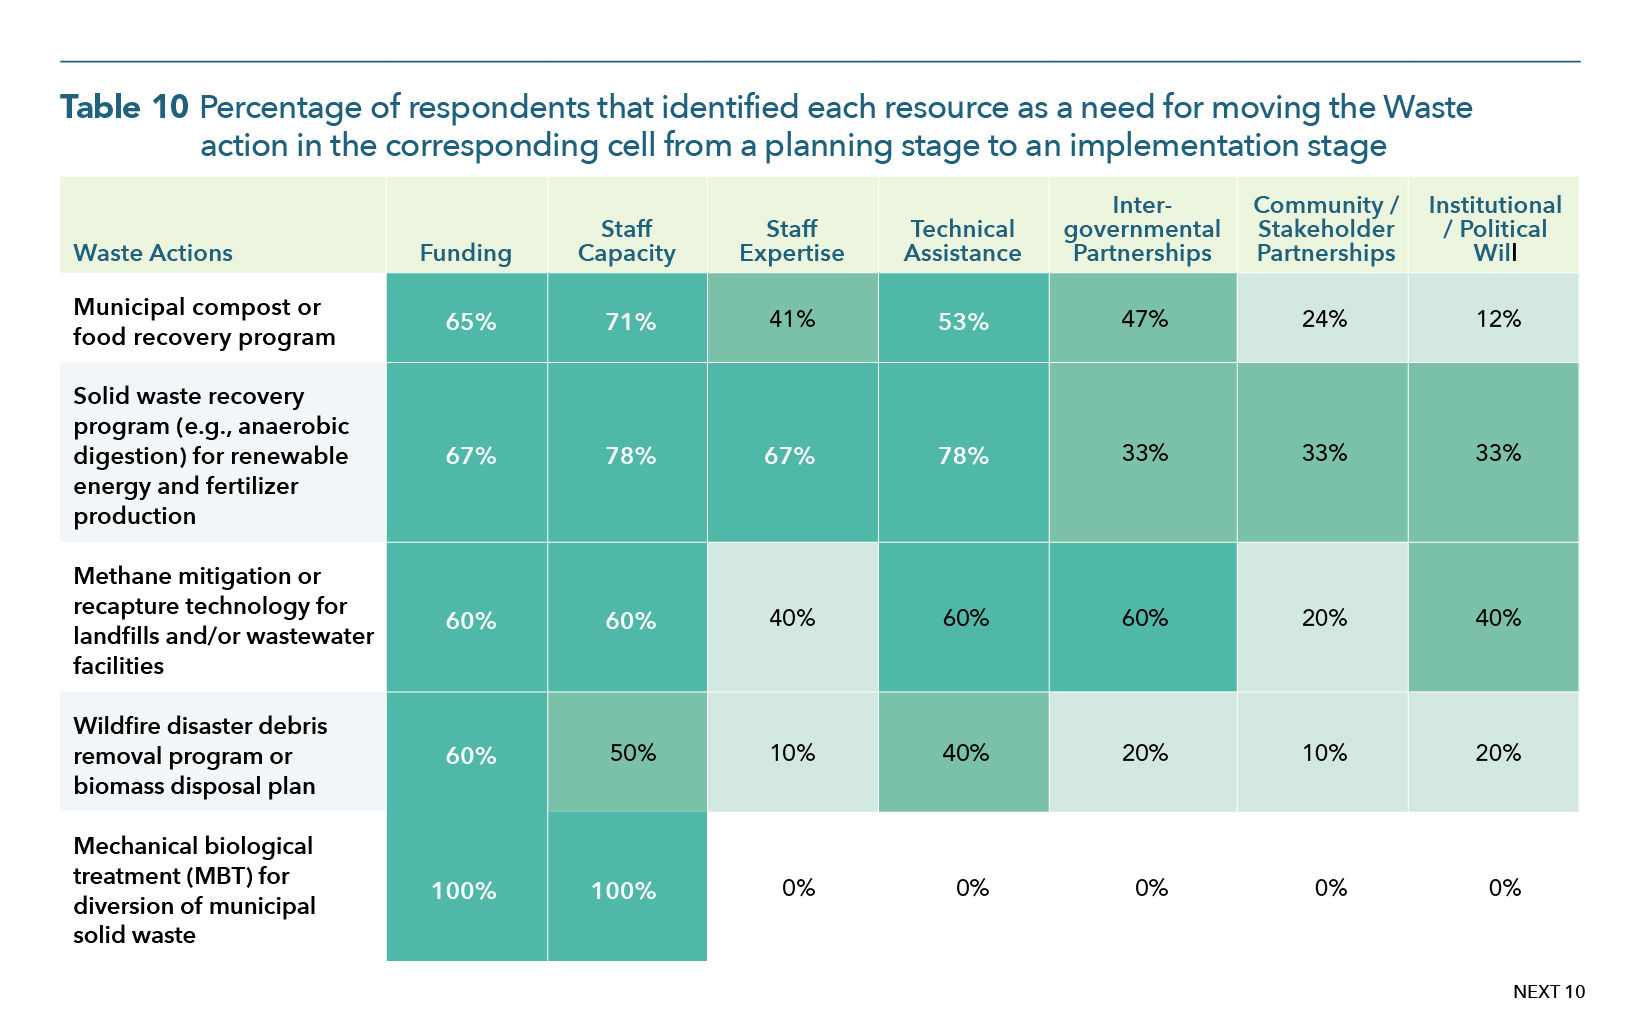
- The waste sector presents opportunities for increased action, which is important for reducing methane emissions. Besides the implementation of a municipal compost or food recovery program, few responding jurisdictions indicated that they had implemented actions related to waste.
Next 10 cannot grant permission to use graphics from this publication; additional permissions may be required from the copyright holder. Please view our Terms of Use policy for more information or contact Next 10 at info@next10.org with any questions.