Publications
The Future of California's Water-Energy-Climate Nexus
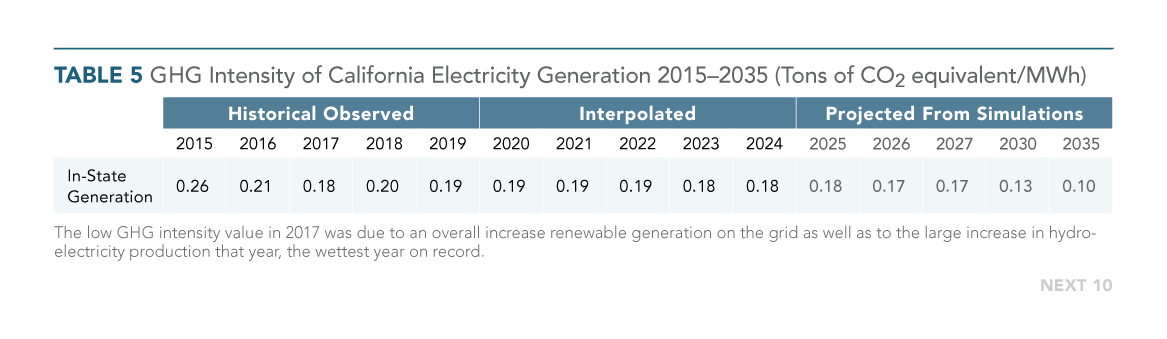
Without urgent water efficiency measures, carbon emissions associated with water usage in California are likely to spike in coming years, as changing sources of water supply and population growth drive up energy-intensive urban and agricultural water needs. Climate change-fueled droughts are likely to further increase water-related energy use and carbon emissions. That’s the finding of Next 10's latest report—The Future of California’s Water-Energy-Climate Nexus.
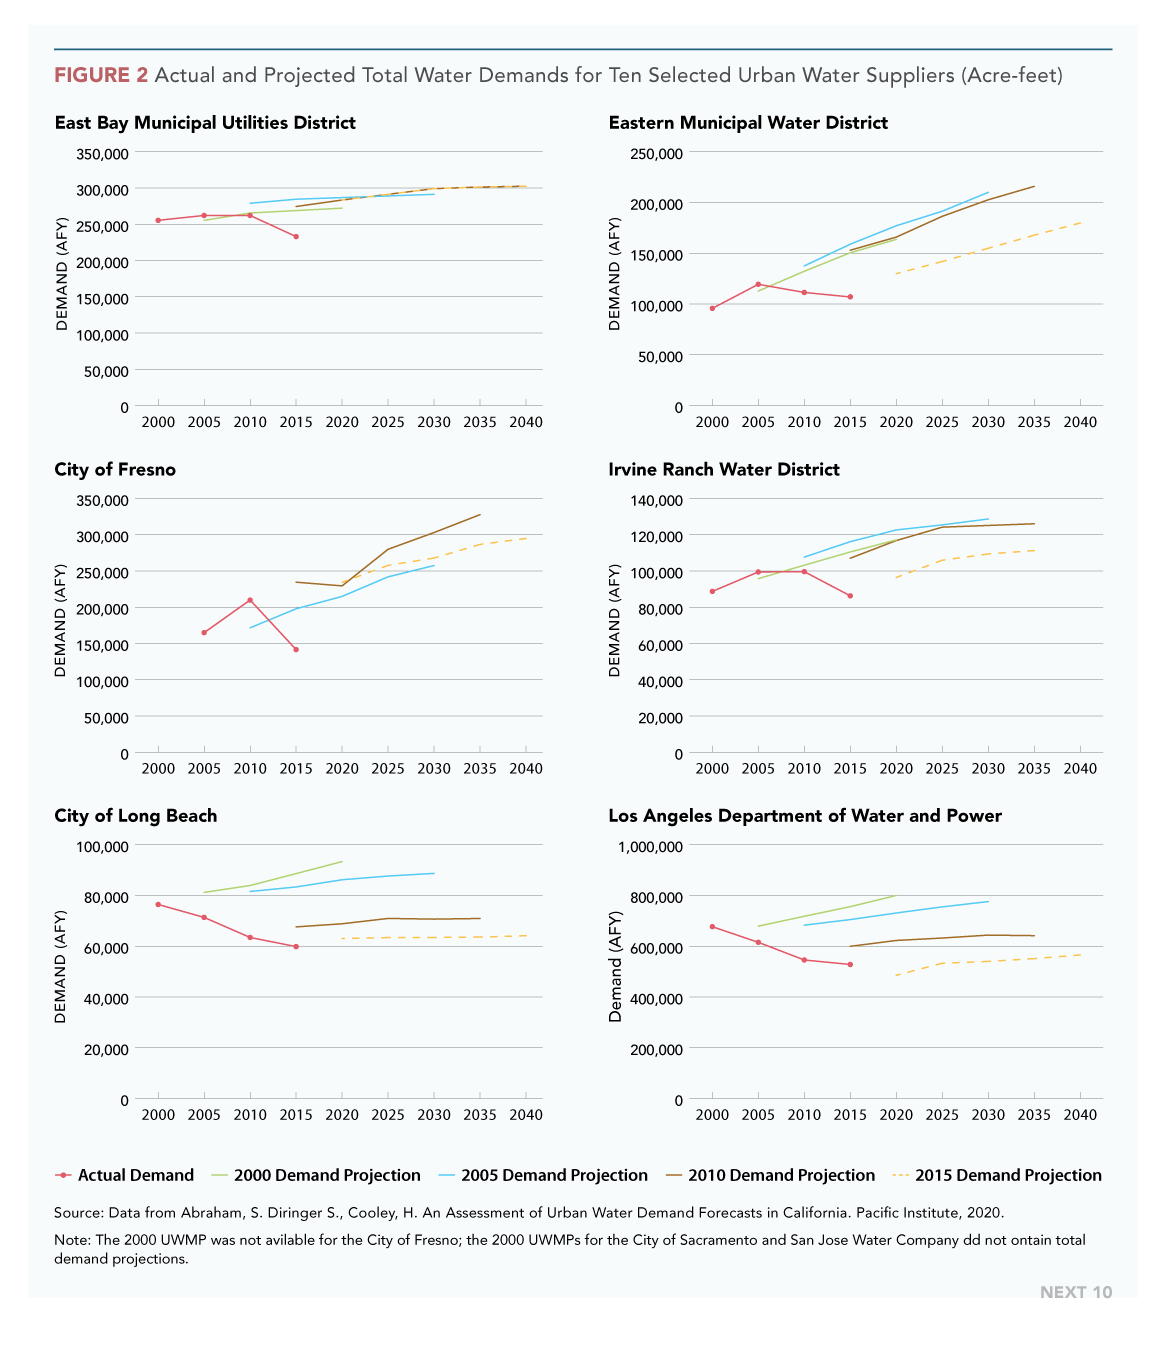
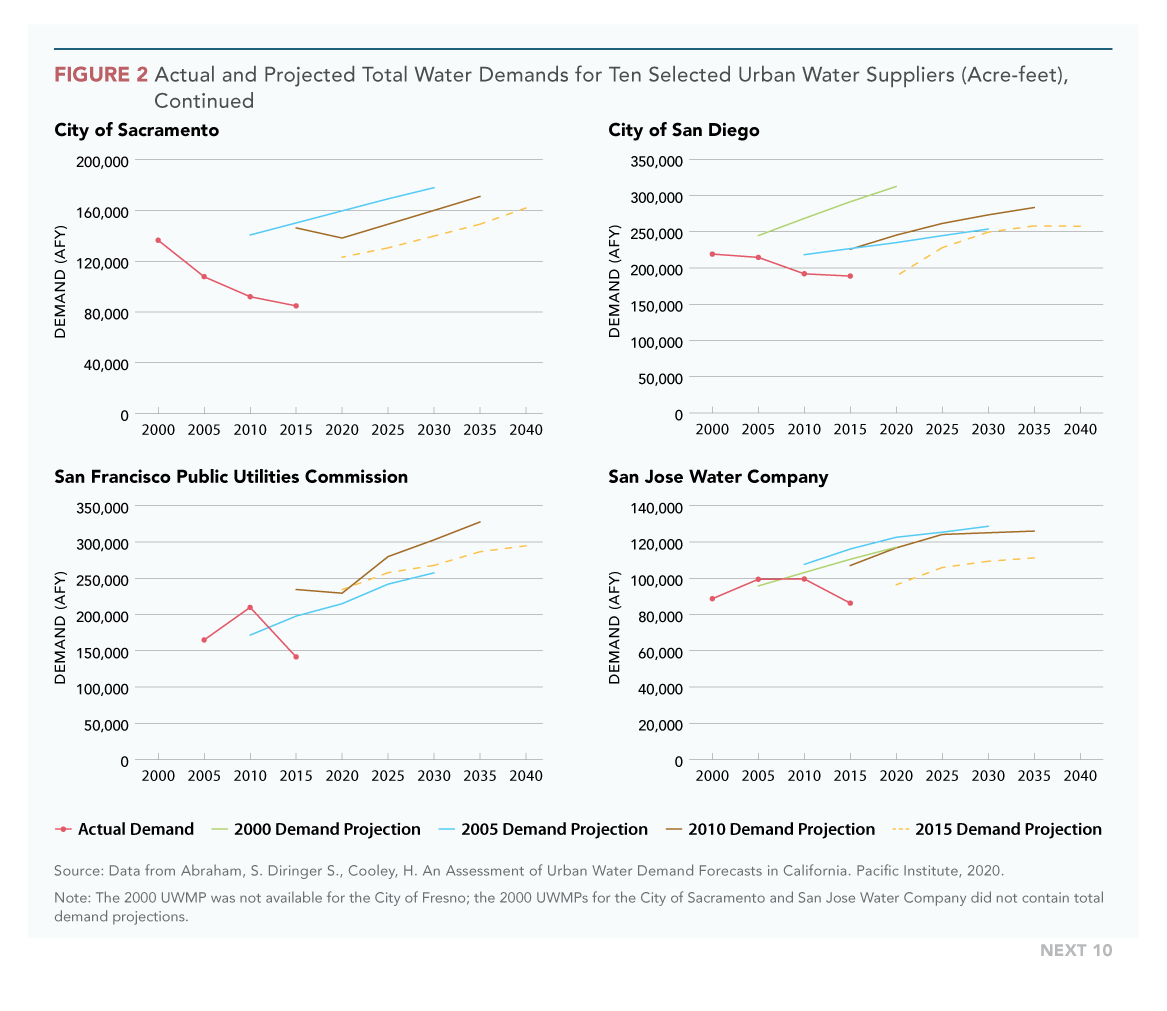
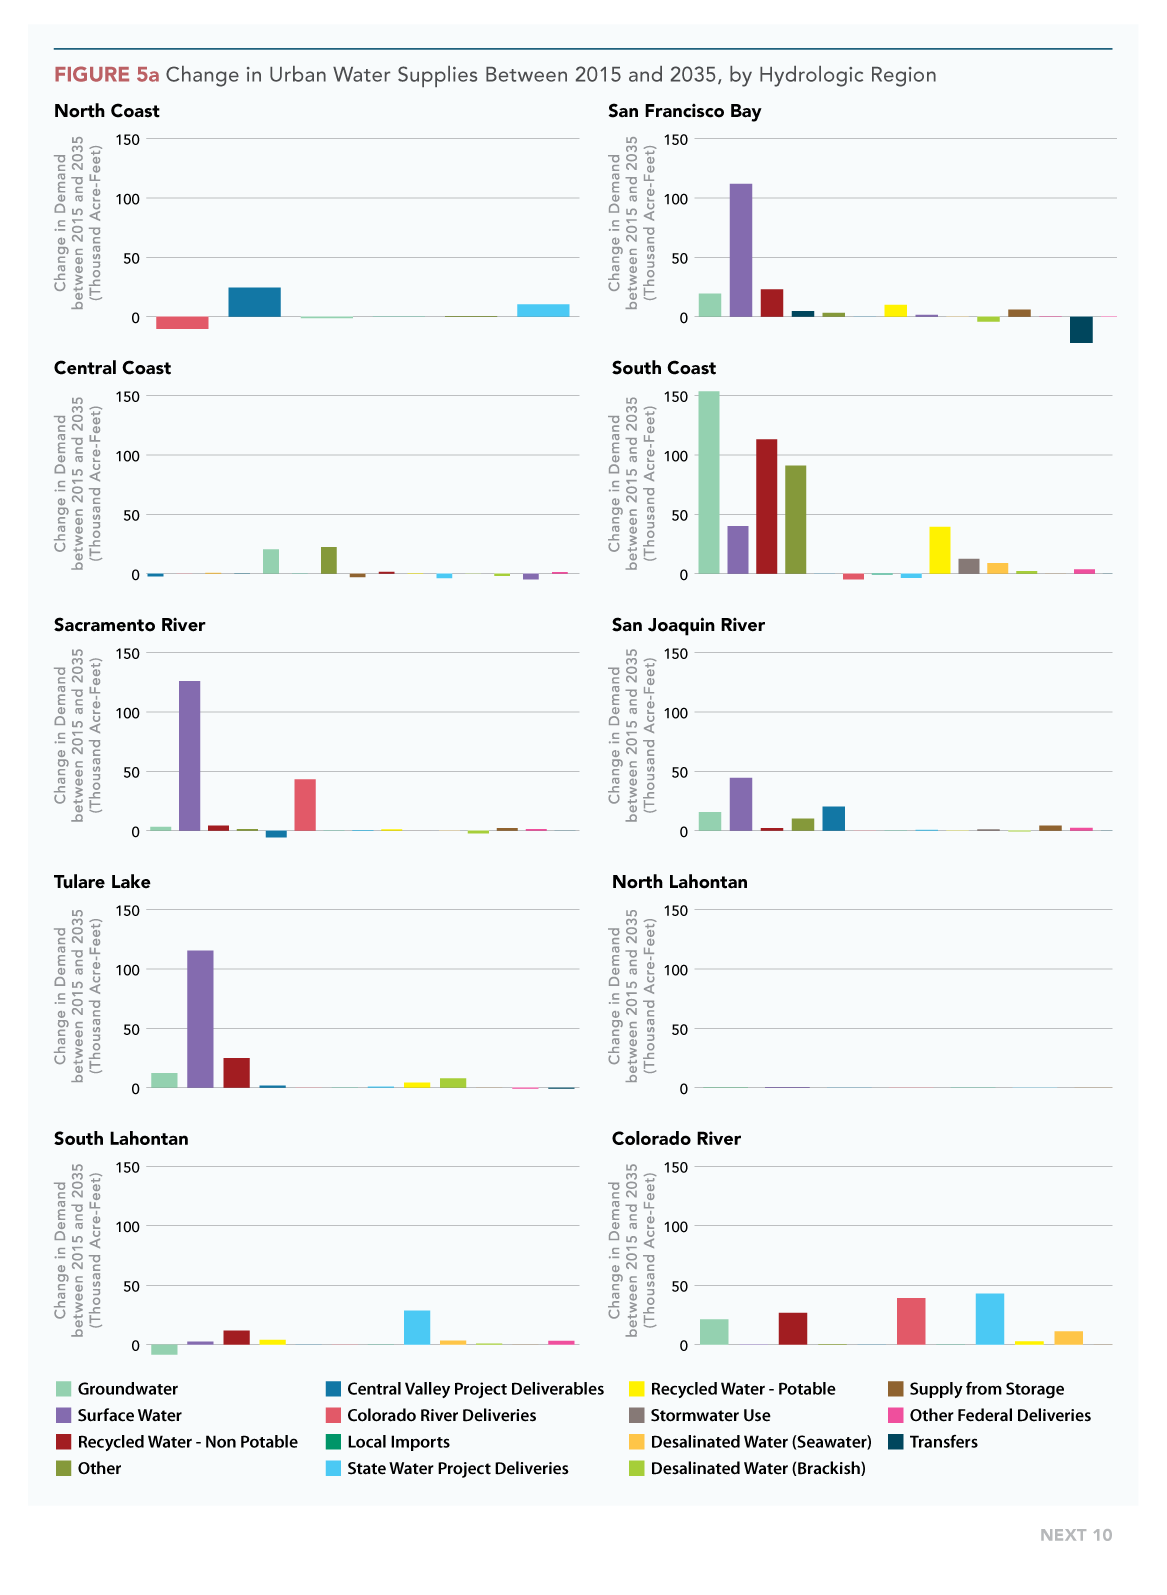
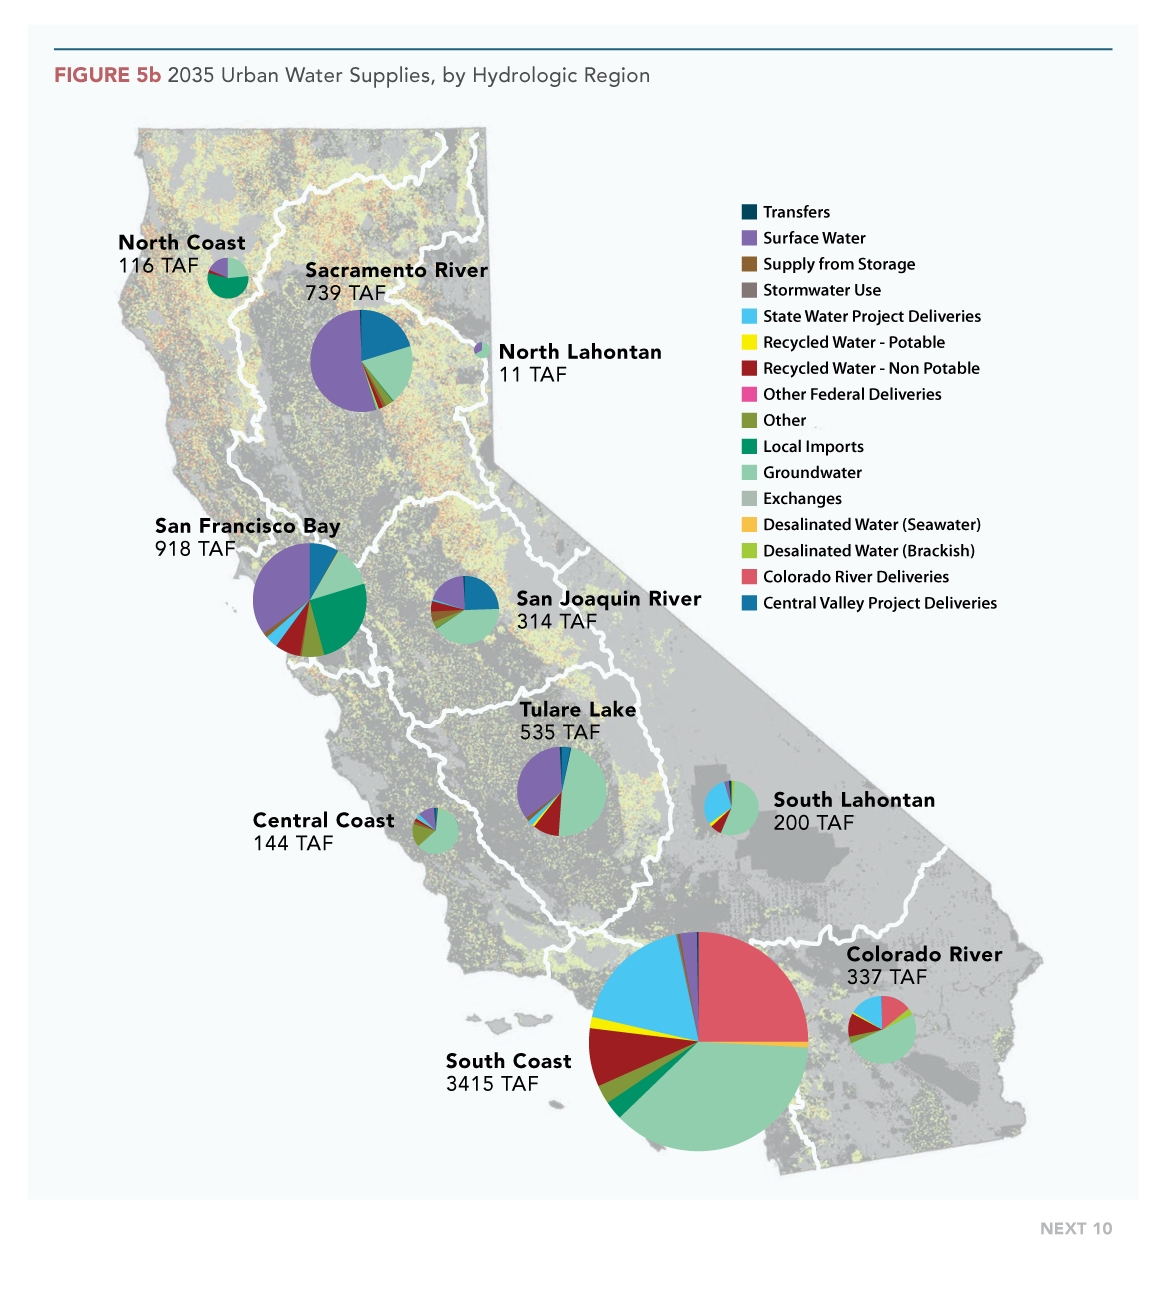
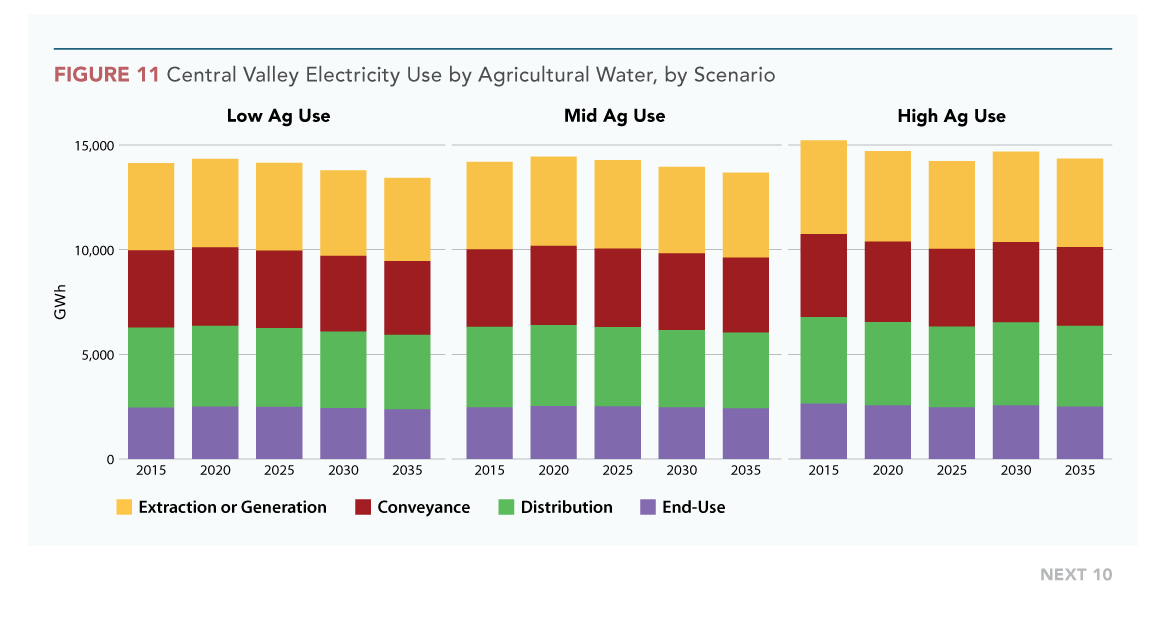
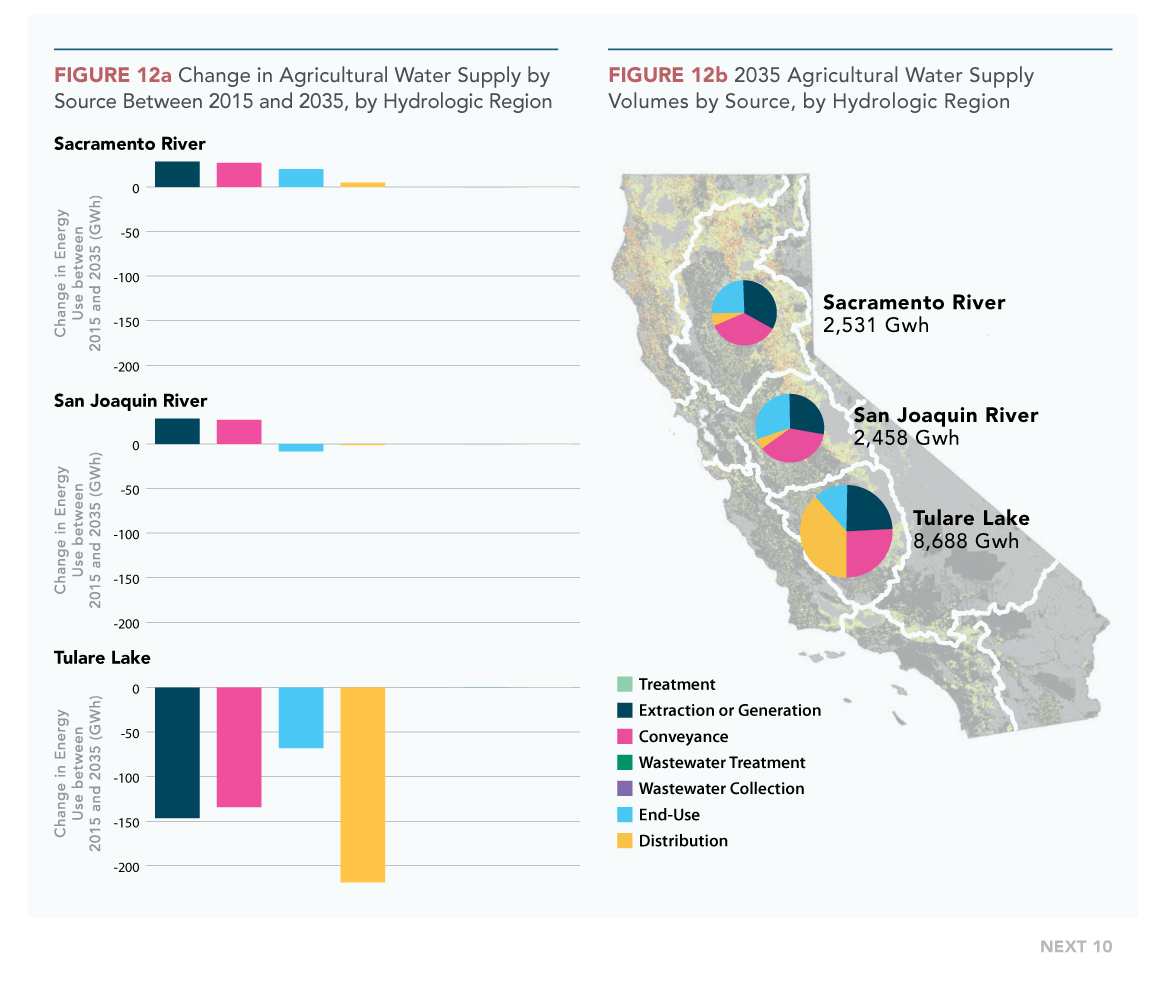
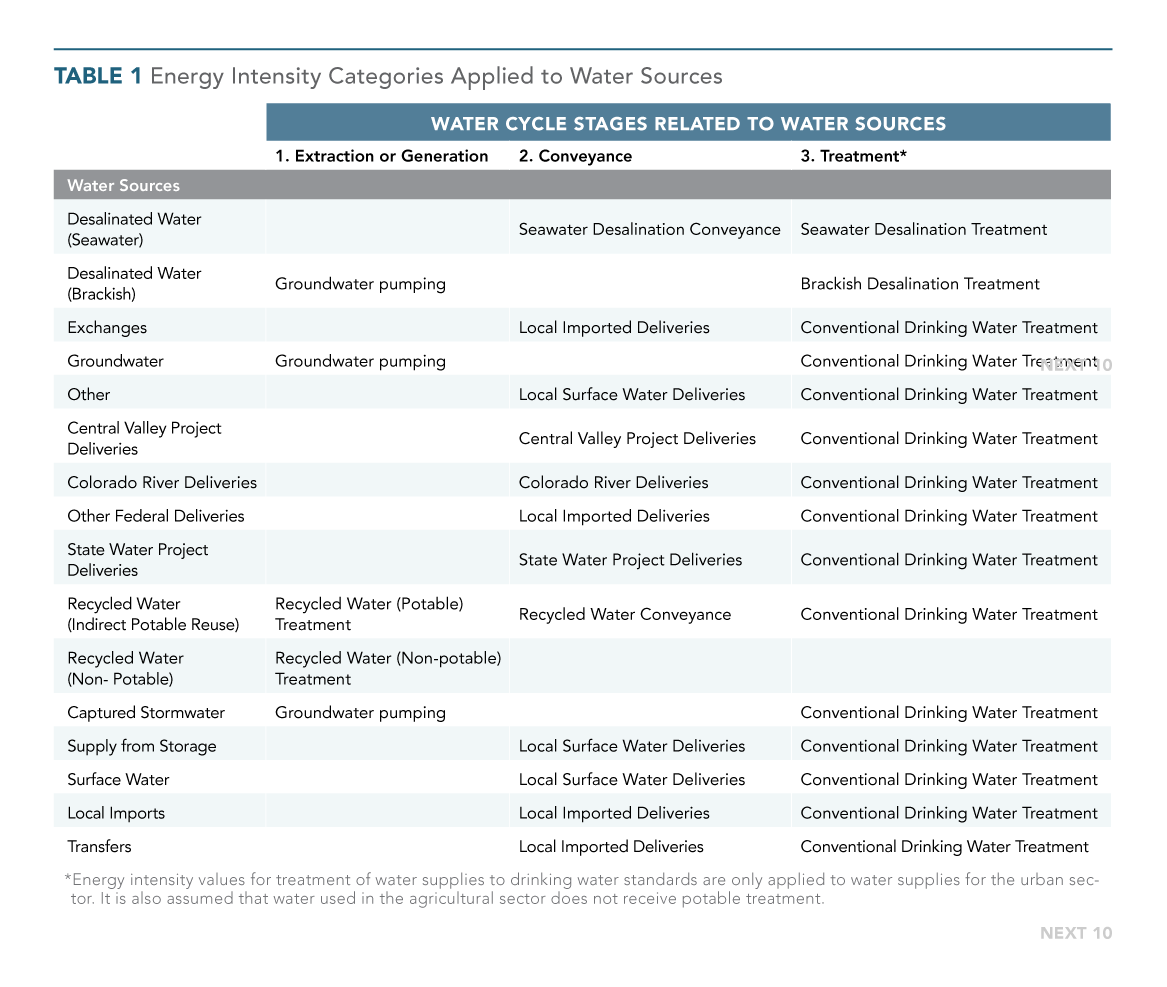
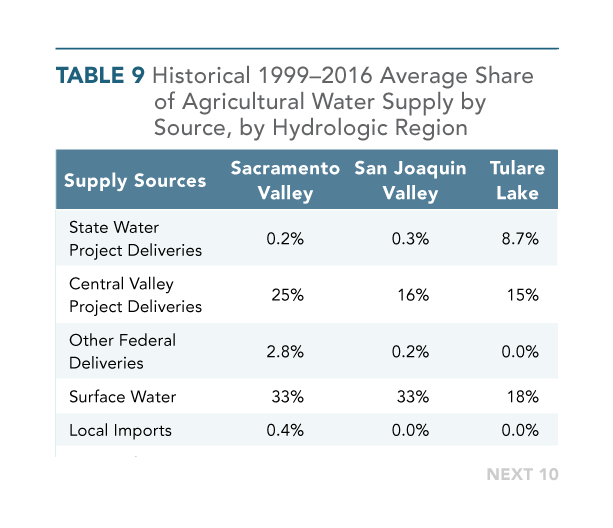
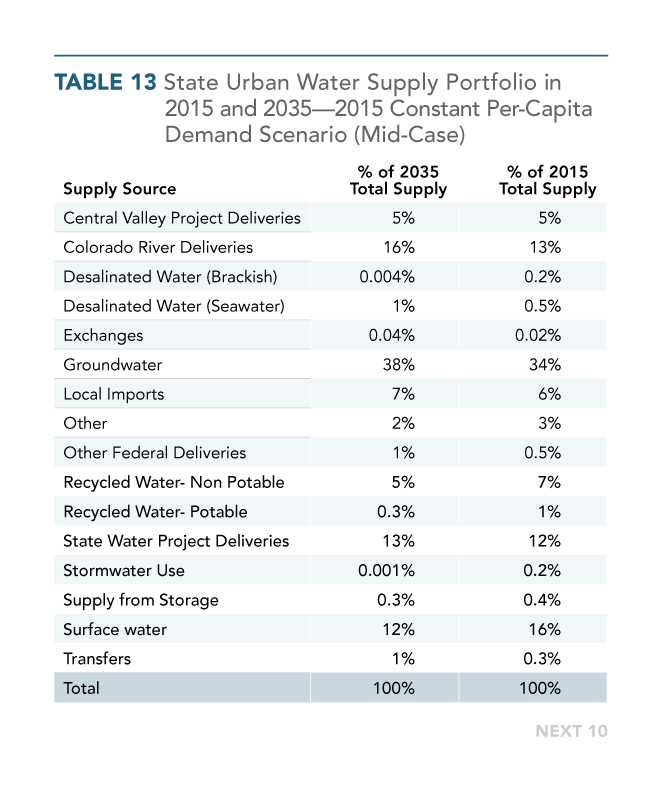
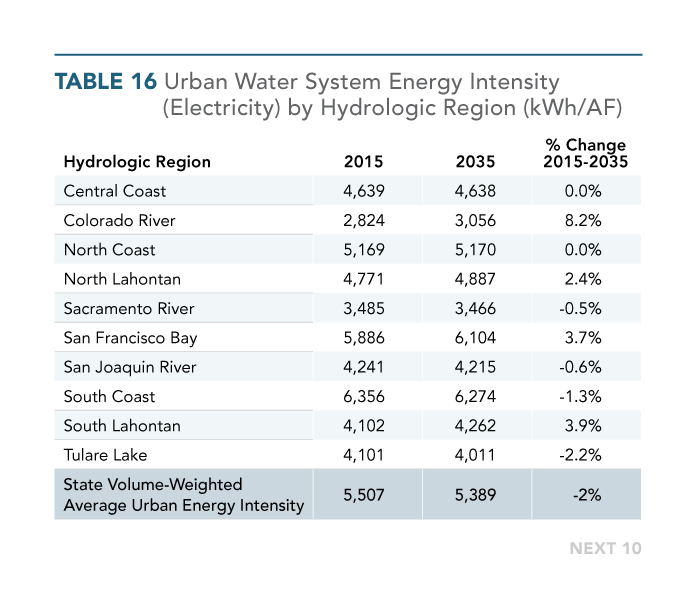
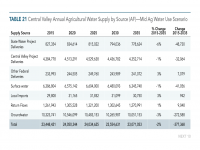
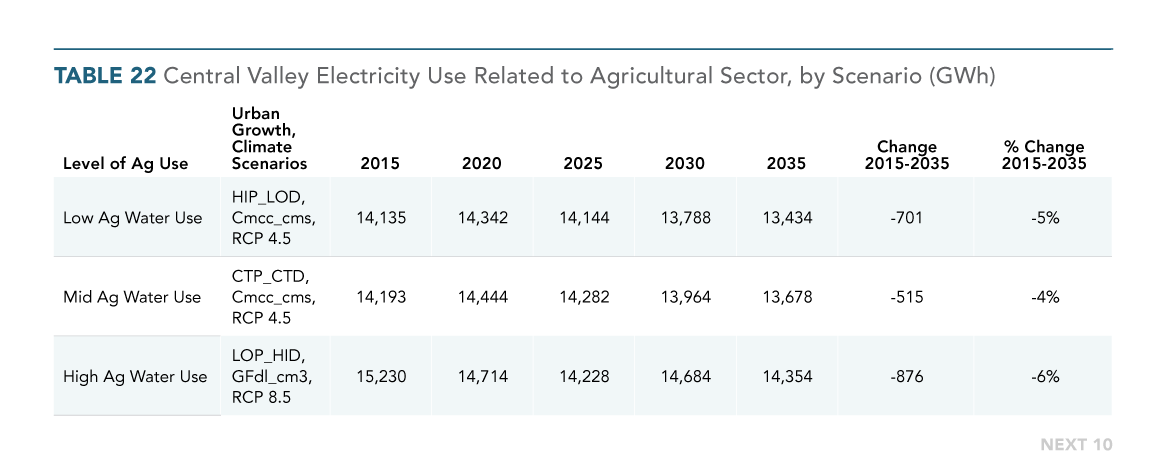
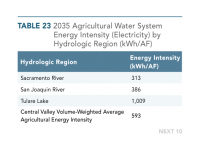
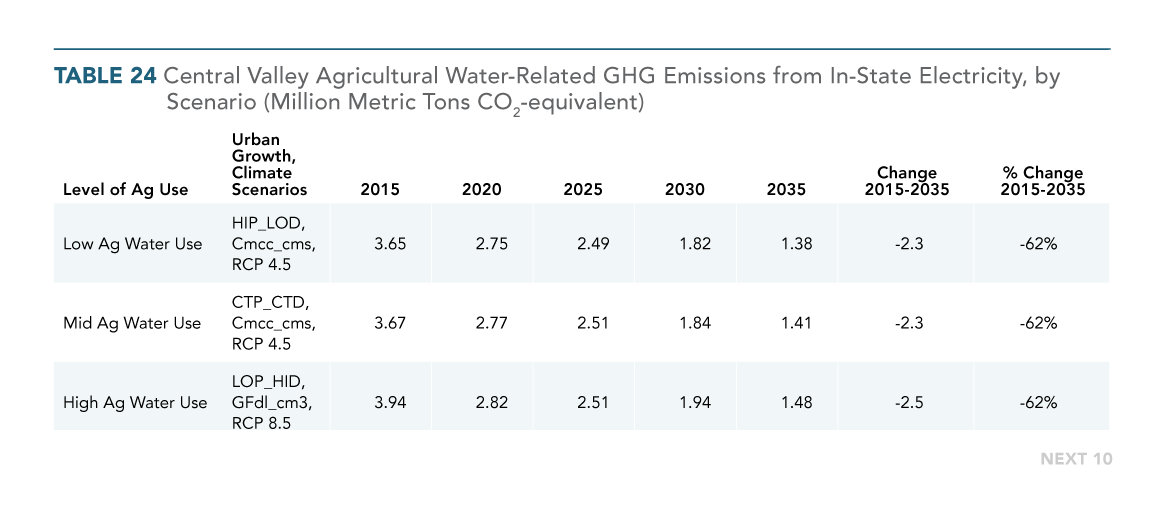
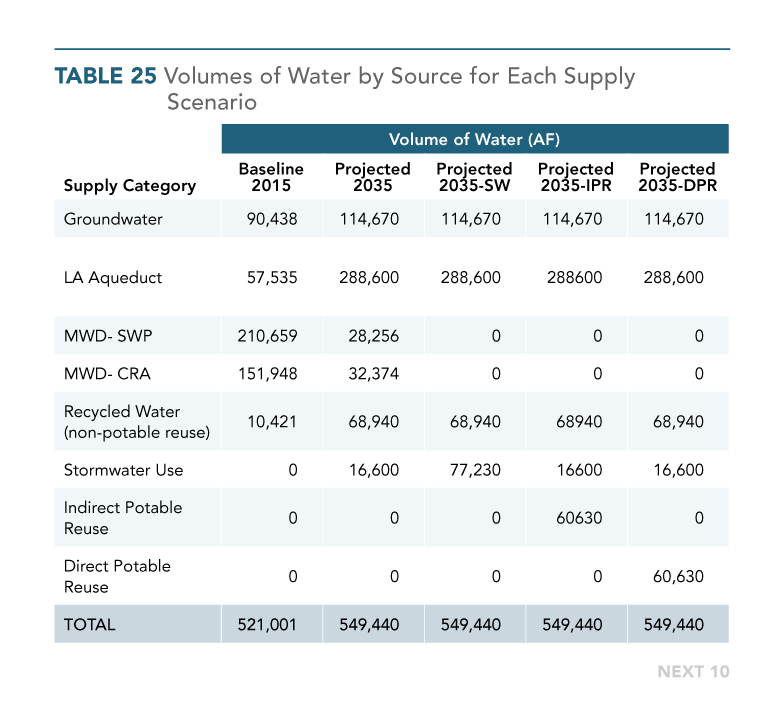
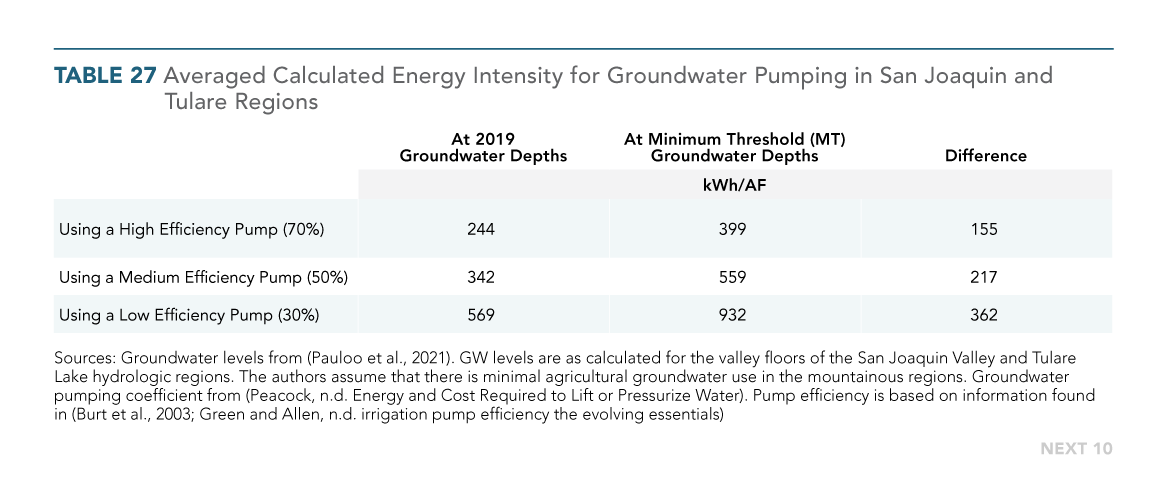
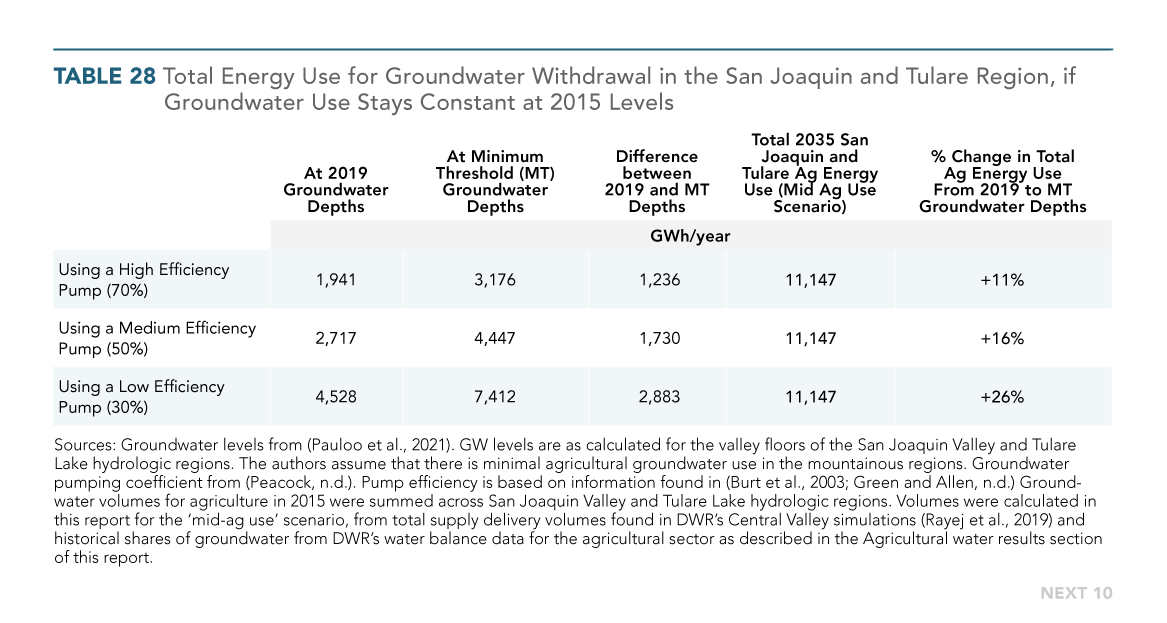
While California has experienced a dramatic decoupling between water use and population growth over the last 40 years, continued population growth and ongoing water challenges are prompting urban water planners to pursue new water-supply options—including desalination and recycled water—which are often more energy-intensive than local surface water supplies. In the agricultural sector, declining groundwater levels make pumping water more energy-intensive. Meeting higher urban water demands—coupled with more energy-intensive water supply options for urban and agricultural users—could push water-related energy use and associated greenhouse gas emissions higher. The report finds that programs to provide incentives for transitioning from gas water heaters to highly-efficient electric alternatives like heat pumps could play a key role in cutting water-related emissions.
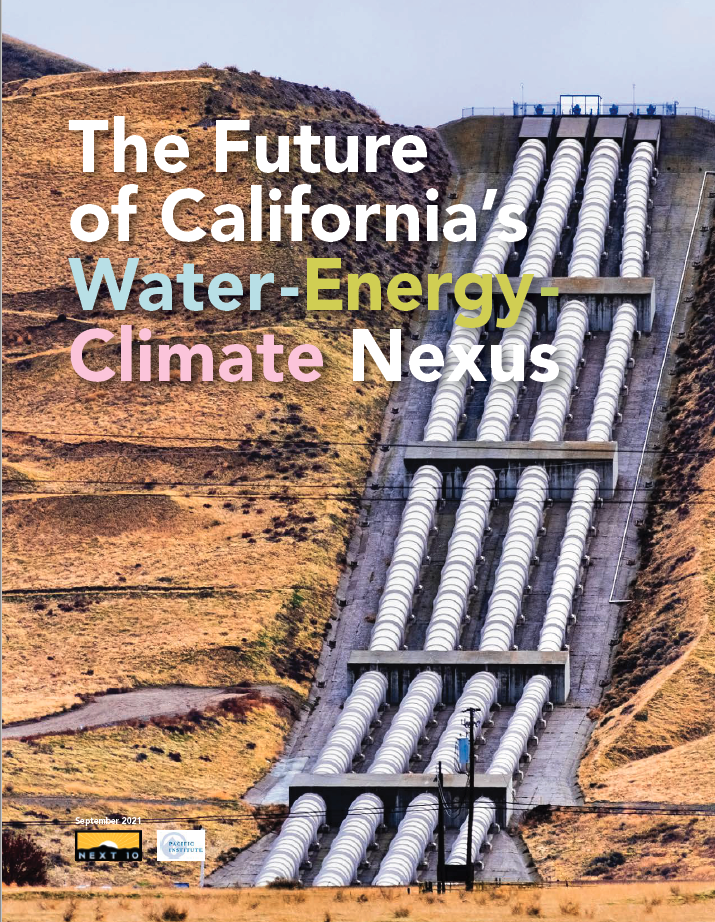
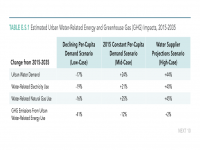
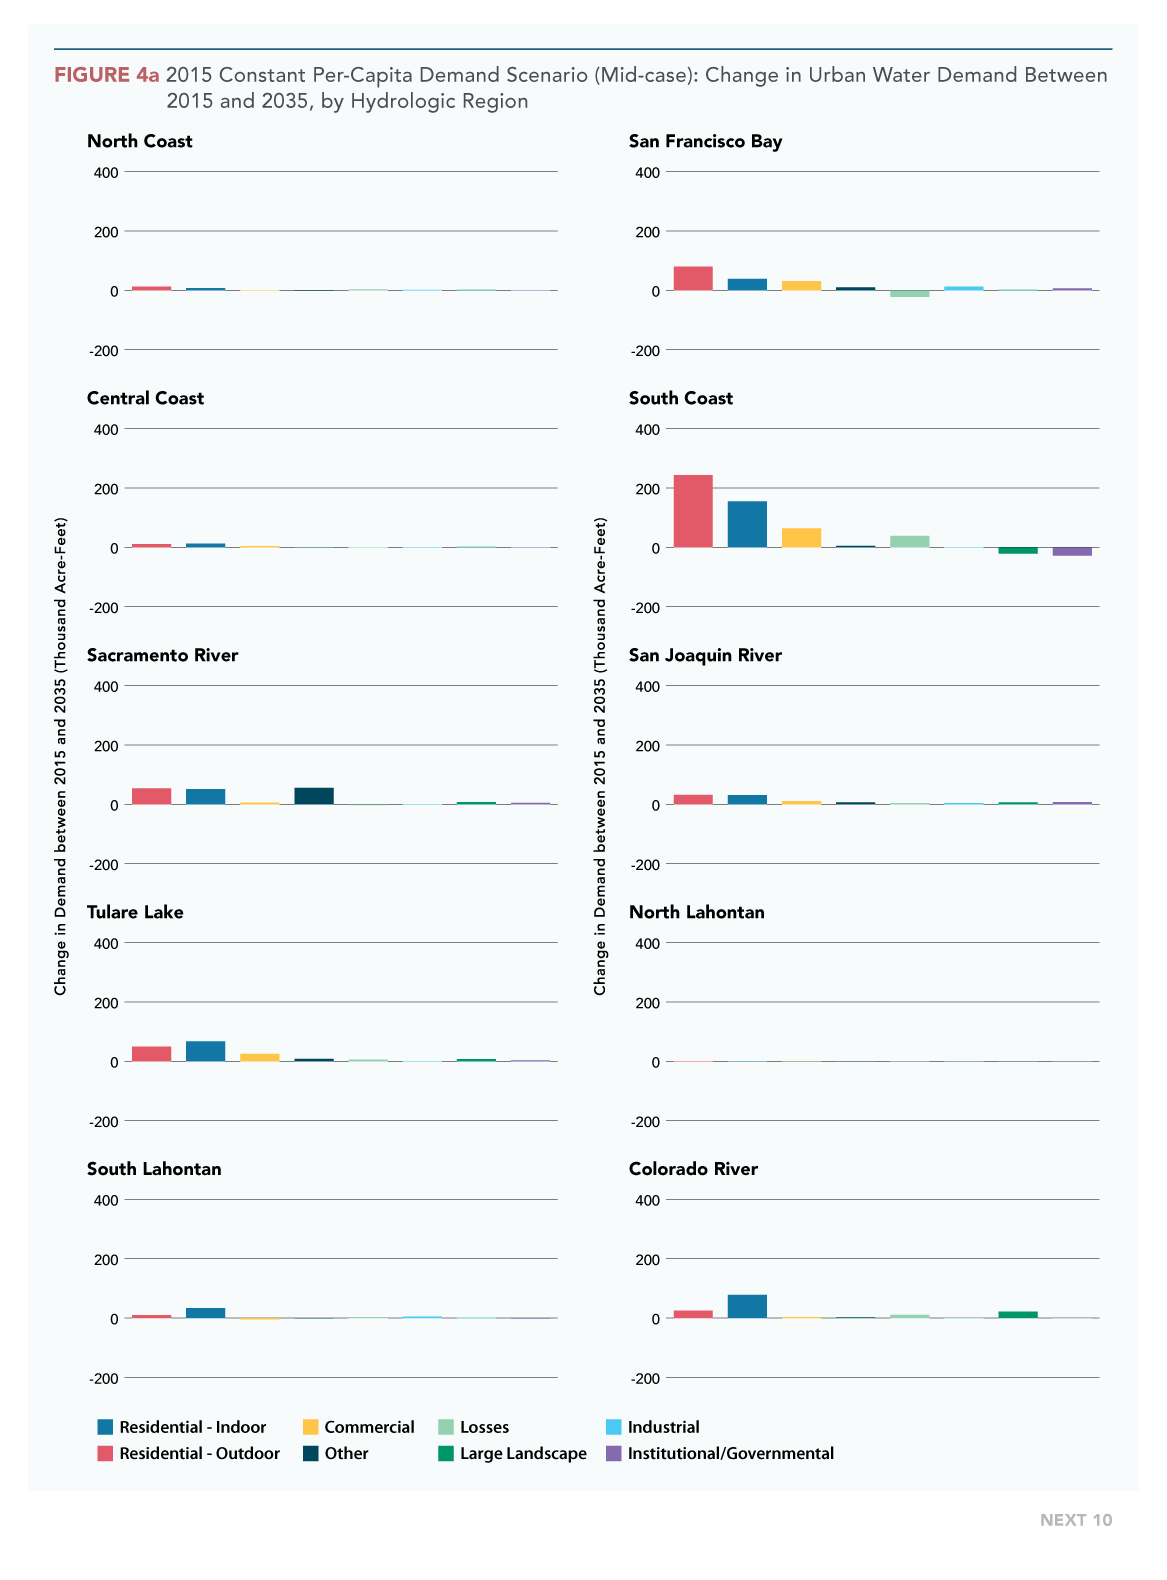
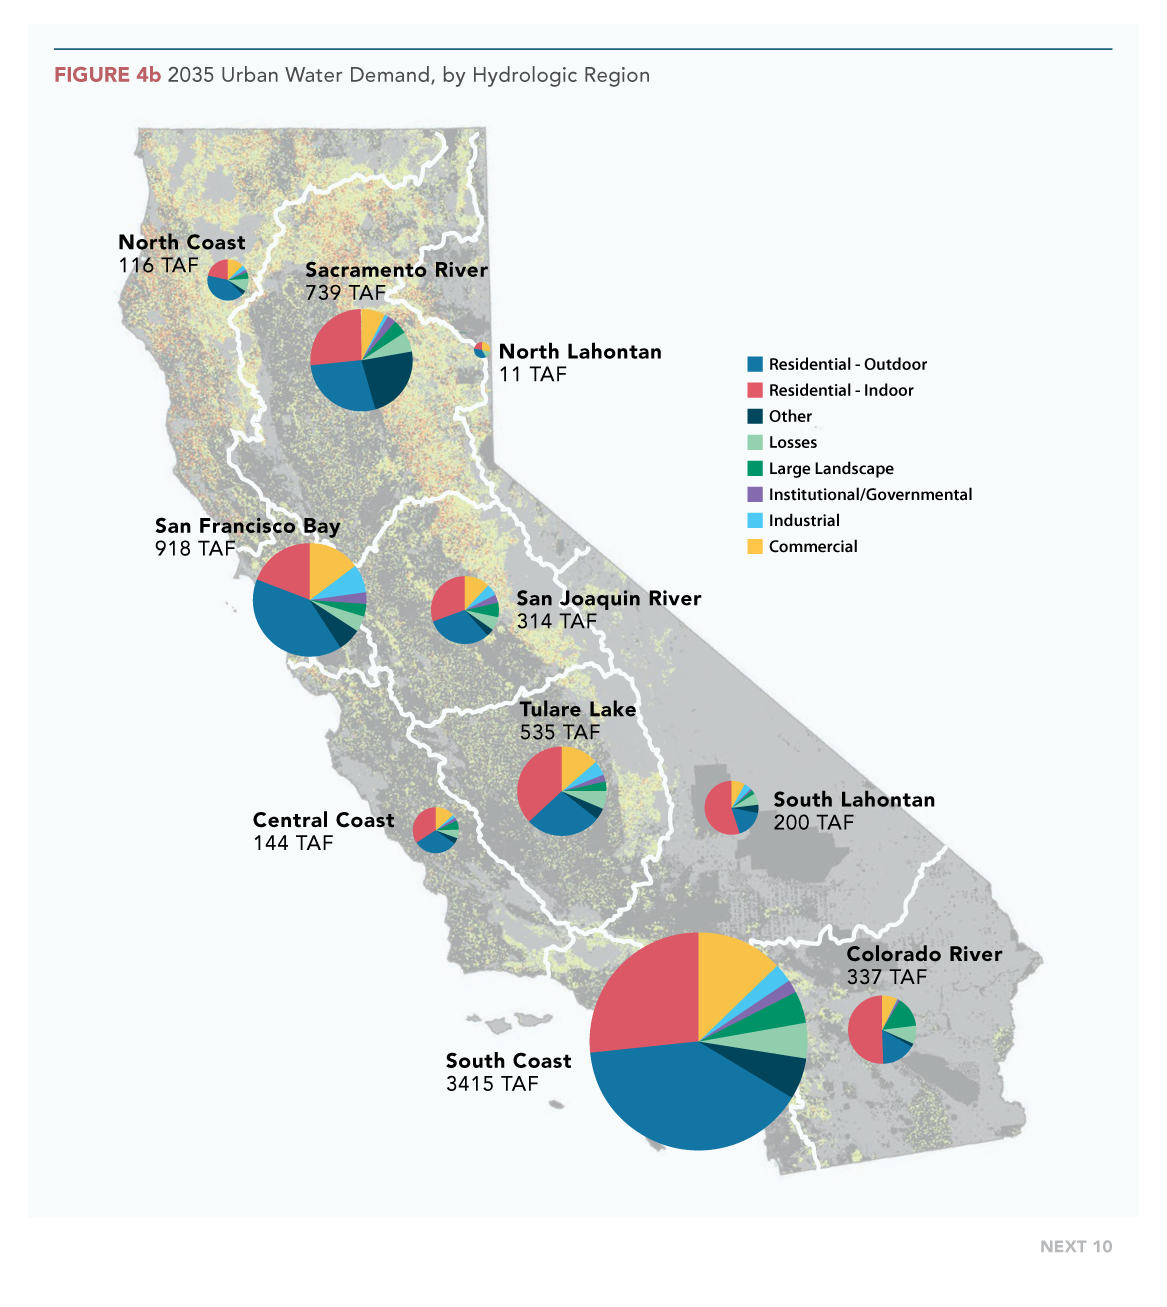
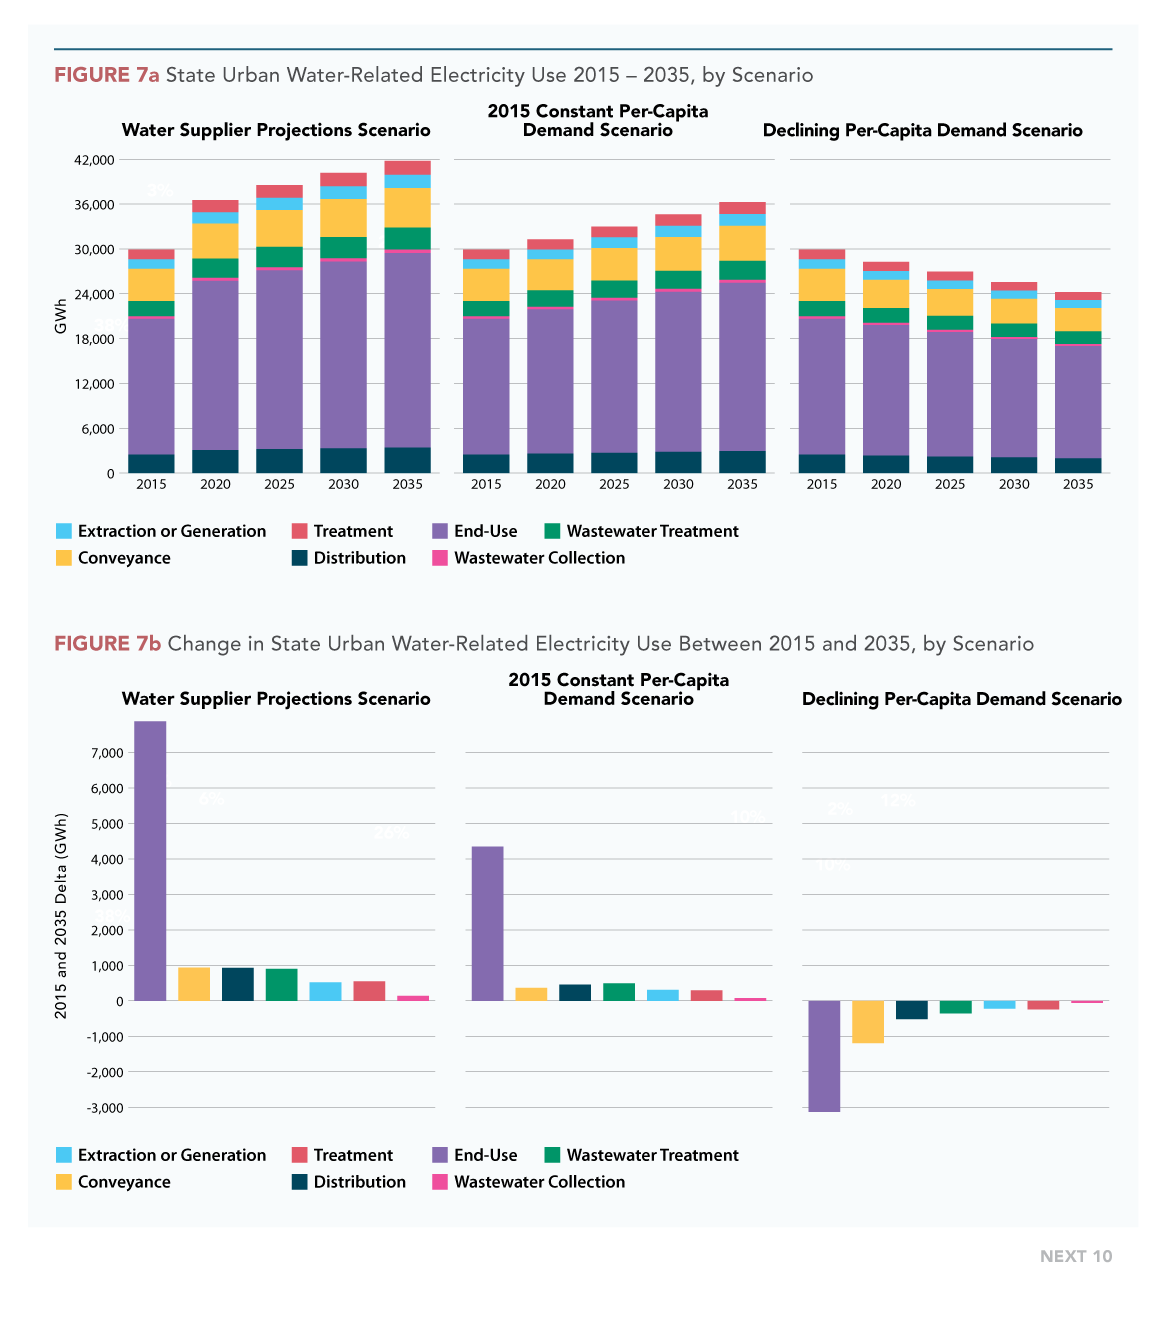
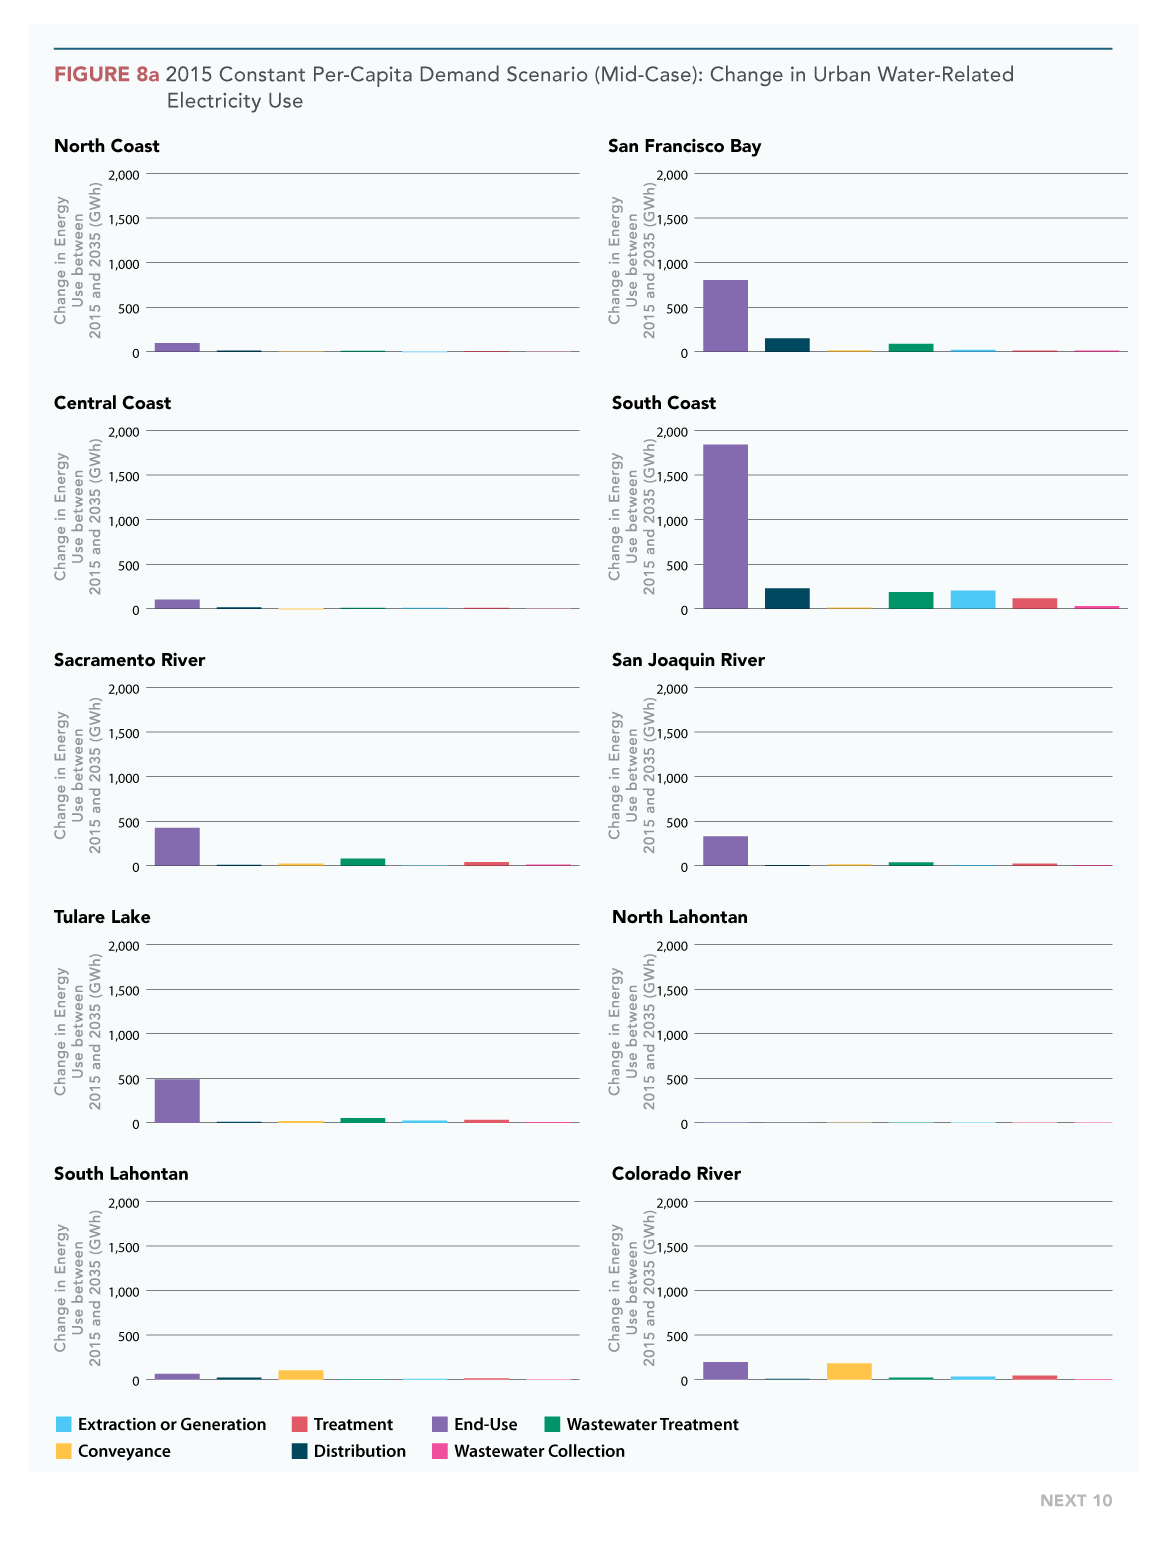
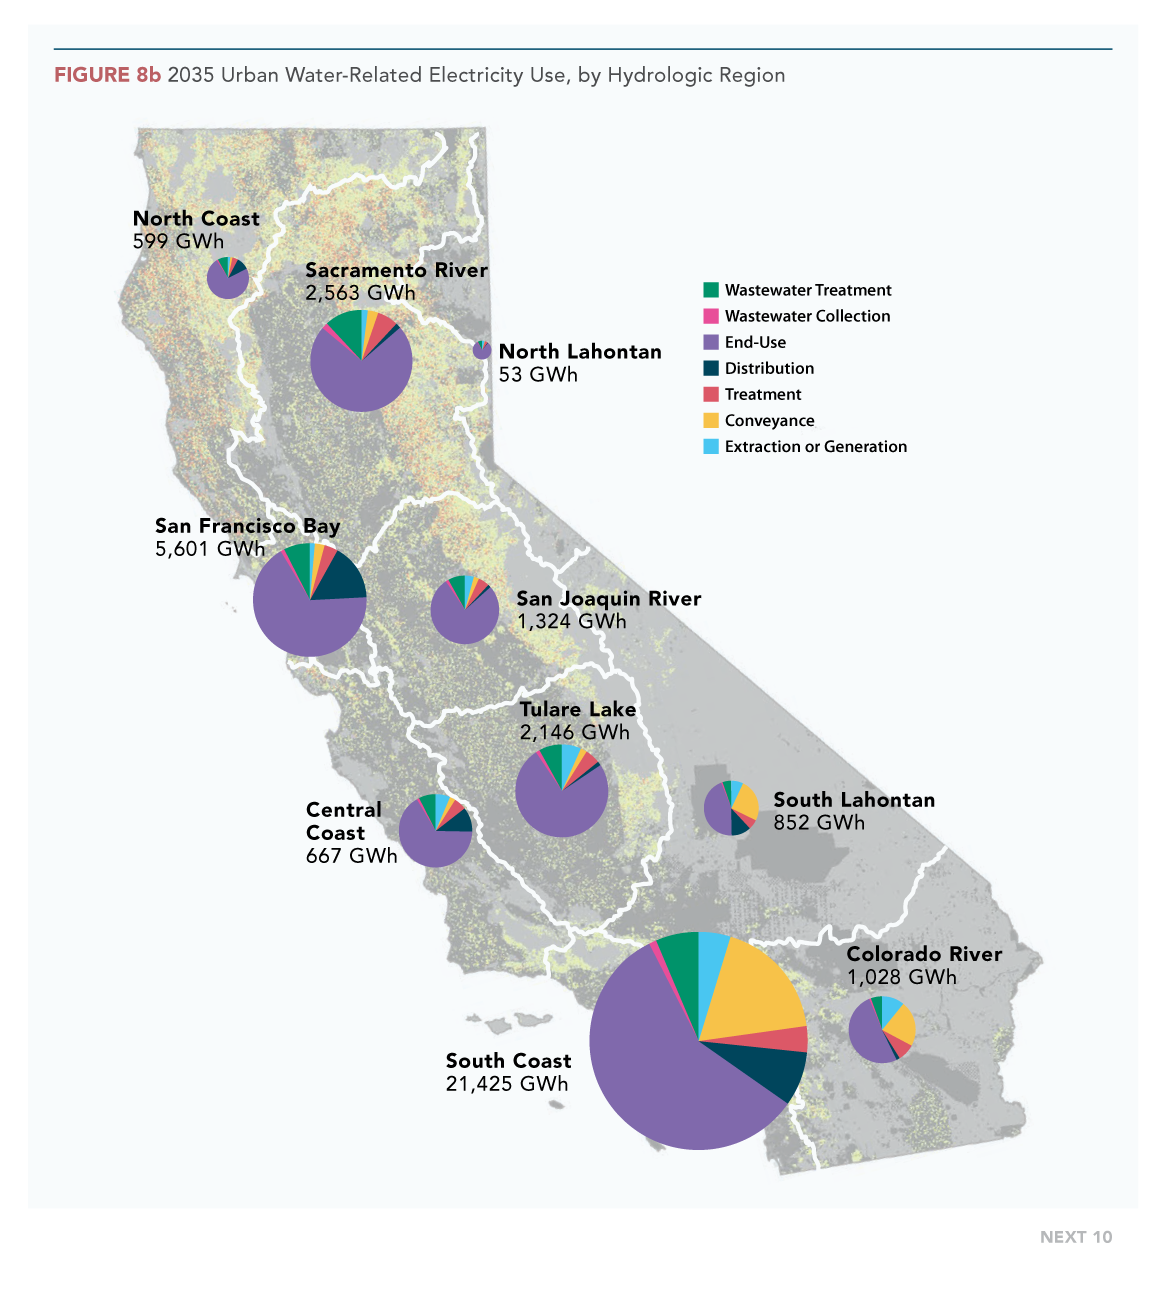
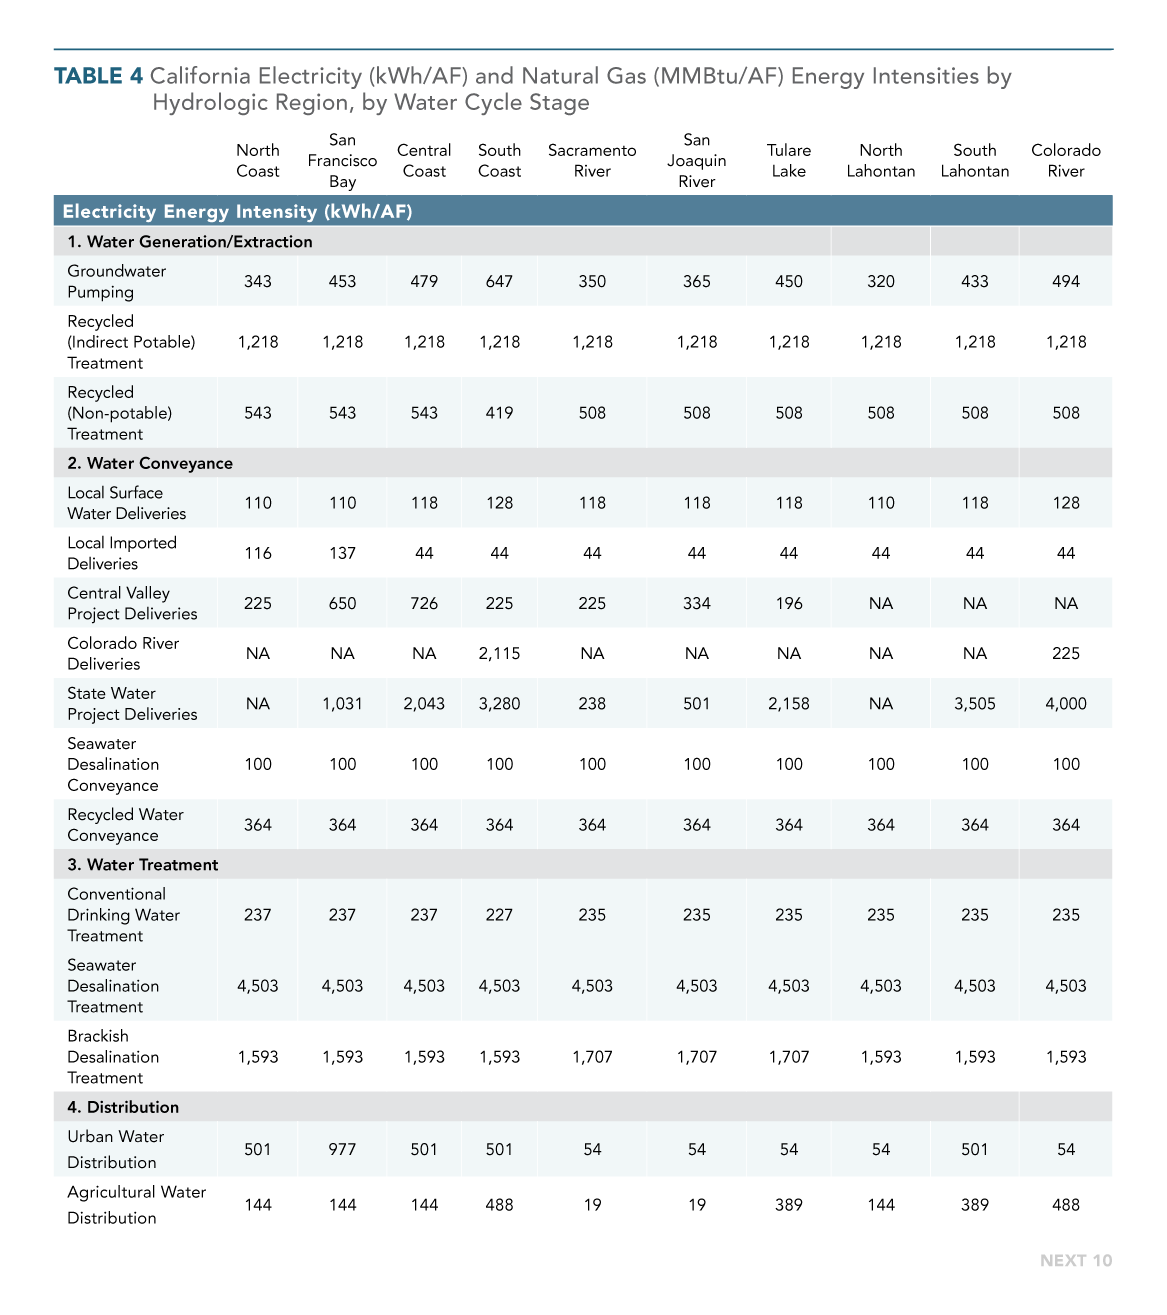
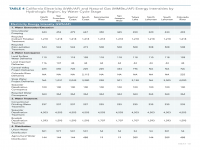
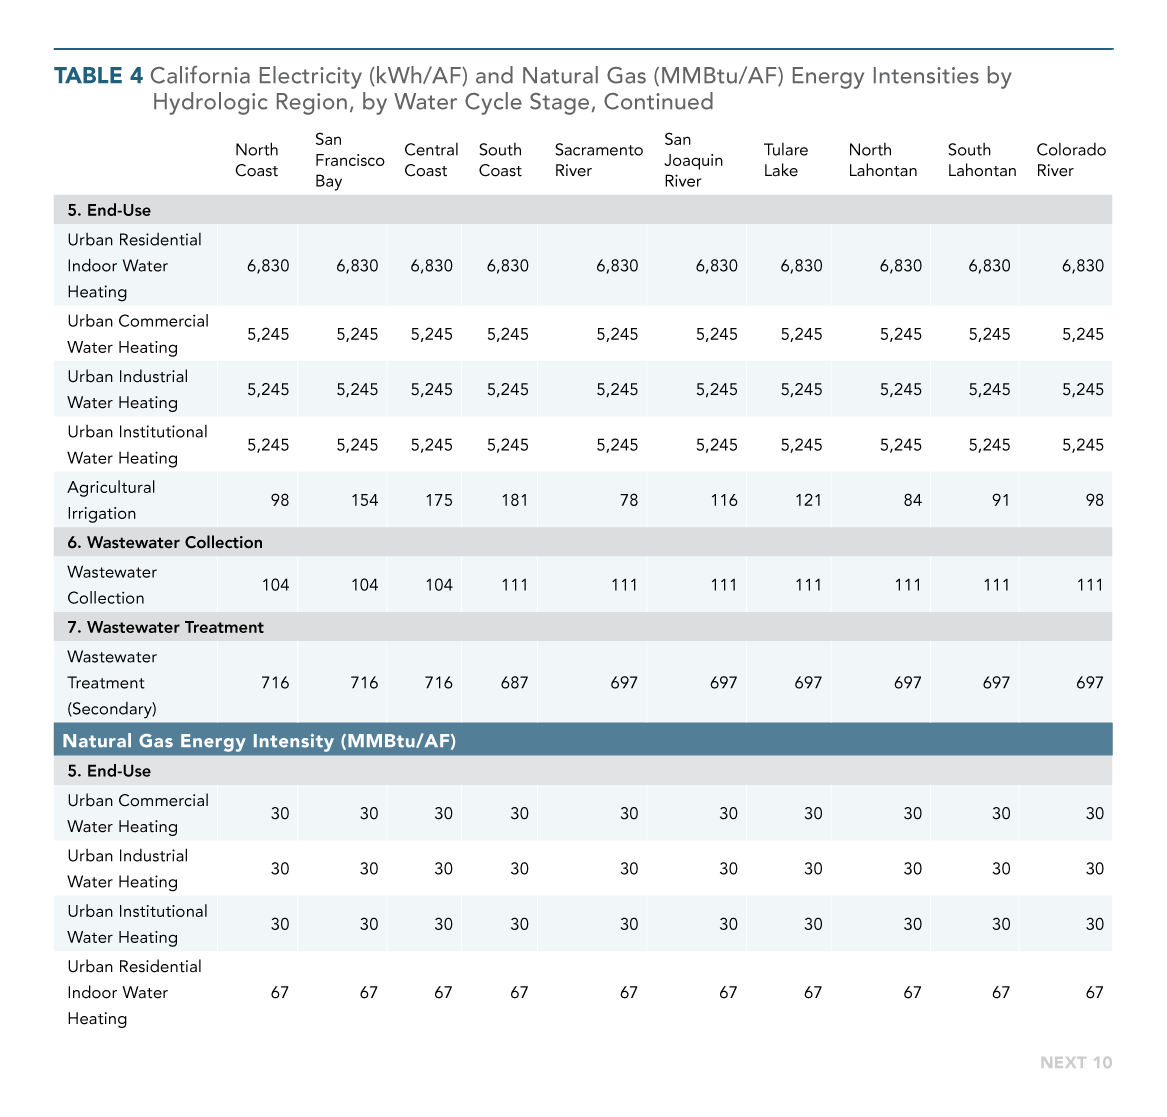
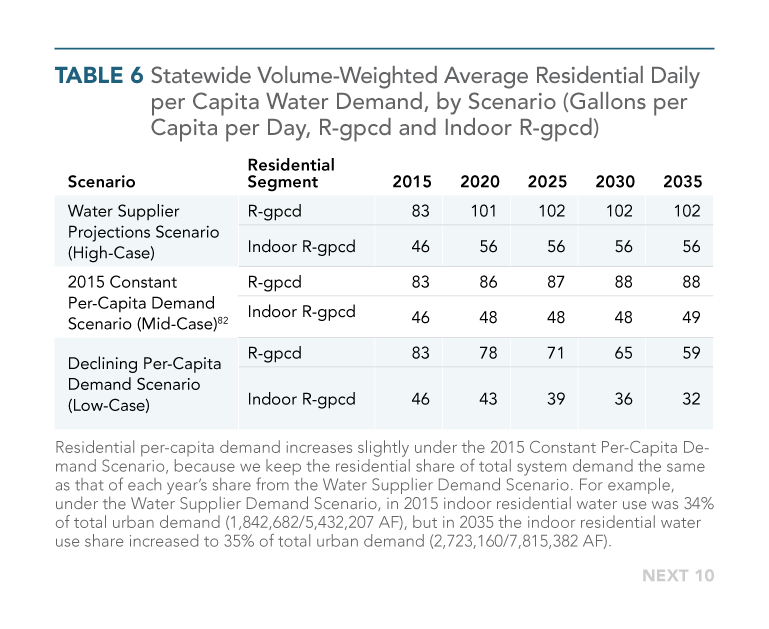
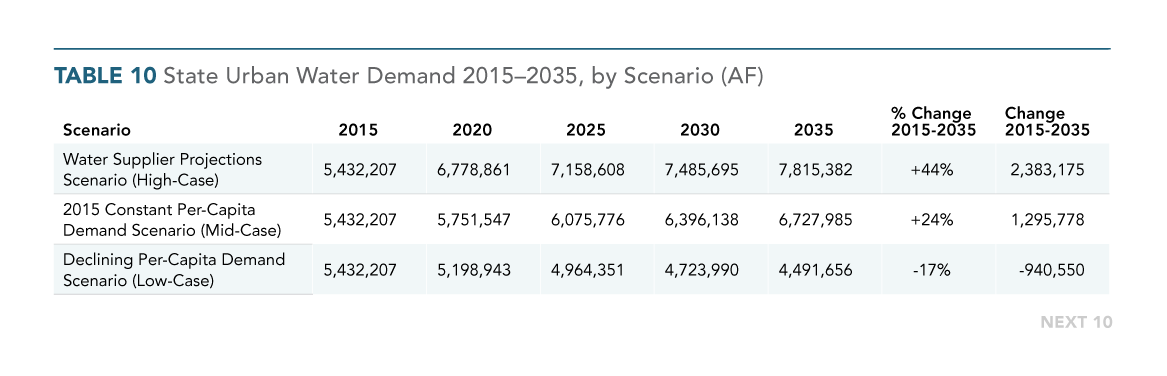
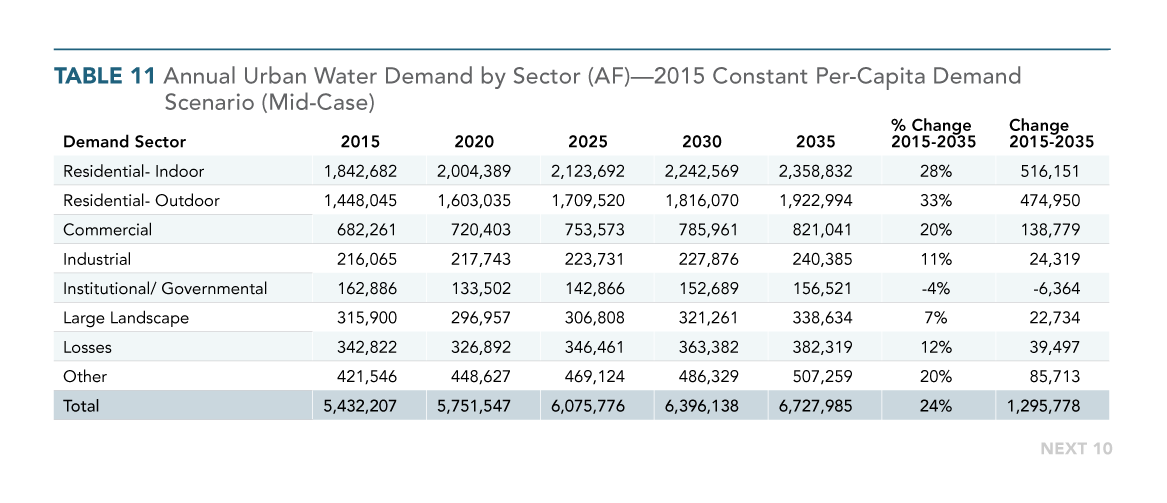
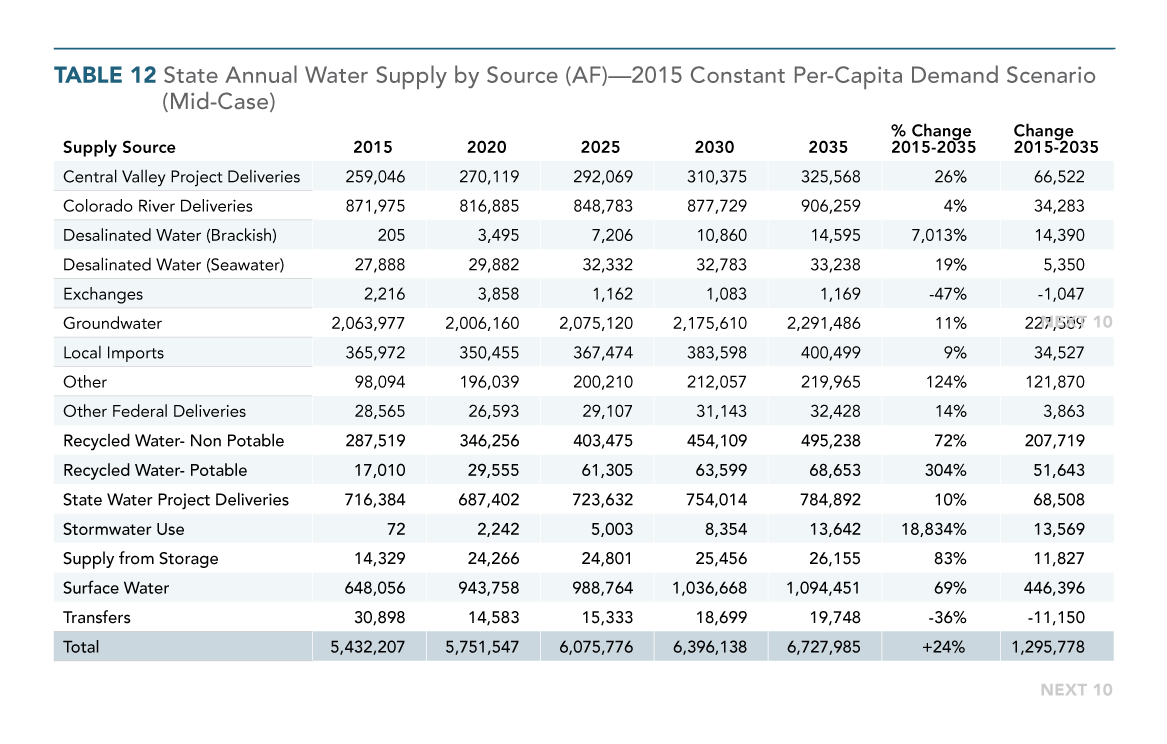
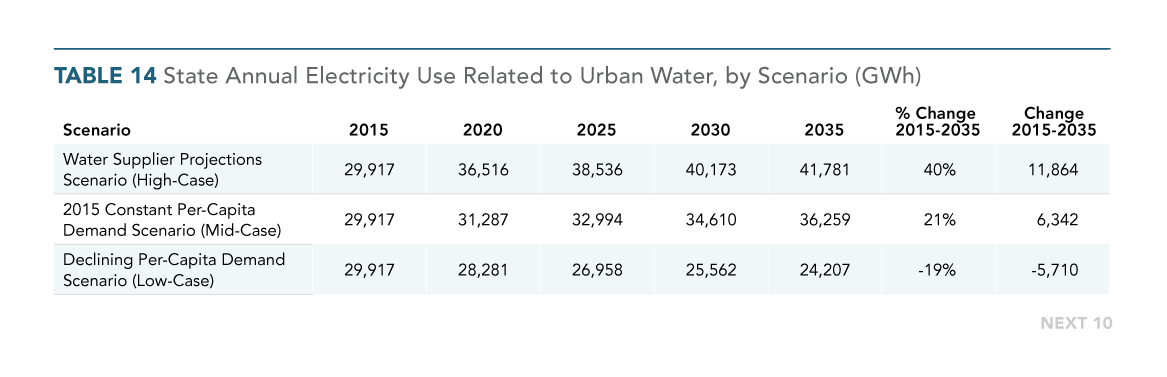
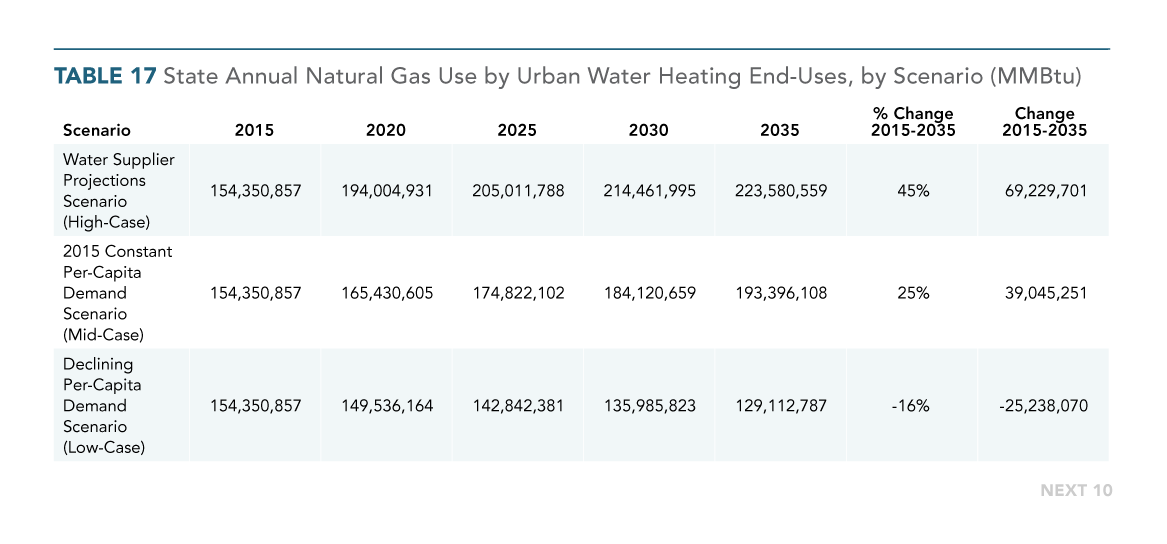
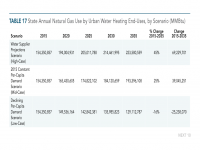
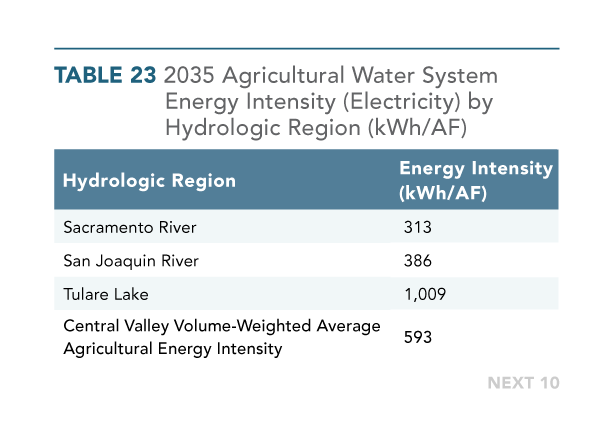
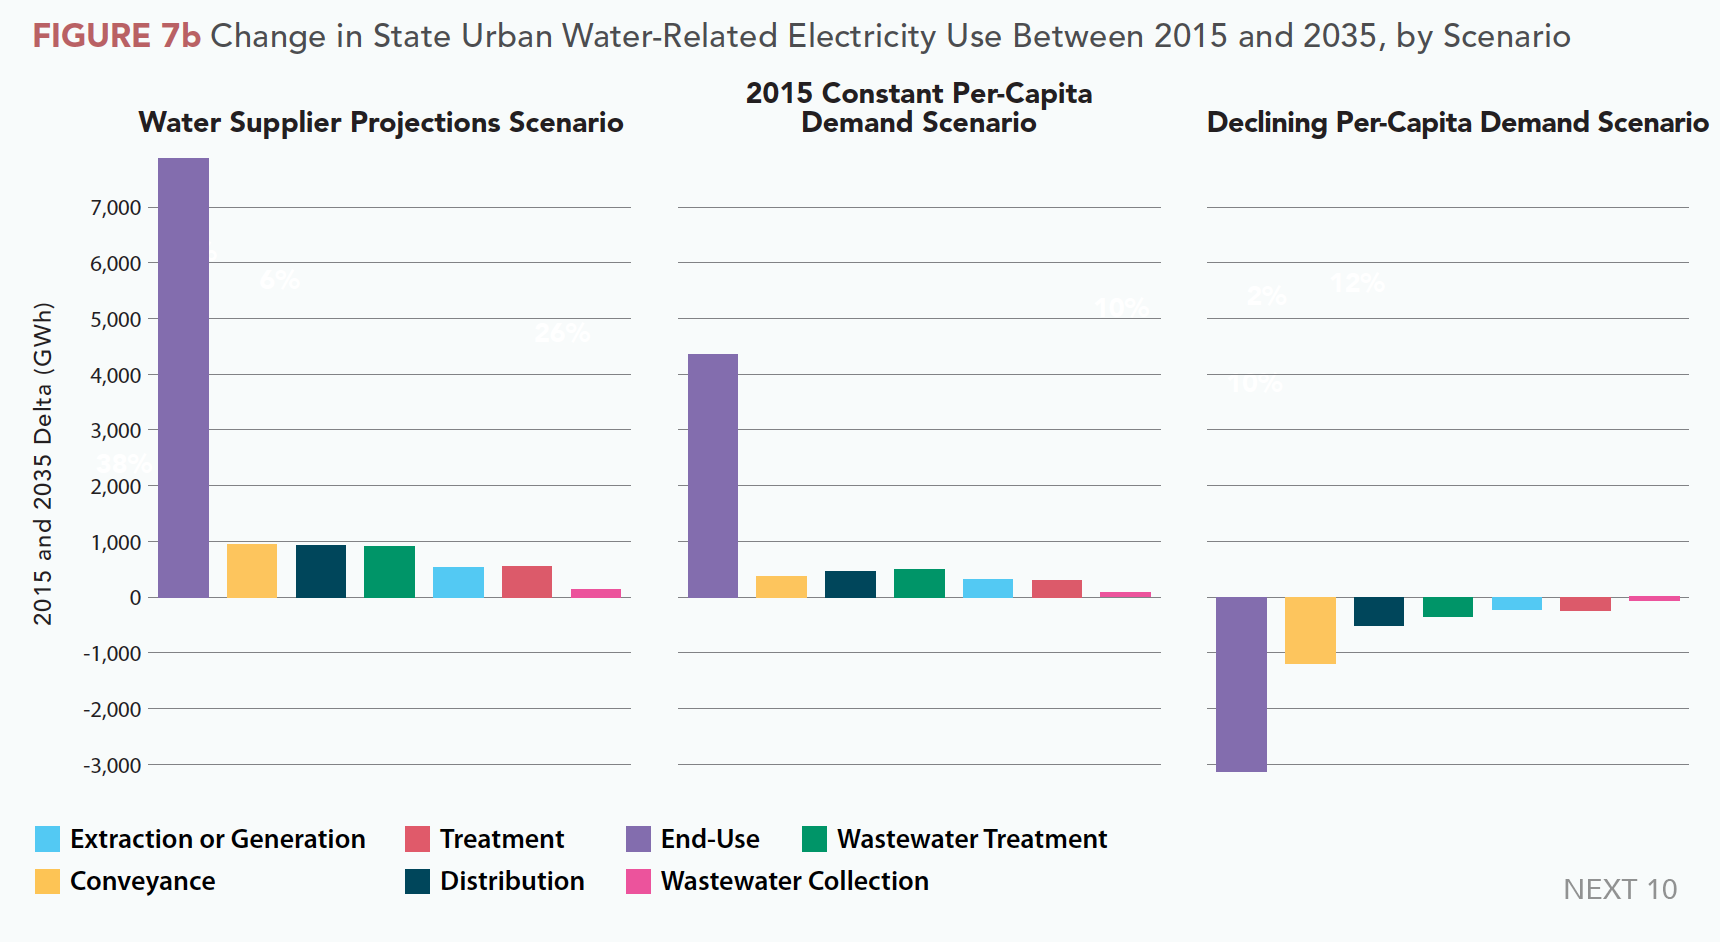
A key finding of the analysis is that measures to improve efficiency in urban water usage will have the largest beneficial impact on California’s water-related carbon emissions, as urban water is roughly twice as energy-intensive as agricultural water. If California fails to implement urban conservation measures and per-capita water demand is maintained at current levels, statewide urban water demand would increase 24 percent by 2035 with population growth, resulting in a 21 percent increase in annual water-related electricity use and a 25 percent increase in annual natural gas use. But implementing comprehensive water conservation and efficiency efforts could deliver substantial climate benefits—reducing water-related electricity usage by 19 percent, natural gas usage by 16 percent, and water-related climate emissions by 41 percent cumulatively by 2035, according to the authors.
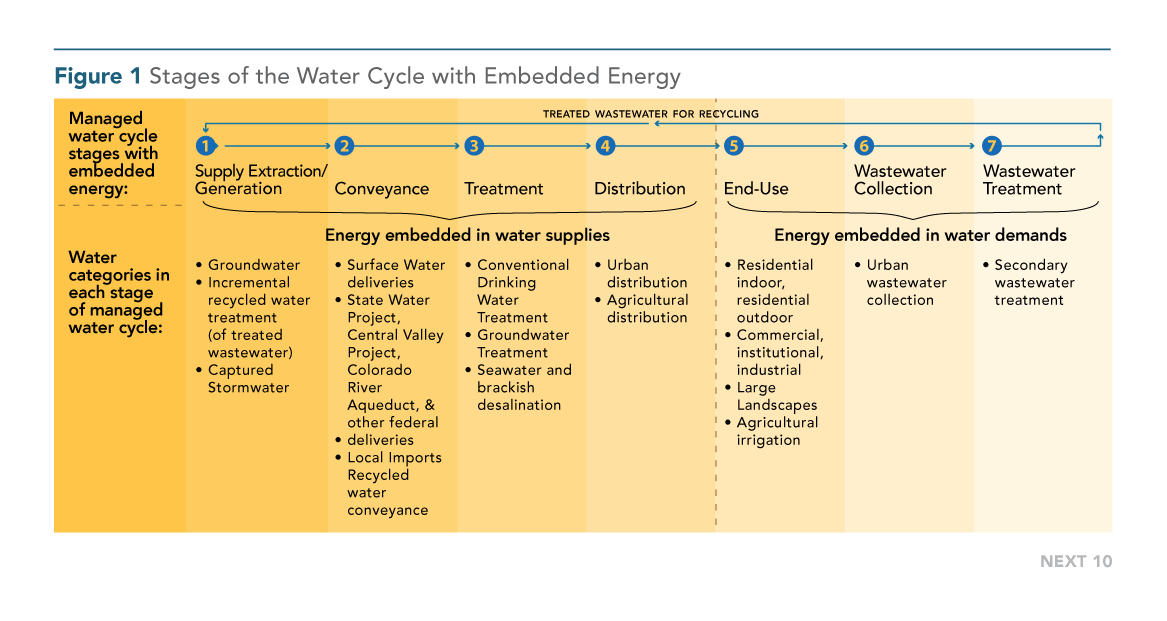
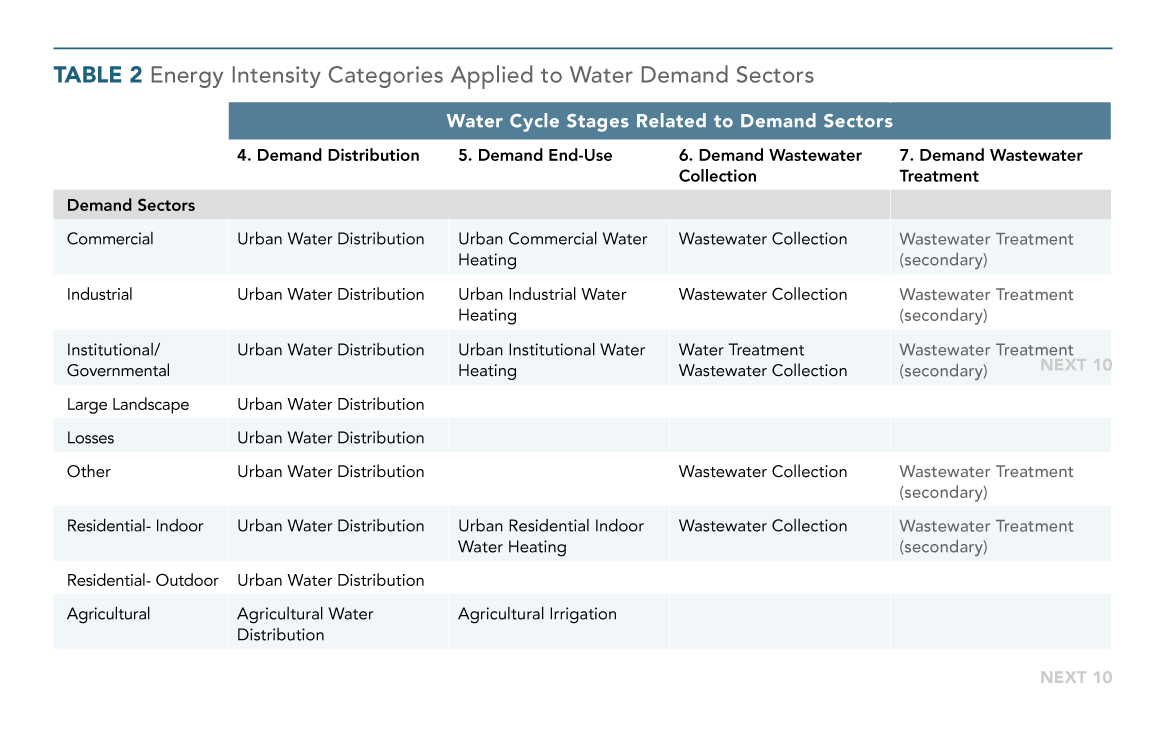
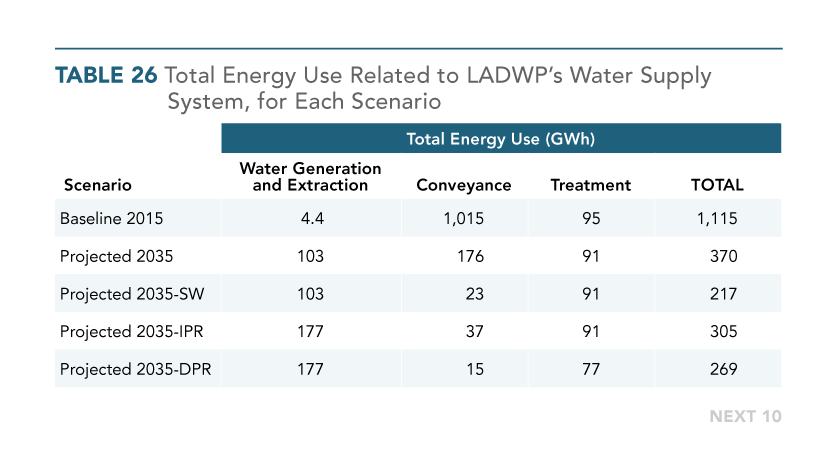
Wastewater treatment, as currently practiced, is also an energy-intensive end use of water—using nearly 1 percent of total electricity use across the country. The report identifies key opportunities to cut pollution by moving to wastewater treatment systems that have the capacity to generate renewable energy by capturing the gas from the decomposition of waste and employing it to power the treatment facility. For example, the East Bay Municipal Utility District’s wastewater treatment plant produces more renewable energy onsite than is needed to run the facility, allowing the plant to sell excess energy back to the electrical grid.
Additional water policy recommendations that could help the state meet its energy and greenhouse gas reduction goals can be found on the Key Findings tab.
Next 10 owns the rights to this publication. Any usage of content from this publication is subject to our Terms of Use.
Featured Graphics

Specific water policy recommendations include:
- Expand urban water conservation and efficiency efforts;
- Accelerate water heater electrification;
- Maintain groundwater levels and expand more flexible, high-efficiency groundwater pumps;
- Provide financial incentives and regulatory pathways for water suppliers to invest in less energy- and greenhouse gas-intensive water systems, including through existing financial incentives and programs for energy efficiency and greenhouse gas reduction;
- Expand and standardize water data reporting and energy usage tracking; and
- Formalize coordination between water and energy regulatory agencies about forecasted energy demand changes.
Next 10 owns the copyright to all graphics in this section, and they are available for download and limited use, subject to our Terms of Use. Please contact Next 10 at info@next10.org with any questions.


