Publications
The Road Ahead for Zero-Emission Vehicles in California: Market Trends & Policy Analysis
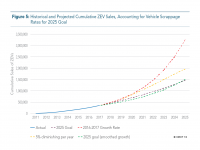
New analysis of California ZEV market finds state will meet or exceed 1.5 million by 2025 goal, and S-curve adoption is happening but charging infrastructure not keeping pace.
The Road Ahead for Zero-Emission Vehicles in California: Market Trends & Policy Analysis analyzes California's zero-emission vehicle (ZEV) market, including historic sales, costs, technology trends, forecasts and challenges. It also reviews policies and implications that could affect future market growth.
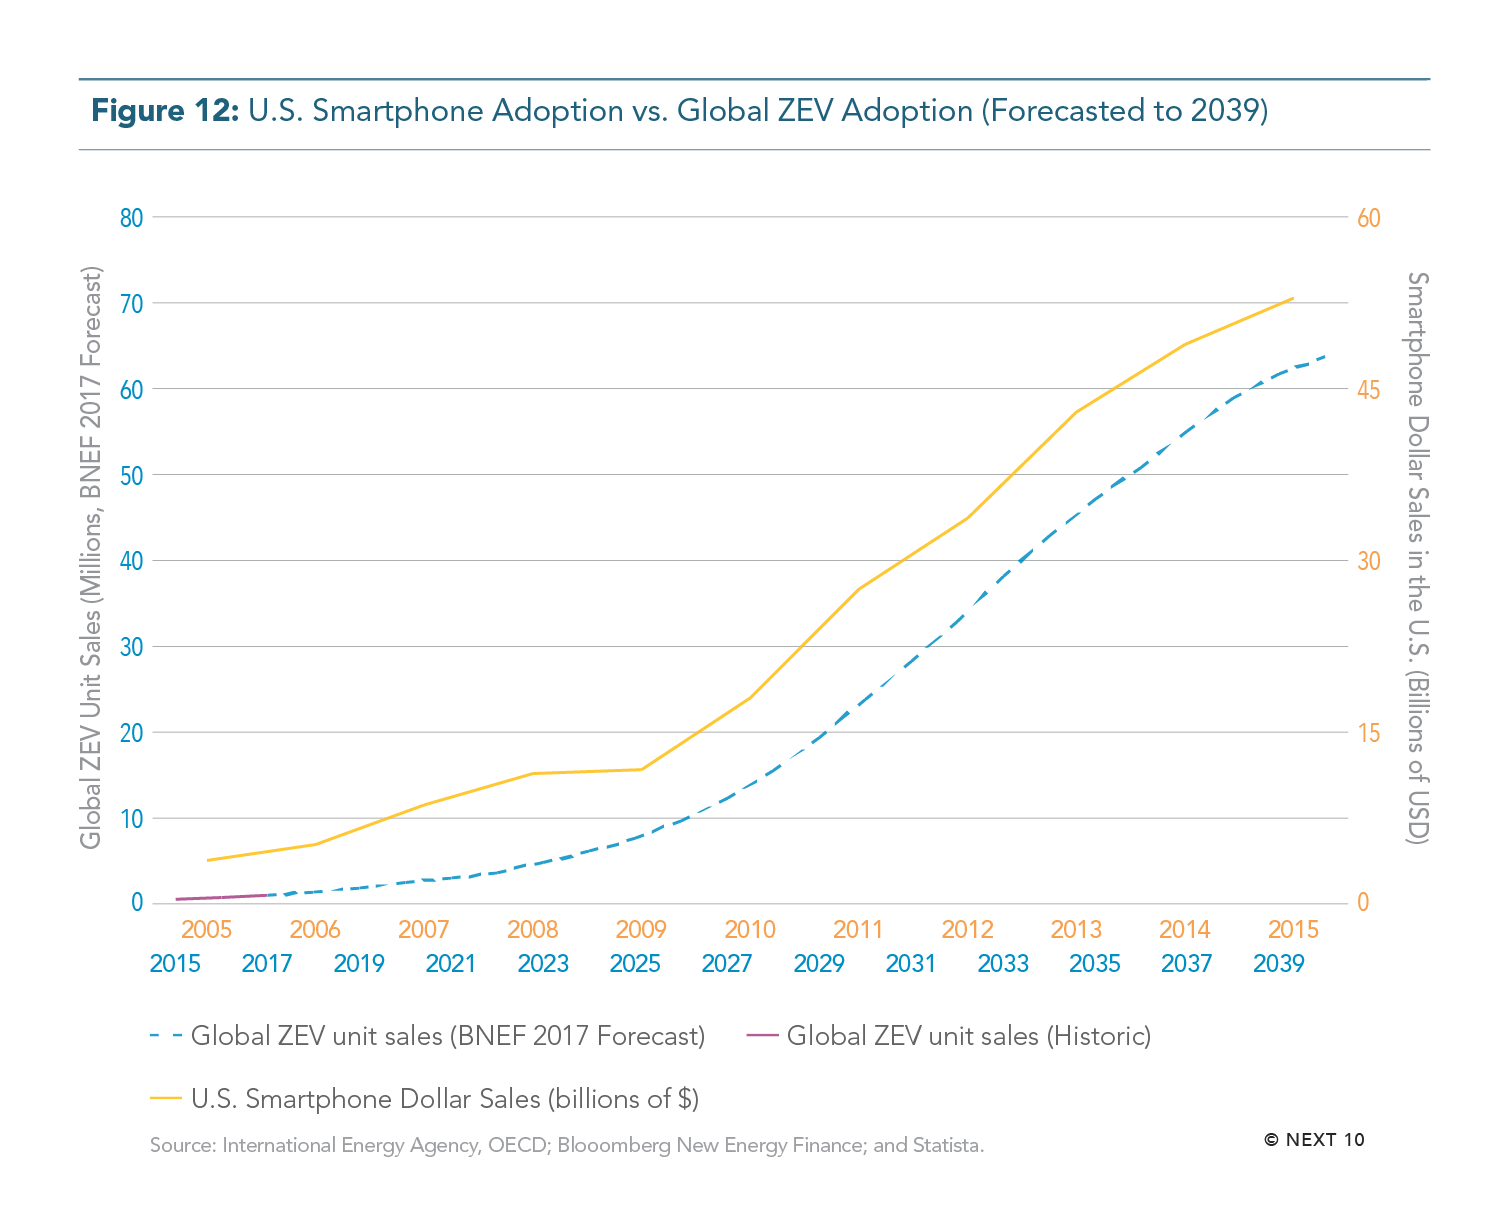
The report finds that ZEV adoption isn't just accelerating in California, and as of October 2017, 337,483 ZEVs had been sold in California. In 2017, global passenger electric vehicle sales reached about 1 million, up from half a million in 2015. Looking ahead, the report finds that electric vehicles could be as ubiquitous in 2040 as smartphones are today.
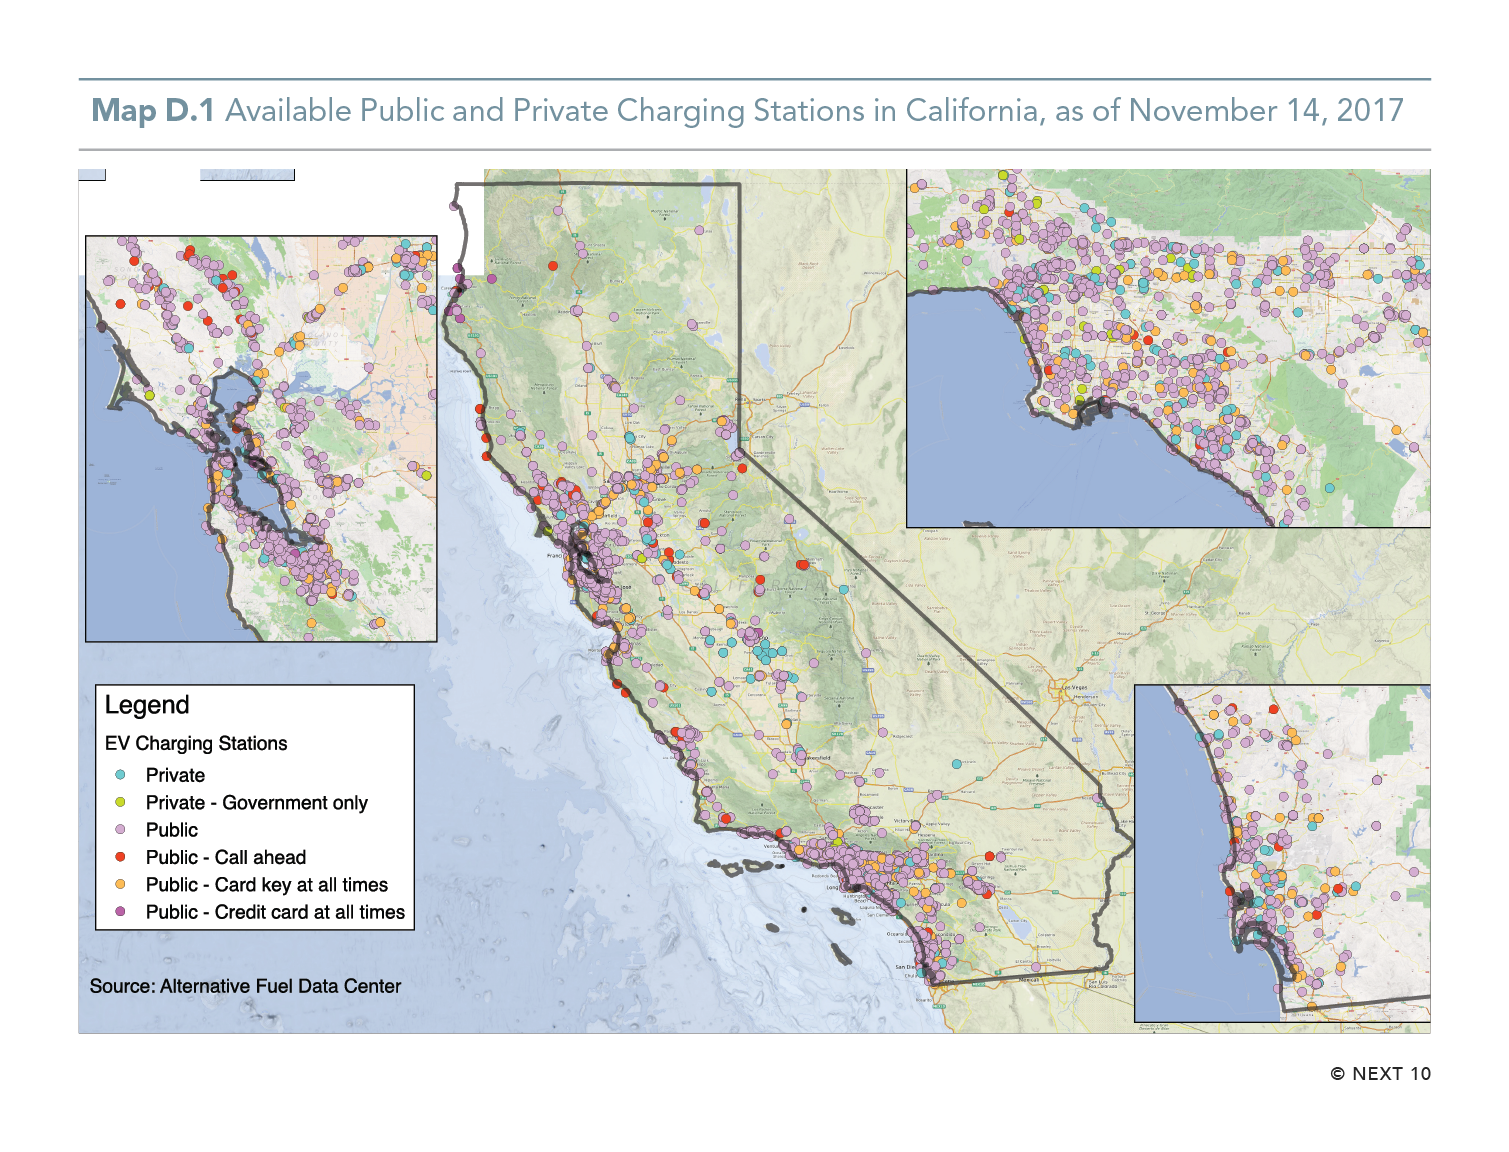
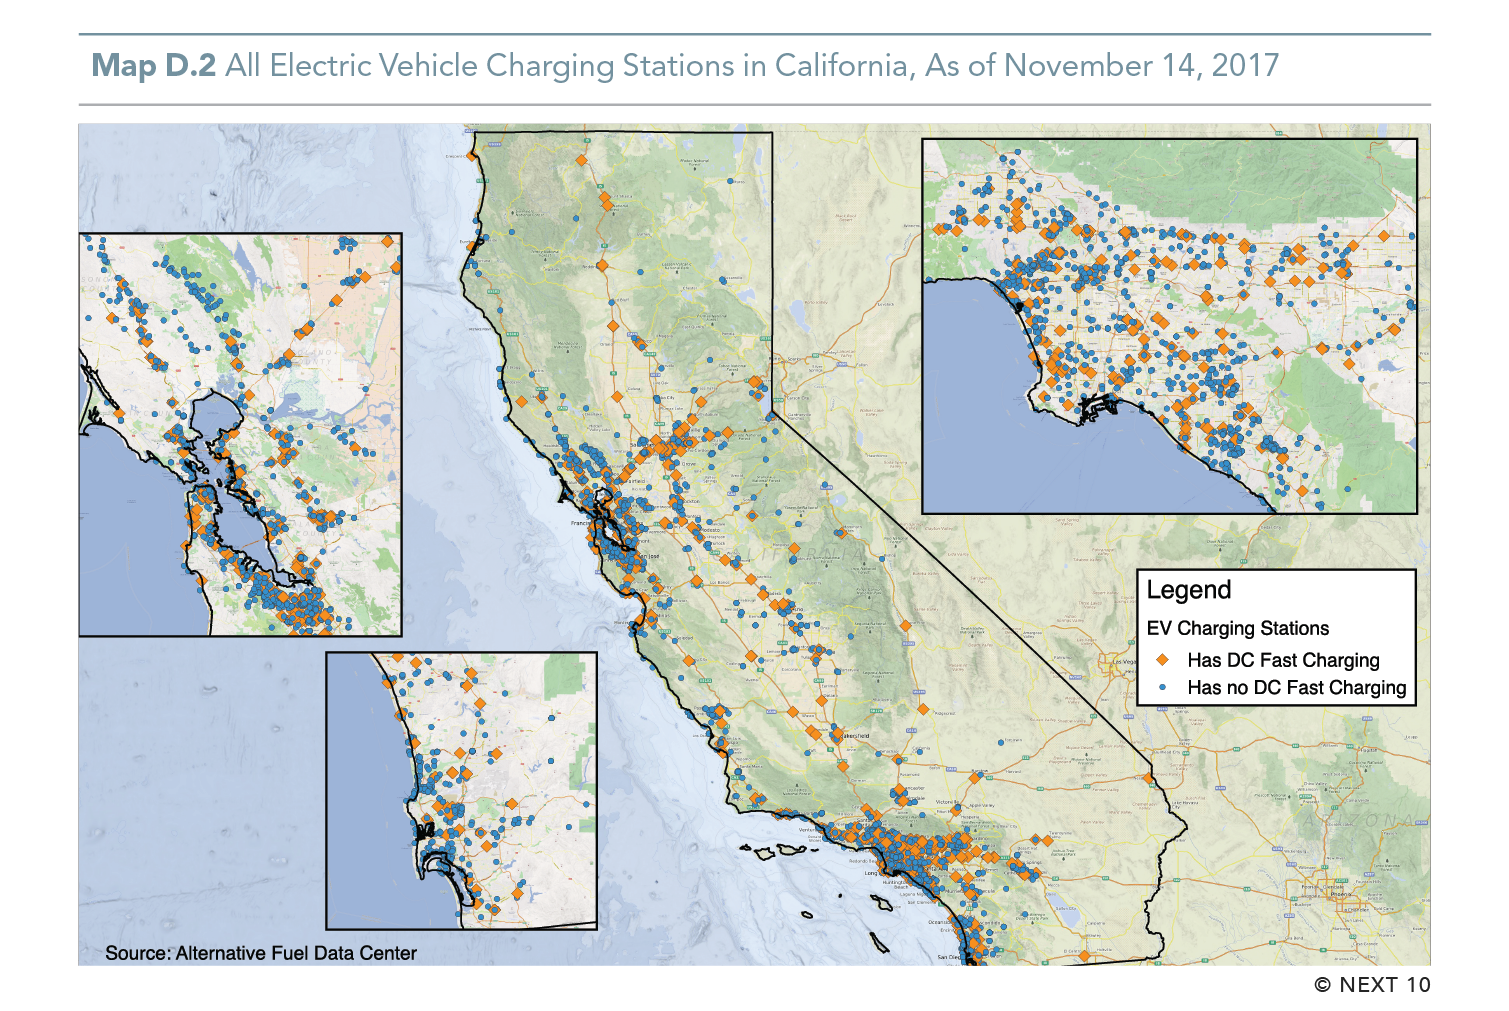
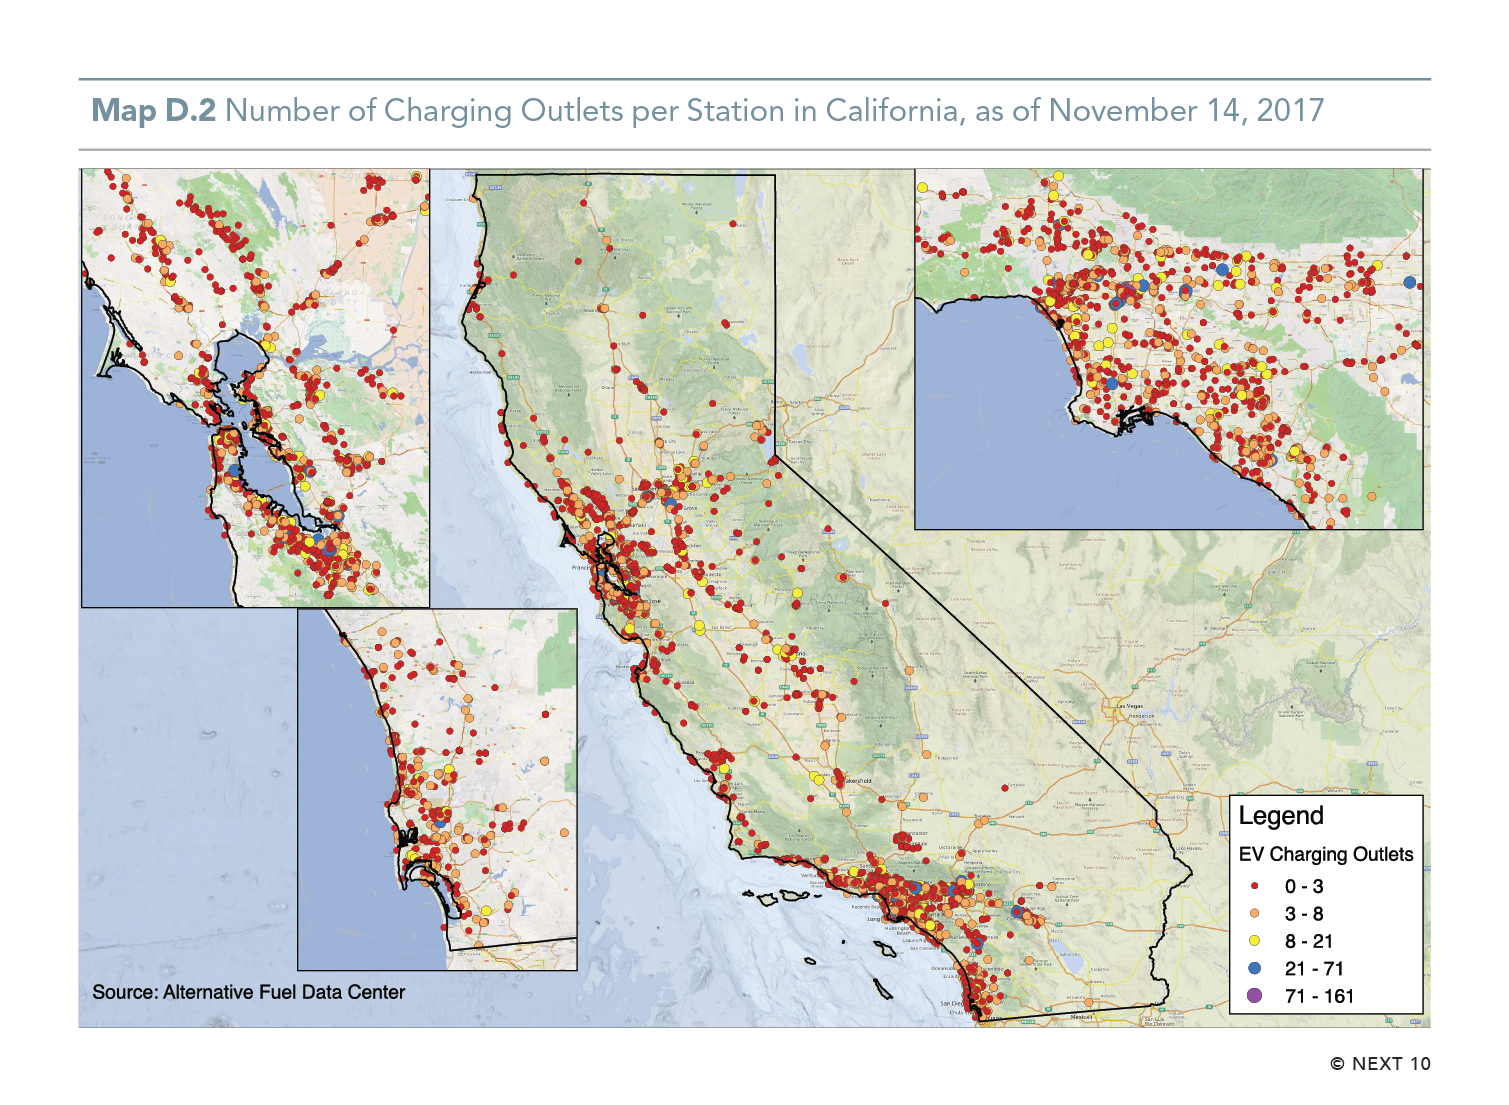
However, California is lagging behind when it comes to ensuring its charging infrastructure keeps pace with the growth of its electric vehicle fleet. California has 16,549 public and nonresidential private-sector charging outlets—most in the nation by far but only 0.05 public charging outlets per ZEV. Studies show that California will need 125,000 to 220,000 charging ports from private and public sources by 2020 in order to provide adequate infrastructure. Growth in ZEVs could be inhibited if charging infrastructure doesn't keep pace.
Next 10 owns the rights to this publication. Any usage of content from this publication is subject to our Terms of Use.
Highlights of the report include:
California's ZEV leadership
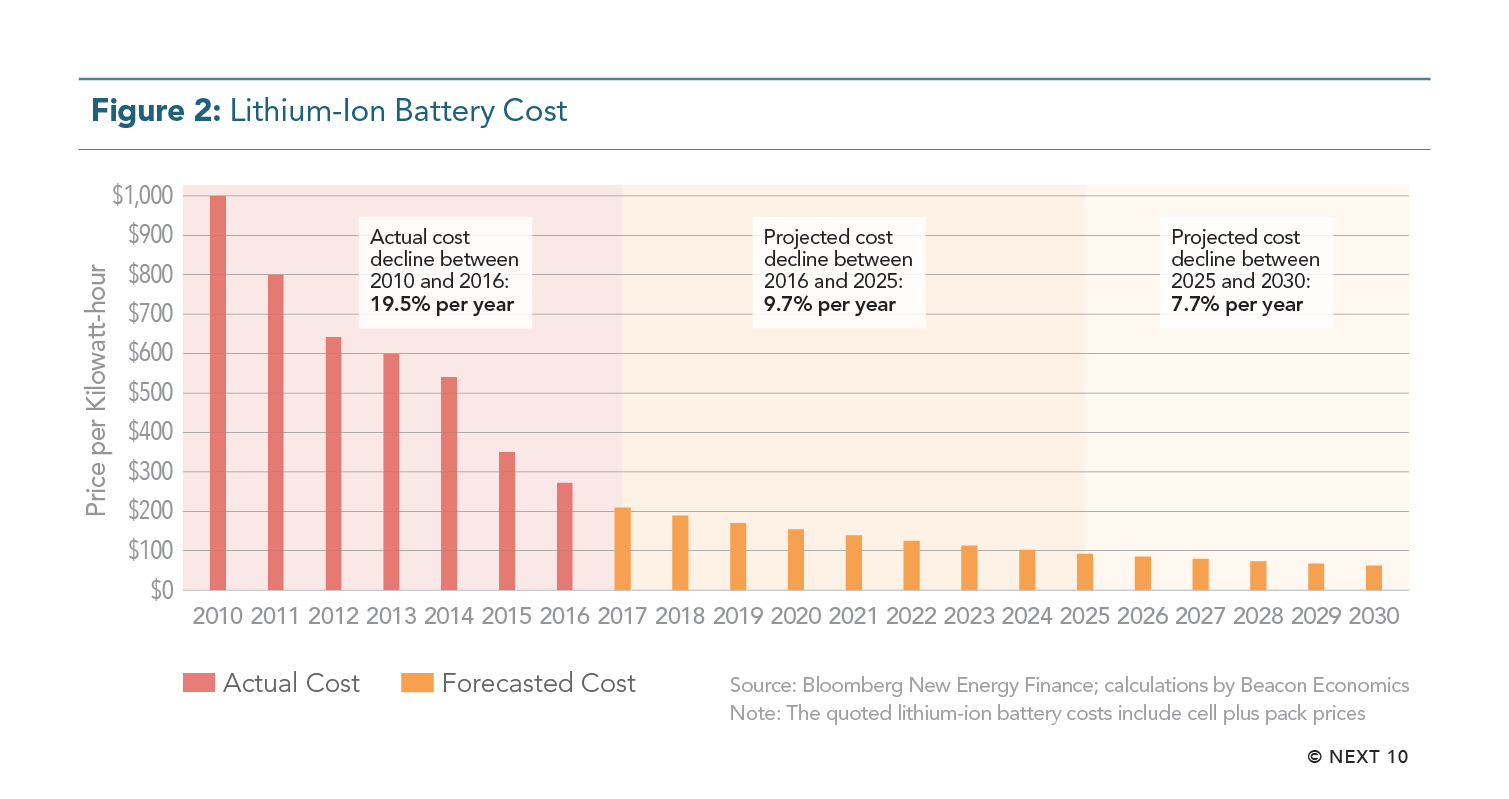
- 2017 California ZEV sales increased 29.1 percent over 2016, while U.S. ZEV sales grew by 28.8 percent over the same time period.
- The increases are based on sales data from January through October for 2016 and 2017, as confirmed sales data for the last two months of 2017 is not yet available.
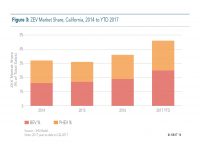
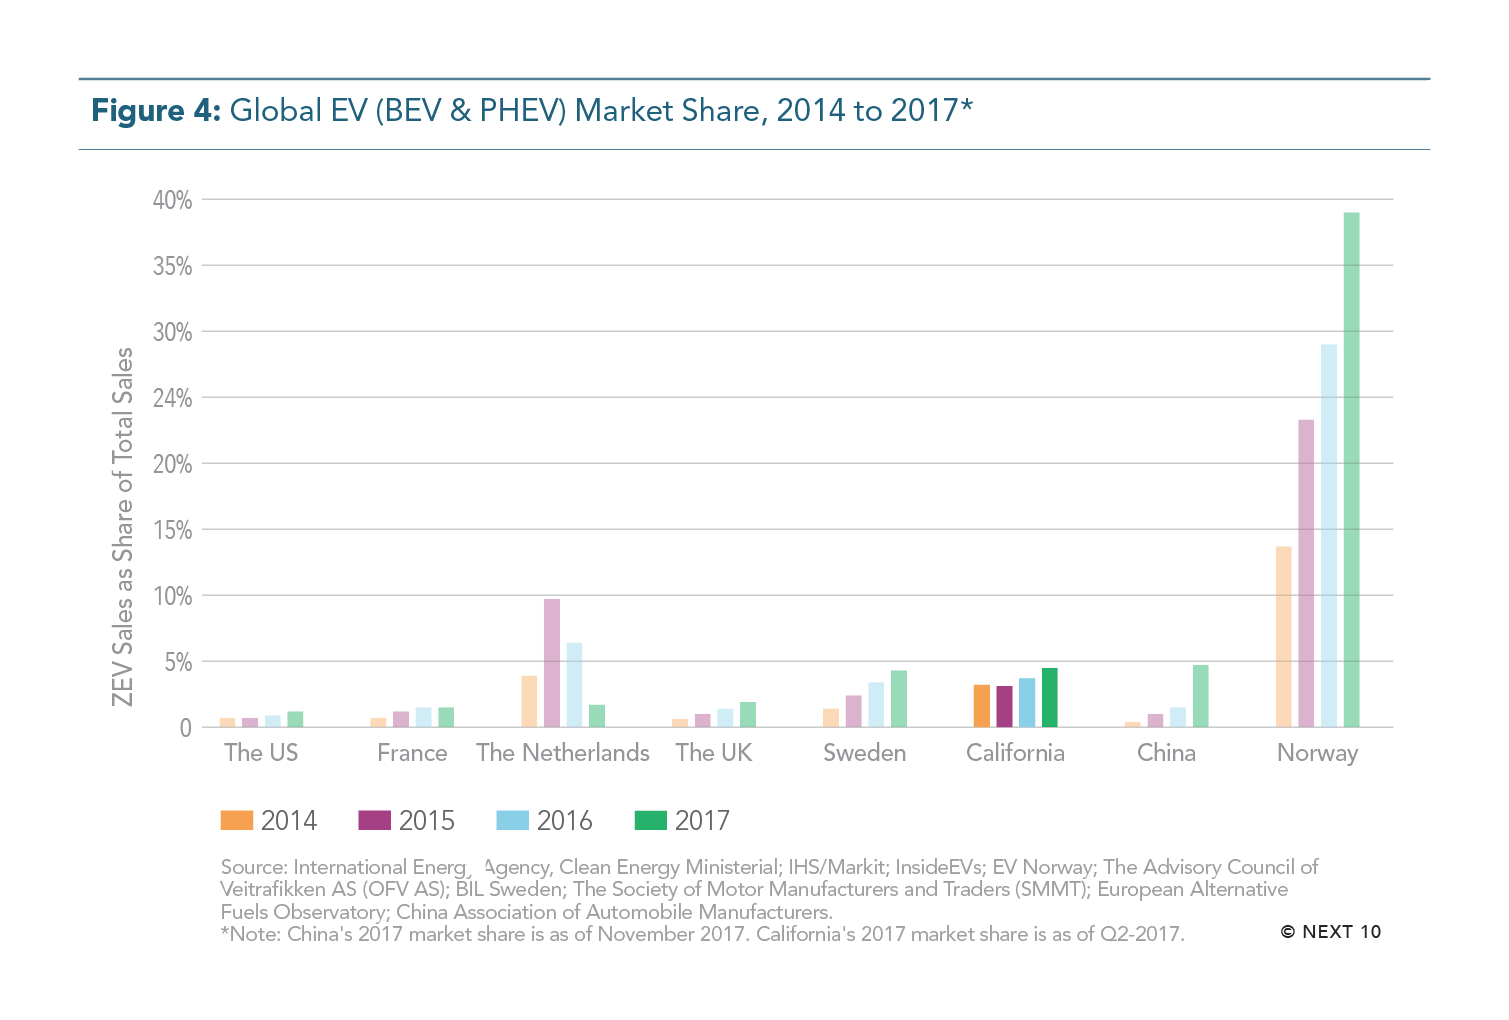
- ZEV market share (ZEVs as a share of the total auto market) in California was 4.5 percent in 2017, up from 2.6 percent in 2016.
- This compares to 2017 ZEV market share of 1.1 percent in the U.S. and 1.8 percent in China.
- When the state's ZEV goal was enacted in 2012, California needed to average 35.5 percent annual growth from 2013 to 2025 in order to meet its goal.
- Given the 53 percent increase in growth from 2013 to 2017, the annual growth rate required to meet the ZEV goal has decreased to 20 percent annually.
China's ZEV leadership
- China leads the world in ZEV sales.
- Sales of EVs increased 70 percent from 2015 to 2016 with cumulative EV sales reaching 650,000, overtaking the U.S. in cumulative sales for the first time.
- China's intention to achieve 20 percent ZEV penetration by 2025 means it will add 7 million vehicles a year.
Market Trends
Factors driving acceleration or deceleration of ZEV adoption include price, performance, choice, convenience, and public policy. Current trends suggest that barriers to EV adoption such as price, range, selection, and charging-time will continue to diminish, as costs come down and technology improves.
- Total Cost of Ownership:
- An analysis of 17 popular 2017 models found ZEVs can already be price-competitive without government incentives
- Based on 12,330 miles driven per year, the pure battery electric Nissan Leaf has lower five-year and 10-year life cycle costs than the internal combustion Hyundai Elantra and the plug-in hybrid Chevrolet Volt, even without the federal government incentive.
- The average Californian drives 14,435 miles every year. Accounting for mileage and state and federal incentives, the smart fortwo ED and the Nissan Leaf have the lowest total cost of ownership of any of the 17 models studied, which include both ZEVs and internal combustion engine (ICE) vehicles.
- Price:
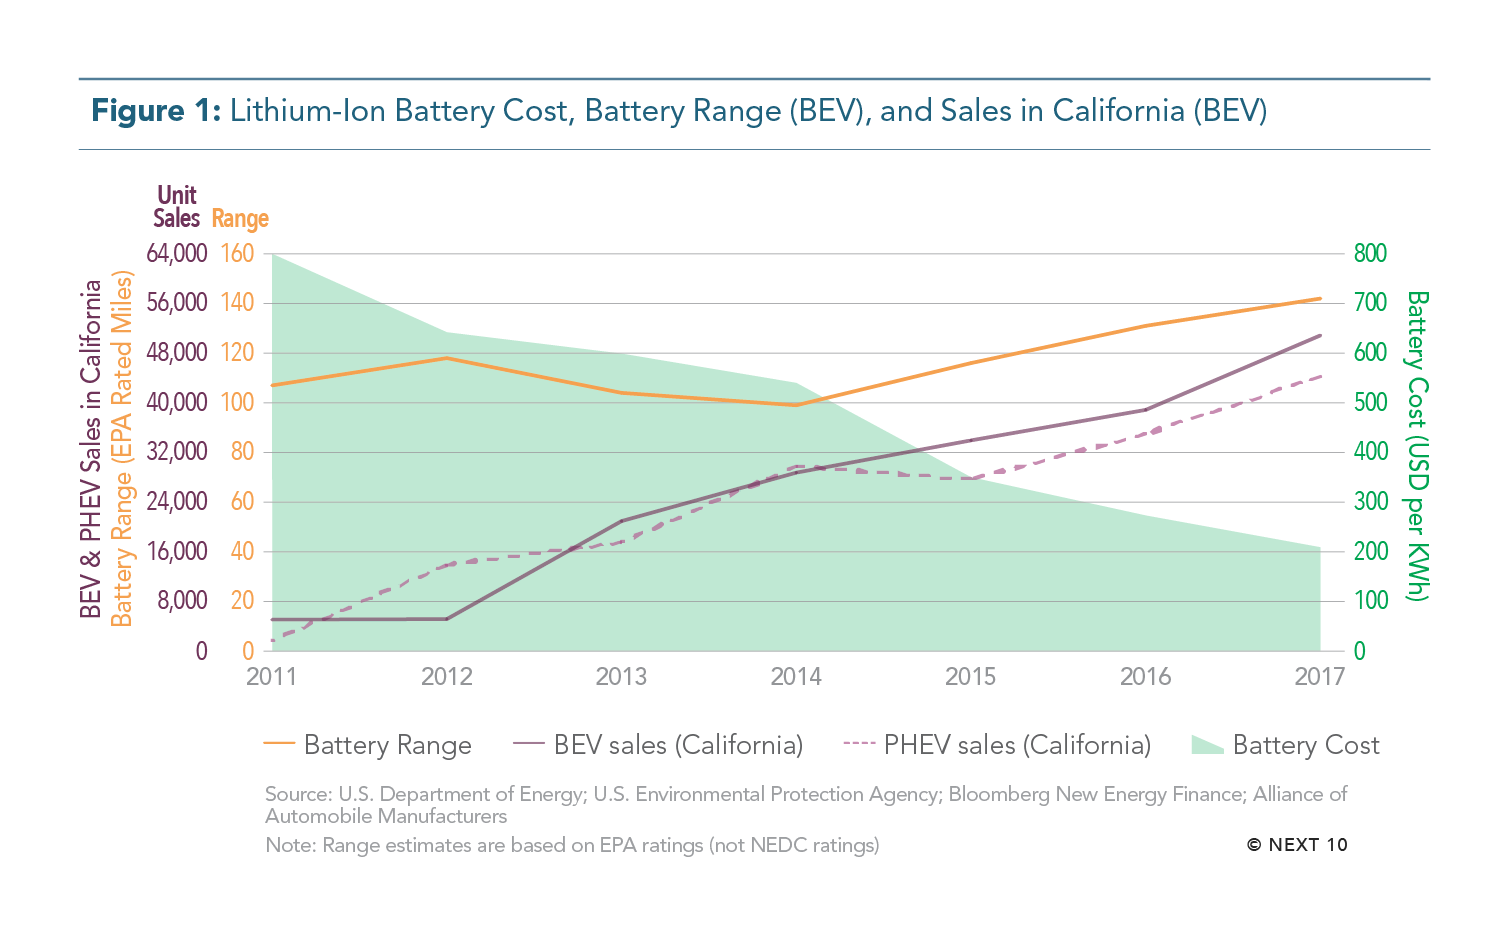
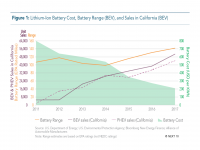
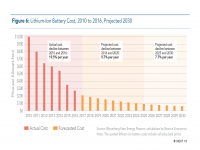
- The most expensive component of a ZEV is the battery. From 2010 to 2016, average battery cost per kilowatt-hour has dropped 74 percent from over $1,000 to $273/KwH while energy density has improved five percent per year. Bloomberg New Energy Finance estimates battery cost will decline by almost 10 percent until 2025, when ZEVs will reach price parity with ICE vehicles.
- Performance:
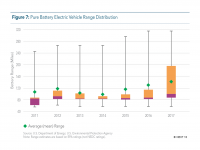
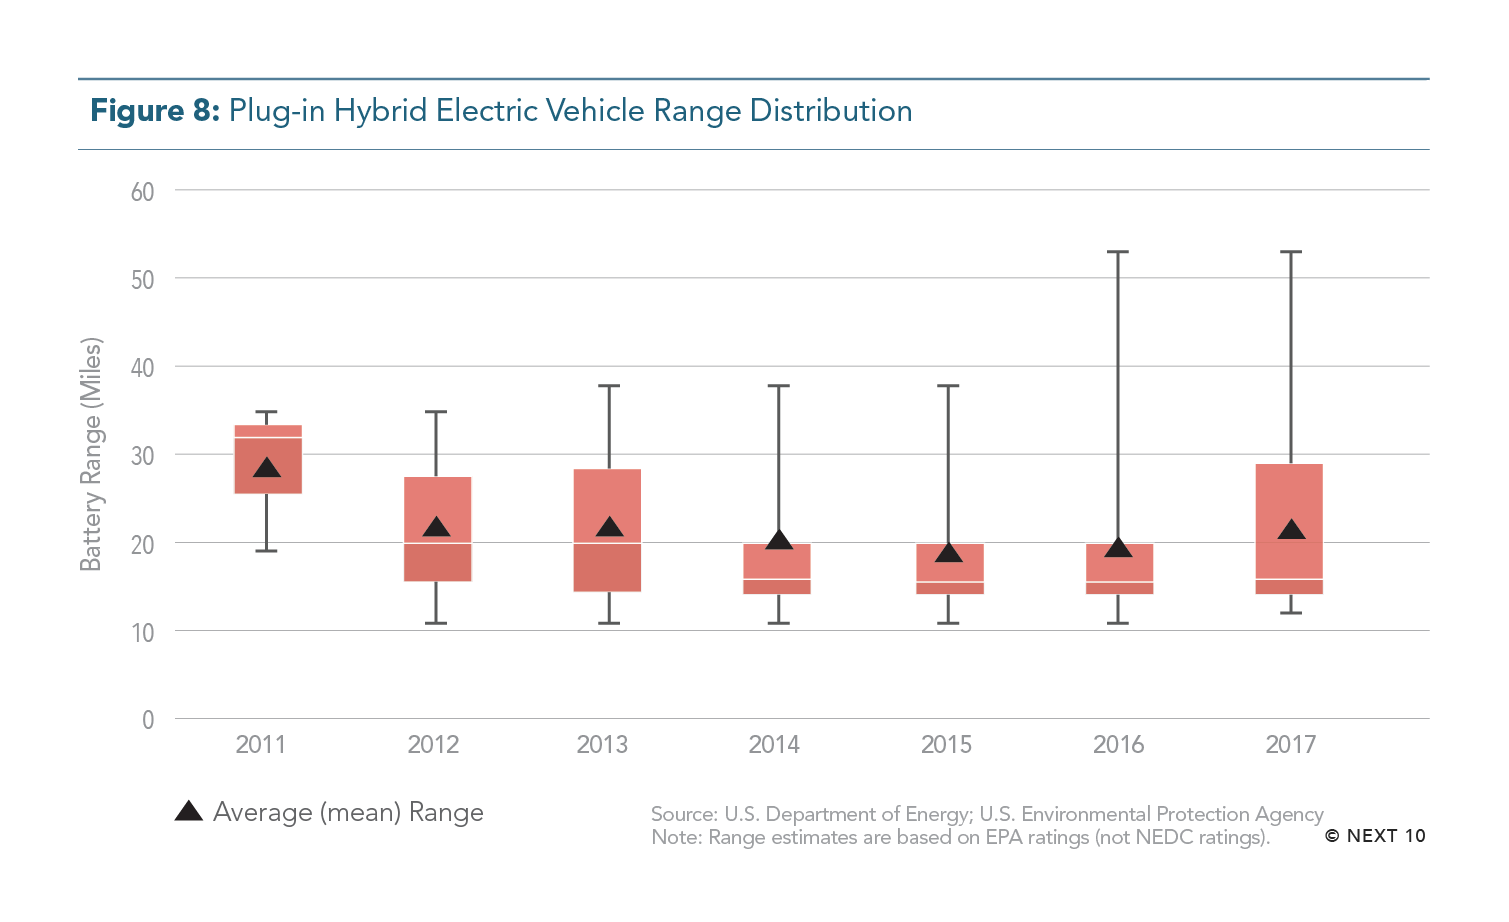
- Battery range has been increasing annually. In 2017, Tesla Model S had the farthest EPA-rated range for an all-electric vehicle at 315 miles.
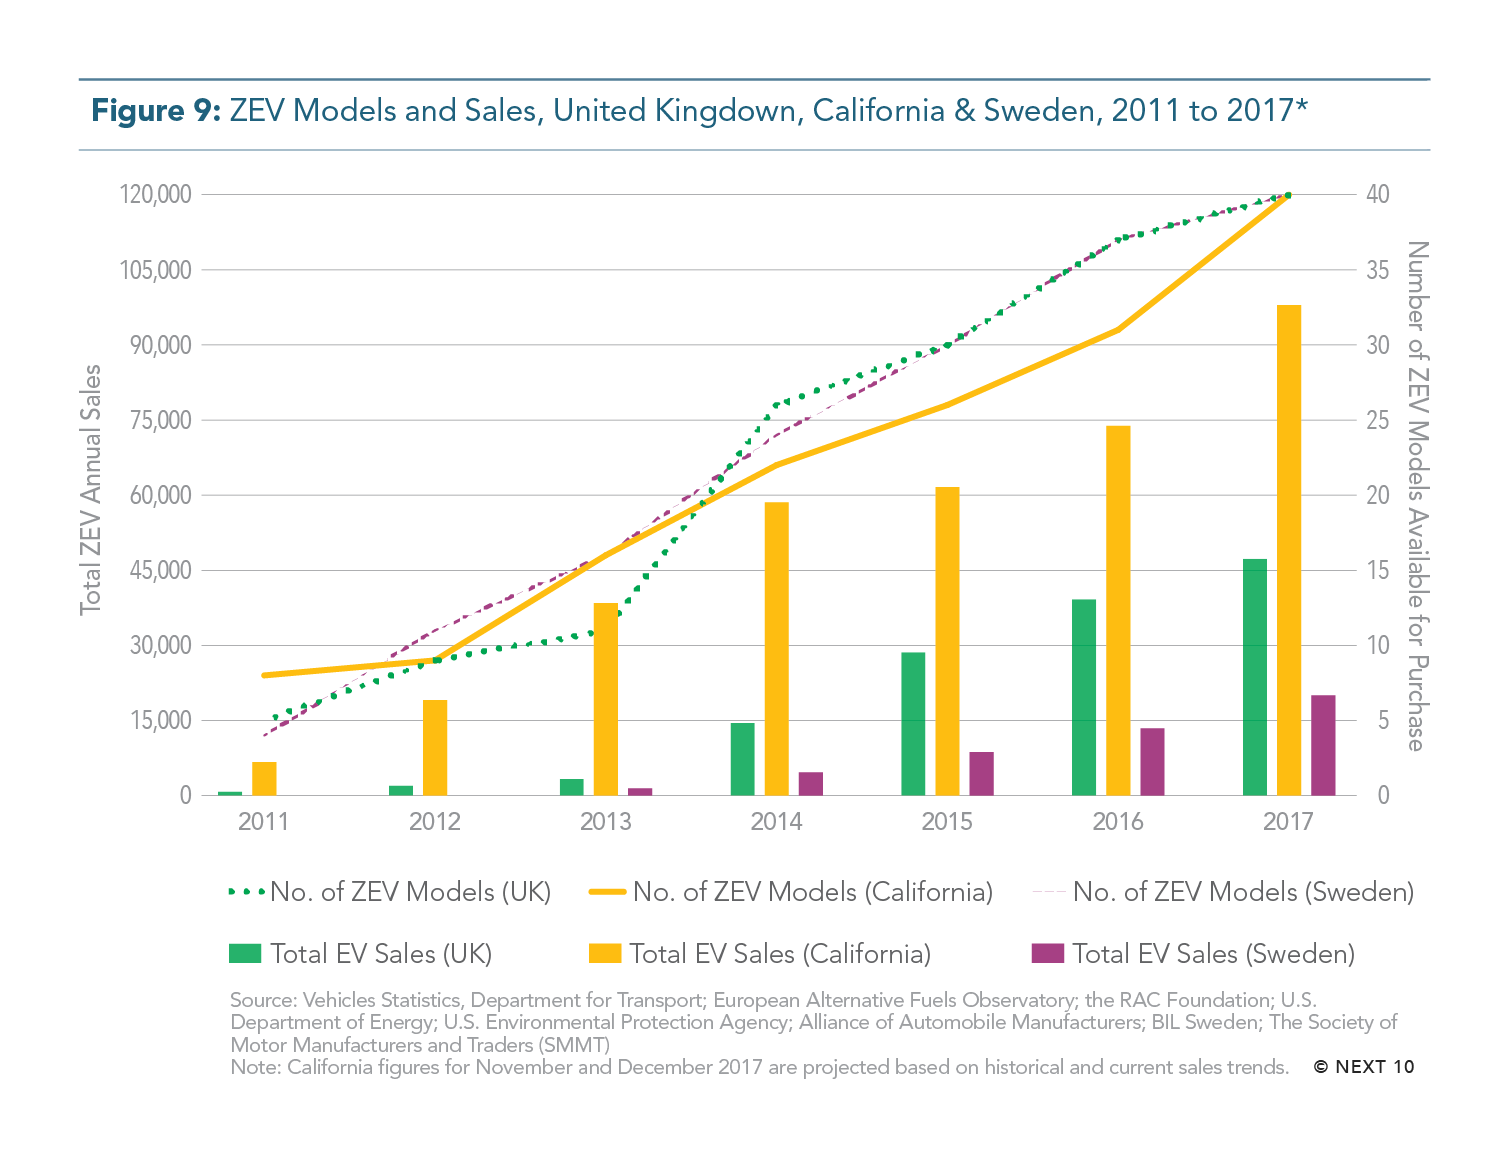
- Choice:
- 150 different plug-in hybrid and pure electric vehicles are available worldwide, with that number set to rise to over 240 by 2021.
- China leads with over 75 EV models, while in the top California cities for EV penetration, auto dealers offer 25 to 30 different models.
- In the top California cities for EV penetration, auto dealers offer 25 to 30 different models, but more than half of the U.S. population lives in a metropolitan area with 7 or fewer available models.
- Convenience:
- Infrastructure: From 2011 to 2016, the number of stations for charging electric vehicles increased by 1,138 percent in the U.S. In 2016 there was one charging plug for about every 6 electric cars.
- Fueling time: Tesla’s Superchargers can recharge EVs to 80% in 20 to 40 minutes. Others fully charge EVs in 3 to 4 hours, while slower charging points take around 6 to 8 hours.
- Maintenance: ZEVs require significantly less time and money spent on maintenance because they have only about 20 moving parts—about 1,980 fewer moving parts than traditional ICE vehicles.
- Public Policy:
- National governments including China, the U.K., France, the Netherlands, and India have stated the intention to phase out the internal combustion engine.
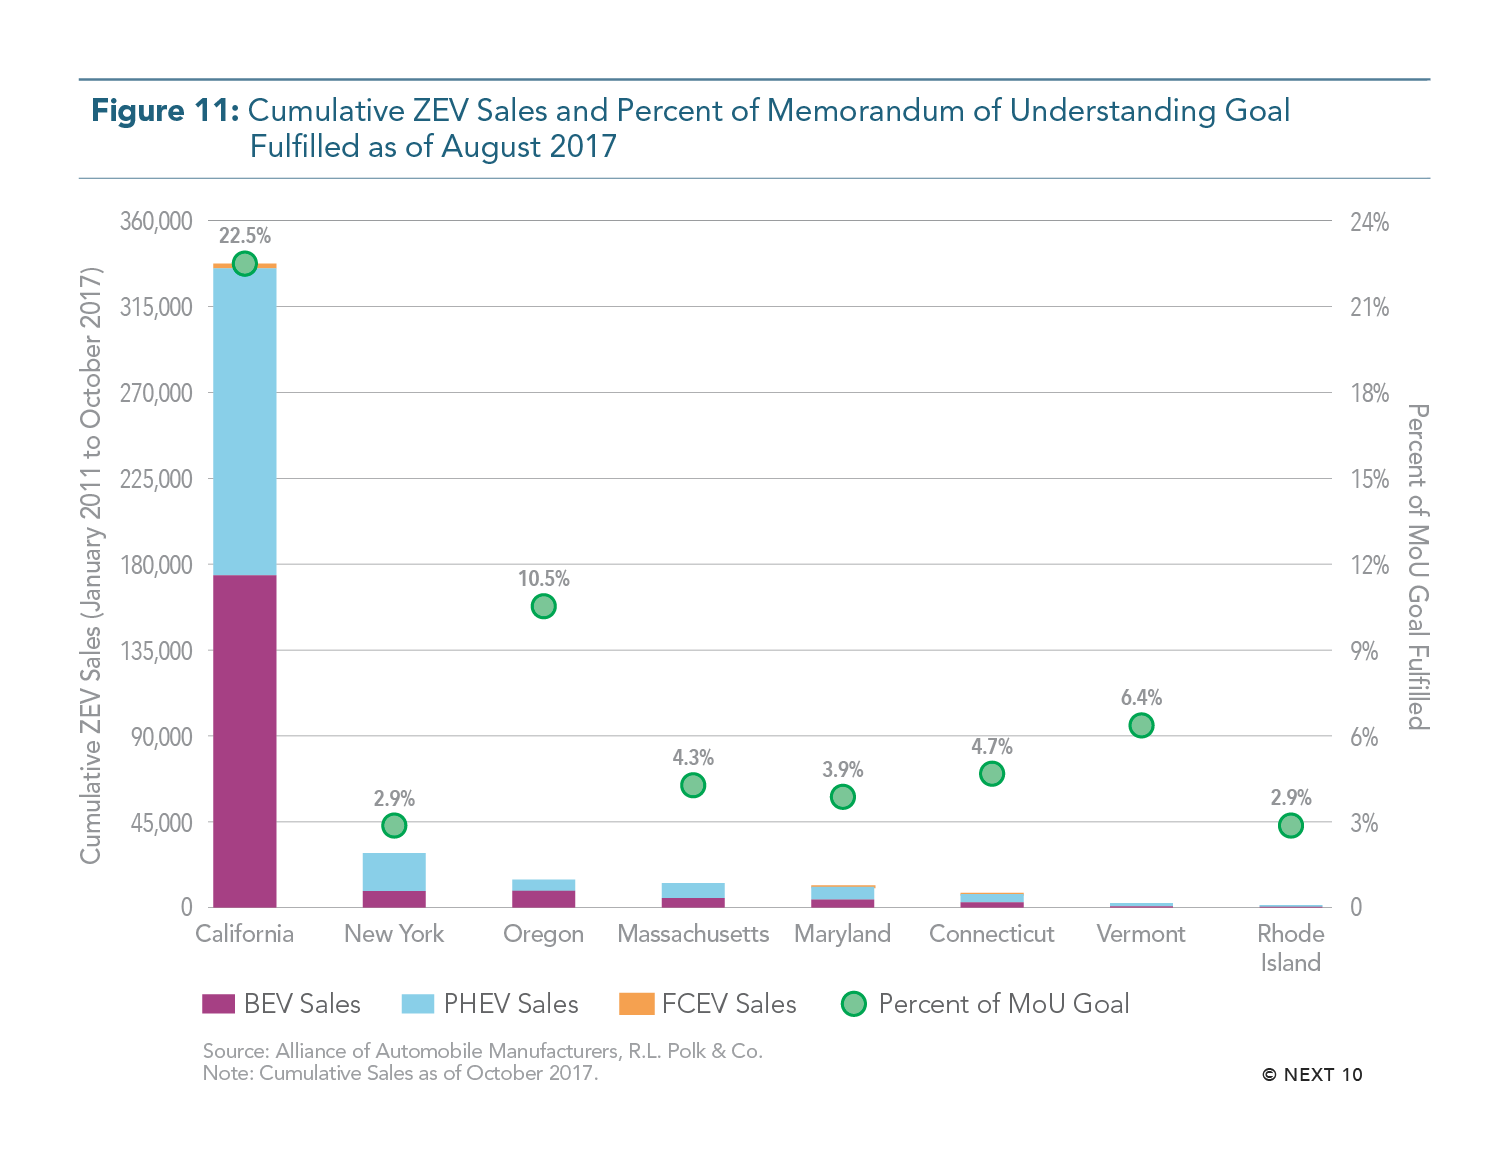
- California and nine other states are moving to accelerate ZEV adoption. Eight states including California signed a memorandum of understanding (MoU) committing to bring 3.3 million ZEVs on the road by 2025.
- As of October 2017, California had fulfilled 22.5 percent of the MoU goal, followed by Oregon with 10%. California appears to be the only state on track to fulfill its MoU goals.
- In January 2018, Assemblyman Phil Ting introduced a bill that would ban gas-powered cars by 2040.
Next 10 owns the copyright to all graphics in this section, and they are available for download and limited use, subject to our Terms of Use. Please contact Next 10 at info@next10.org with any questions.