Publications
Right Type, Right Place: Assessing the Environmental and Economic Impacts of Infill Residential Development through 2030
Location, location, location: real estate choices help California meet climate goals, grow local economies, and benefit residents.
Right Type, Right Place: Assessing the Environmental and Economic Impacts of Infill Residential Development through 2030—the first comprehensive academic study of it's kind—finds that encouraging new housing development in infill areas would spur economic growth, reduce monthly household costs, and cut greenhouse gas emissions, keeping the state on track to achieving its climate goals.
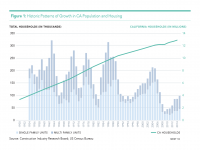
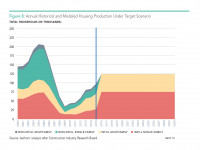
The study models three different scenarios for California’s housing future through 2030:
- Business as usual, where development follows the same patterns it did from 2000 to 2015;
- A “medium” infill scenario, featuring much more infill housing and more multifamily housing;
- An infill “target” scenario where all new housing development happens in infill areas, which also features more multifamily housing than the business-as-usual scenario.
While the business-as-usual scenario results in more car-dependent housing farther away from jobs and schools, the infill target scenario meets the same demand, spurring economic growth with a much smaller carbon footprint. Target scenario benefits include:
- Annual economic growth that's over $800 million higher than business-as-usual
- Annual reductions of 1.79 million metric tons of greenhouse gas emissions, which is the equivalent of taking 378,000 cars off the road
For residents, those living in infill areas would drive about 18 fewer miles per weekday than those in non-infill areas—that's 90 fewer miles every week. The target scenario also provides more housing that meets the growing demand for compact, walkable neighborhoods, and results in lower monthly costs from reduced driving and lower utility bills, which balance out the slightly higher rents and mortgage payments required in the target scenario. Add it all up, and the study found renters would save, on average, $312 annually, while homeowners would save $156.
The report's Target Scenario results in environmental, economic and quality of life improvements that can help California address both housing and climate challenges. But achieving this level of infill development will not be easy; it will require policy changes at the local and state levels. California lawmakers are currently considering over 130 bills written to address the state's housing crisis, and the report authors provide important policy options for consideration, including reducing barriers and increasing incentives for regions that generate infill housing, creating anti-displacement policies to protect affordable housing, and directing more funds towards public transit.
Next 10 does not own the rights to this publication. Usage of this content is subject to permissions, please contact us at info@next10.org for more information.
Modeling the effect of these three housing scenarios on key environmental and economic indicators produces the following results:
- The Target Scenario offers at least 1.79 million metric tons of greenhouse gas reduction annually compared to the Baseline (business-as-usual) Scenario, based on reduced driving miles and household energy usage. That number is equivalent to:
- Averting emissions from 378,108 passenger vehicles and from burning over 201 million gallons of gasoline annually
- Almost two-thirds of the total statewide emissions decrease California achieved between 2013 and 2014 alone
- Almost 15 percent of the emissions reductions needed to reach the state’s Senate Bill 375 (Steinberg, 2008) targets from statewide land use changes
- Together with other land use changes that this housing scenario could stimulate, the savings would help the state meet its goals of reducing emissions from a projected 431 million metric tons in 2020 to 260 million metric tons by 2030, as required by state law.
- The Target Scenario outperforms the Baseline and Medium Scenarios with:
- Higher annual economic growth (greater than $800 million more per year from the Baseline scenario), more tax revenue (greater than $5.4 million more per year), and lower overall construction costs (a savings of more than $13 billion over 15 years).
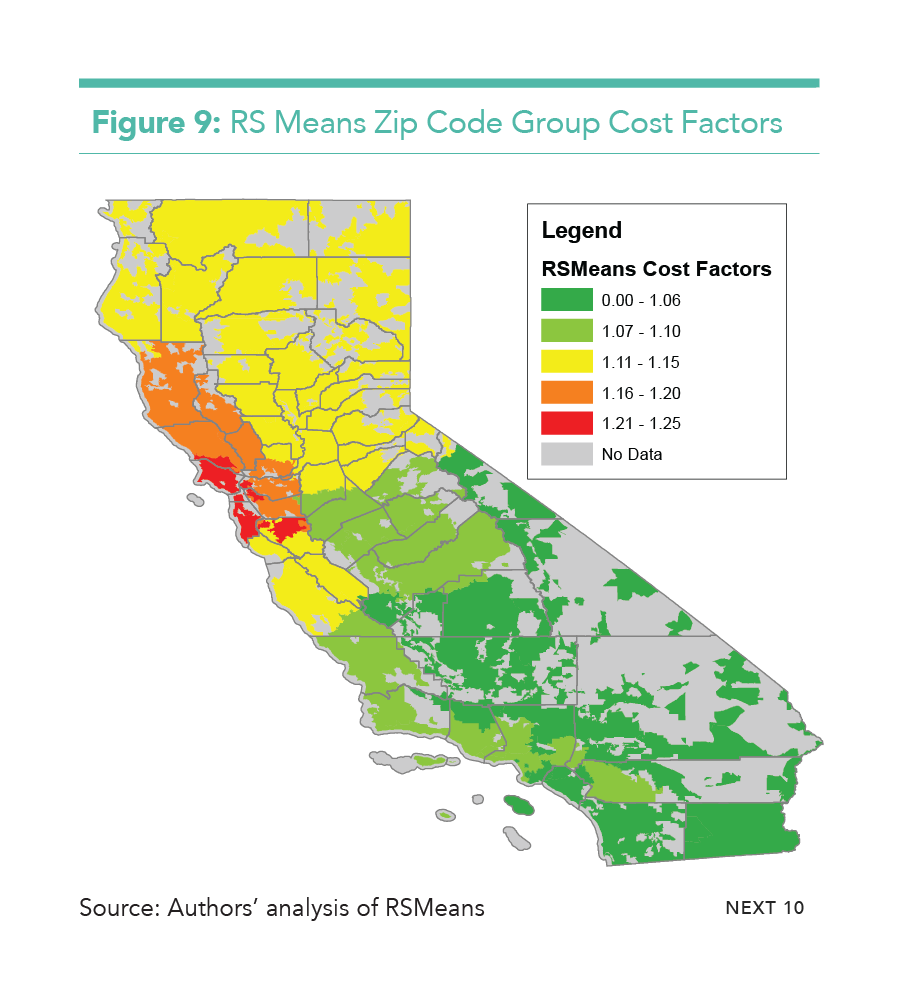
- The Target Scenario has lower construction costs than in the Medium and Baseline Scenarios.
- Although slightly fewer construction jobs are needed due to this lower cost (due largely to infill units being smaller than non-infill units overall), the Target Scenario offers higher-wage construction jobs than the Baseline Scenario, resulting in approximately $542 million more in annual residential construction job income.
- While more housing growth in the job-rich coastal cities could lead to slightly higher average home prices and rents (due to higher construction costs and land values in these locations), the average household would see lower overall monthly costs in the Target and Medium Scenarios compared to the Baseline Scenarios.
- Any increase in home prices and rents in these areas are offset by lower transportation and utility costs from building in infill areas.
- Under the Target scenario, renters still save $26/month and homeowners save $13/month.
- The economic impacts across all three scenarios are remarkably consistent, meaning that these environmental gains can occur with virtually no negative economic impacts and potentially significant economic gains.
Next 10 cannot grant permission to use graphics from this publication; additional permissions may be required from the copyright holder. Please view our Terms of Use policy for more information or contact Next 10 at info@next10.org with any questions.