Publications
California Migration
A trio of new studies suggest deepening divisions in California's economy, depending on residents' income and where they live. Some familiar trends continue.
Over the decade ending in 2016, more people moved out of California than moved in, and the state still has the highest housing costs in the nation. Job growth is up across low-, mid- and high-income earners, but while wages have increased across all categories, low-income earners haven’t seen their paychecks increase at a comparable pace in recent years. Well-educated, high-income earners continue to move to California, even as growth in high-wage employment has slowed. As housing prices near an all-time high, Californians with low-paying jobs are leaving the state in search of more affordable lives, despite a growing number of available low-paying jobs.
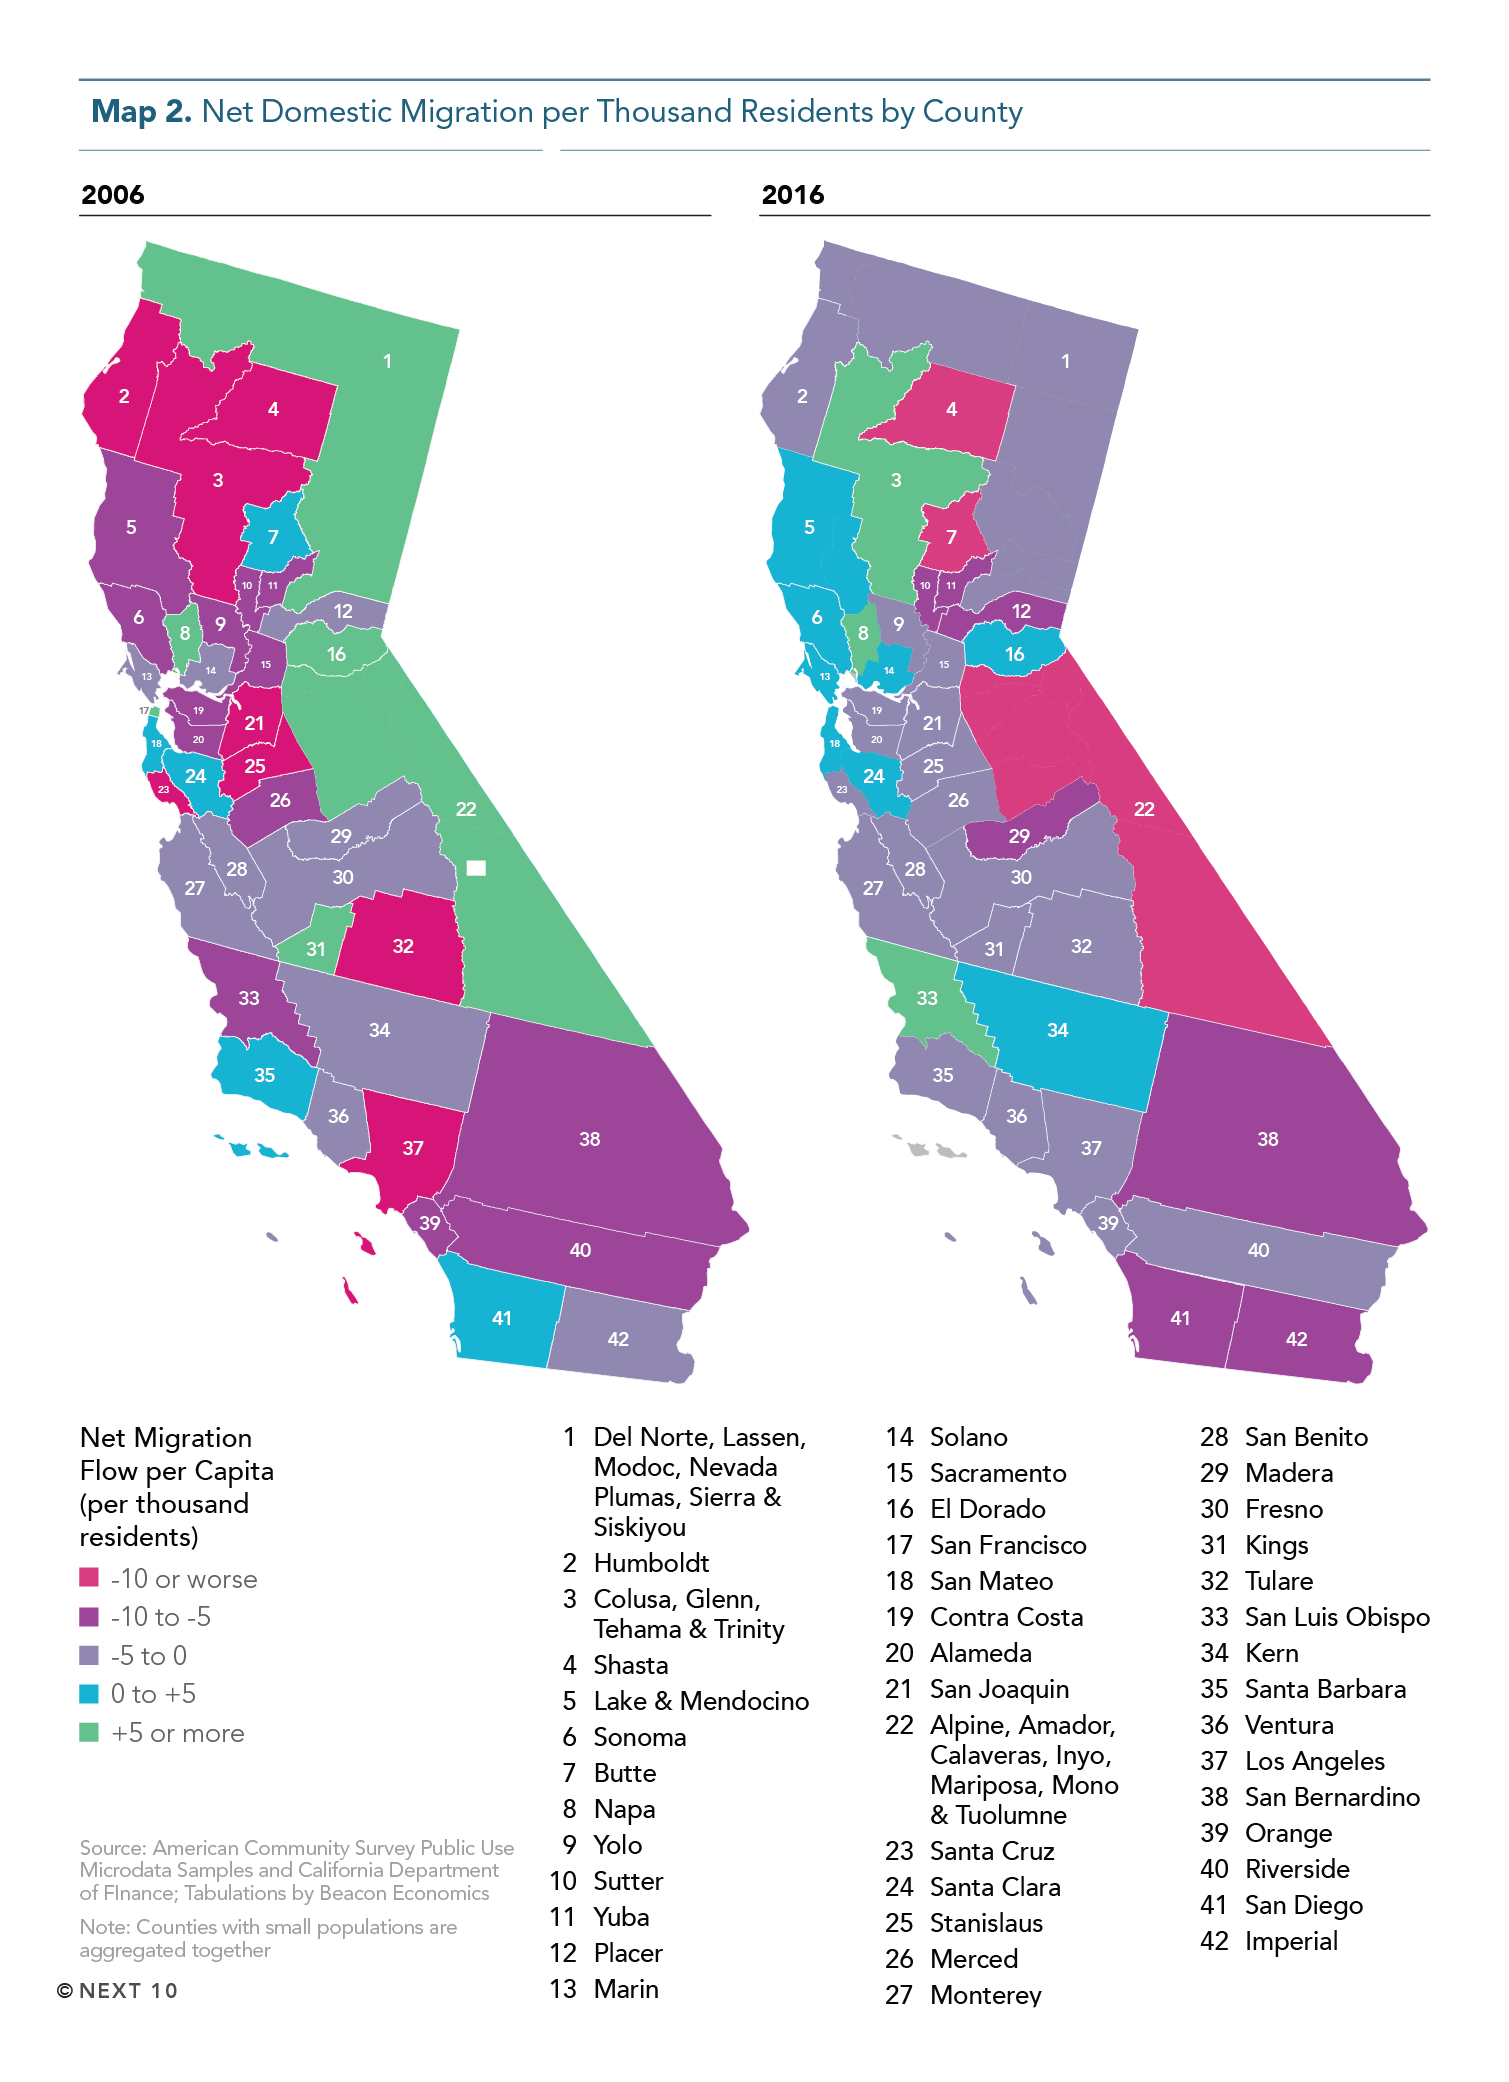
Regional differences add another layer of complication. For example, in the Bay Area, the number of high-wage jobs continues to grow, and high-wage workers continue to move in, but in Southern California, shares of high- and middle-wage employment have declined. Southern California and rural areas are losing more residents, on average, than other parts of the state.
Next 10 owns the rights to this publication. Any usage of content from this publication is subject to our Terms of Use.
- From 2006 to 2016, 1,090,600 more people moved out of California to other states than moved from other states to California.
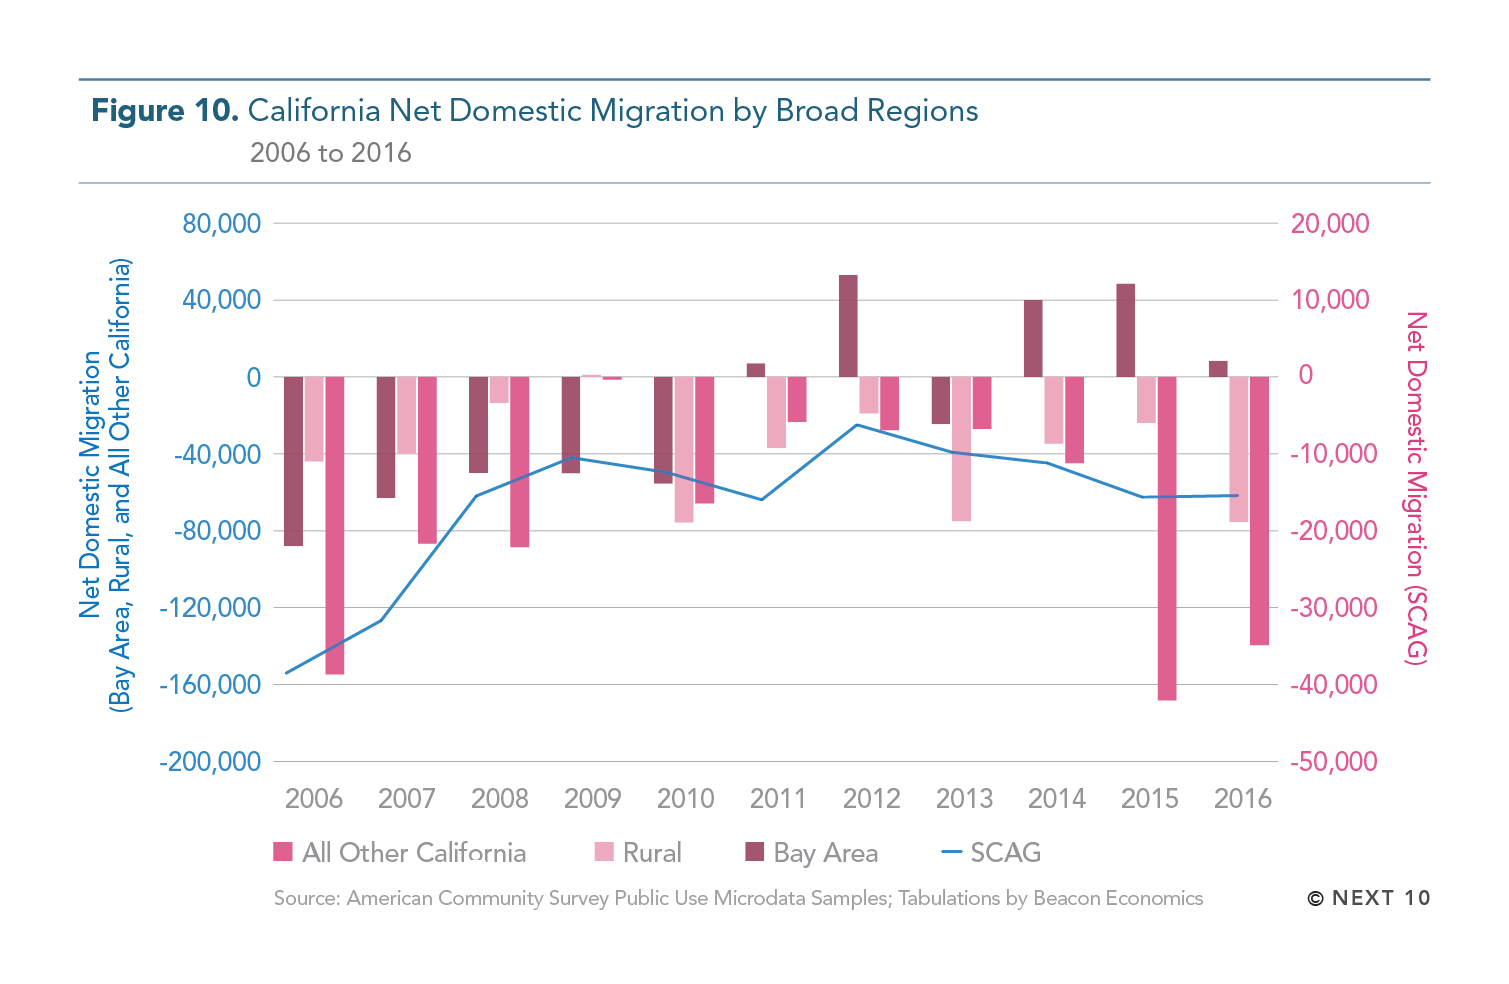
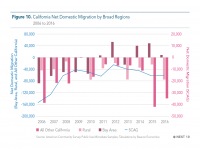
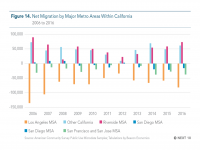
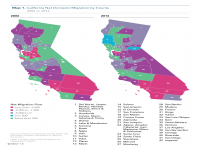
- Migration and income trends vary by region.
- The Bay Area, which had the highest percentage gains in high-wage jobs, has experienced overall net migration growth since 2014.
- By contrast, Los Angeles and the Inland Empire have seen declines in high- and middle-wage jobs, an increase in low-wage employment, and more people moving out of state than moving in.
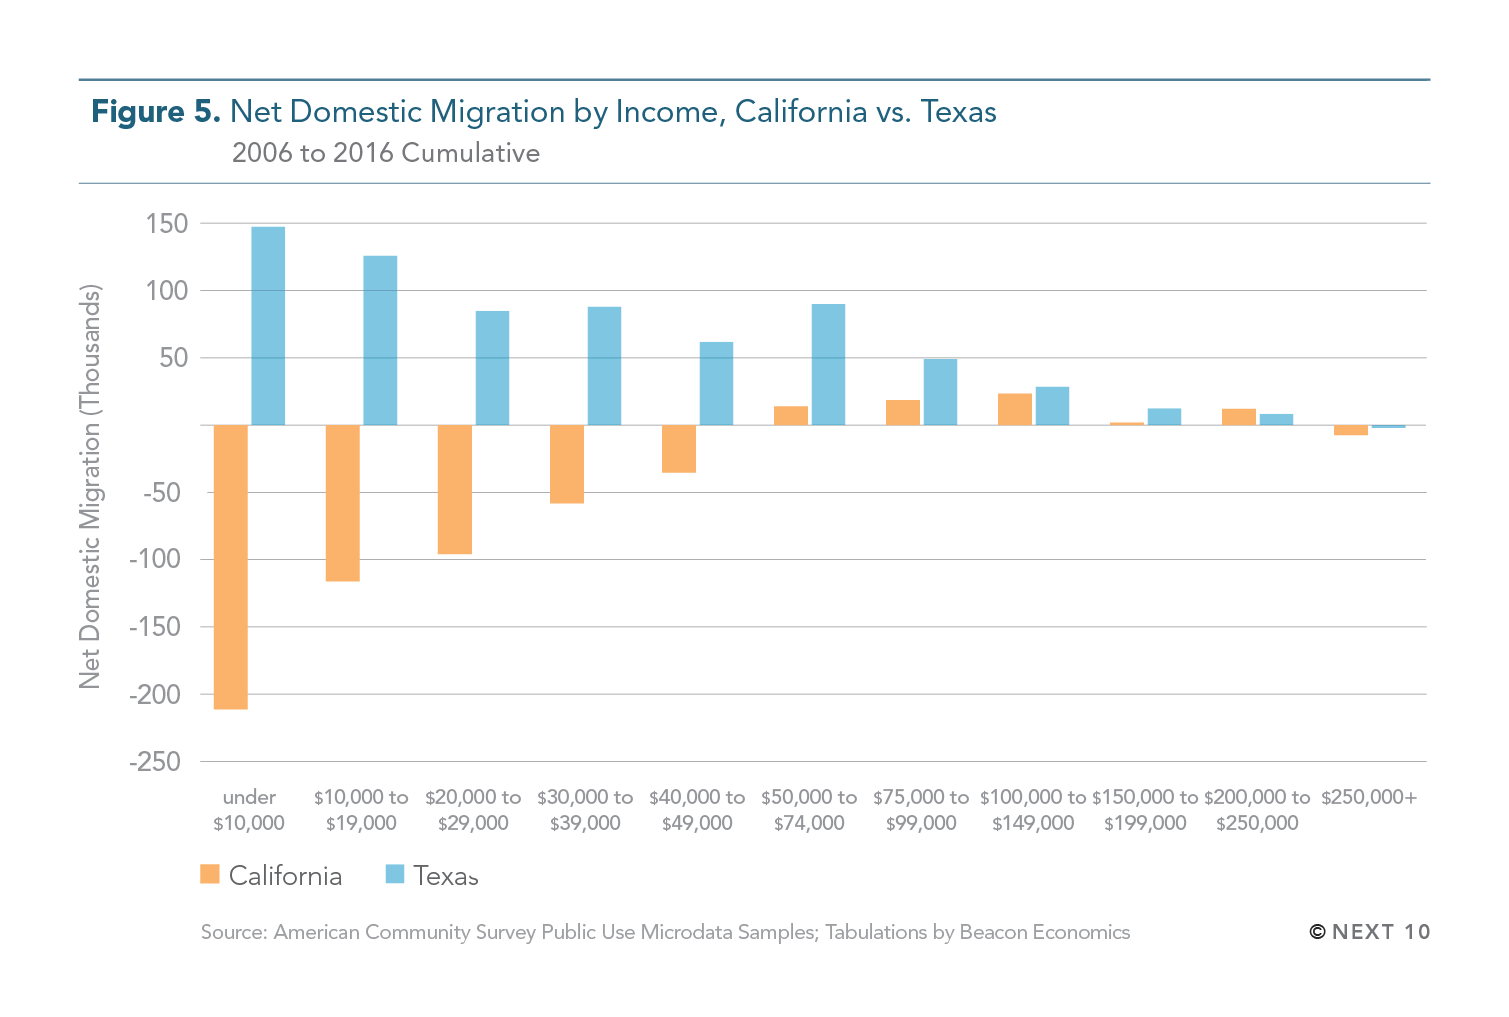
- The main driver for net out-migration appears to be high housing costs, since migration rates are highest for those at lower-wage levels.
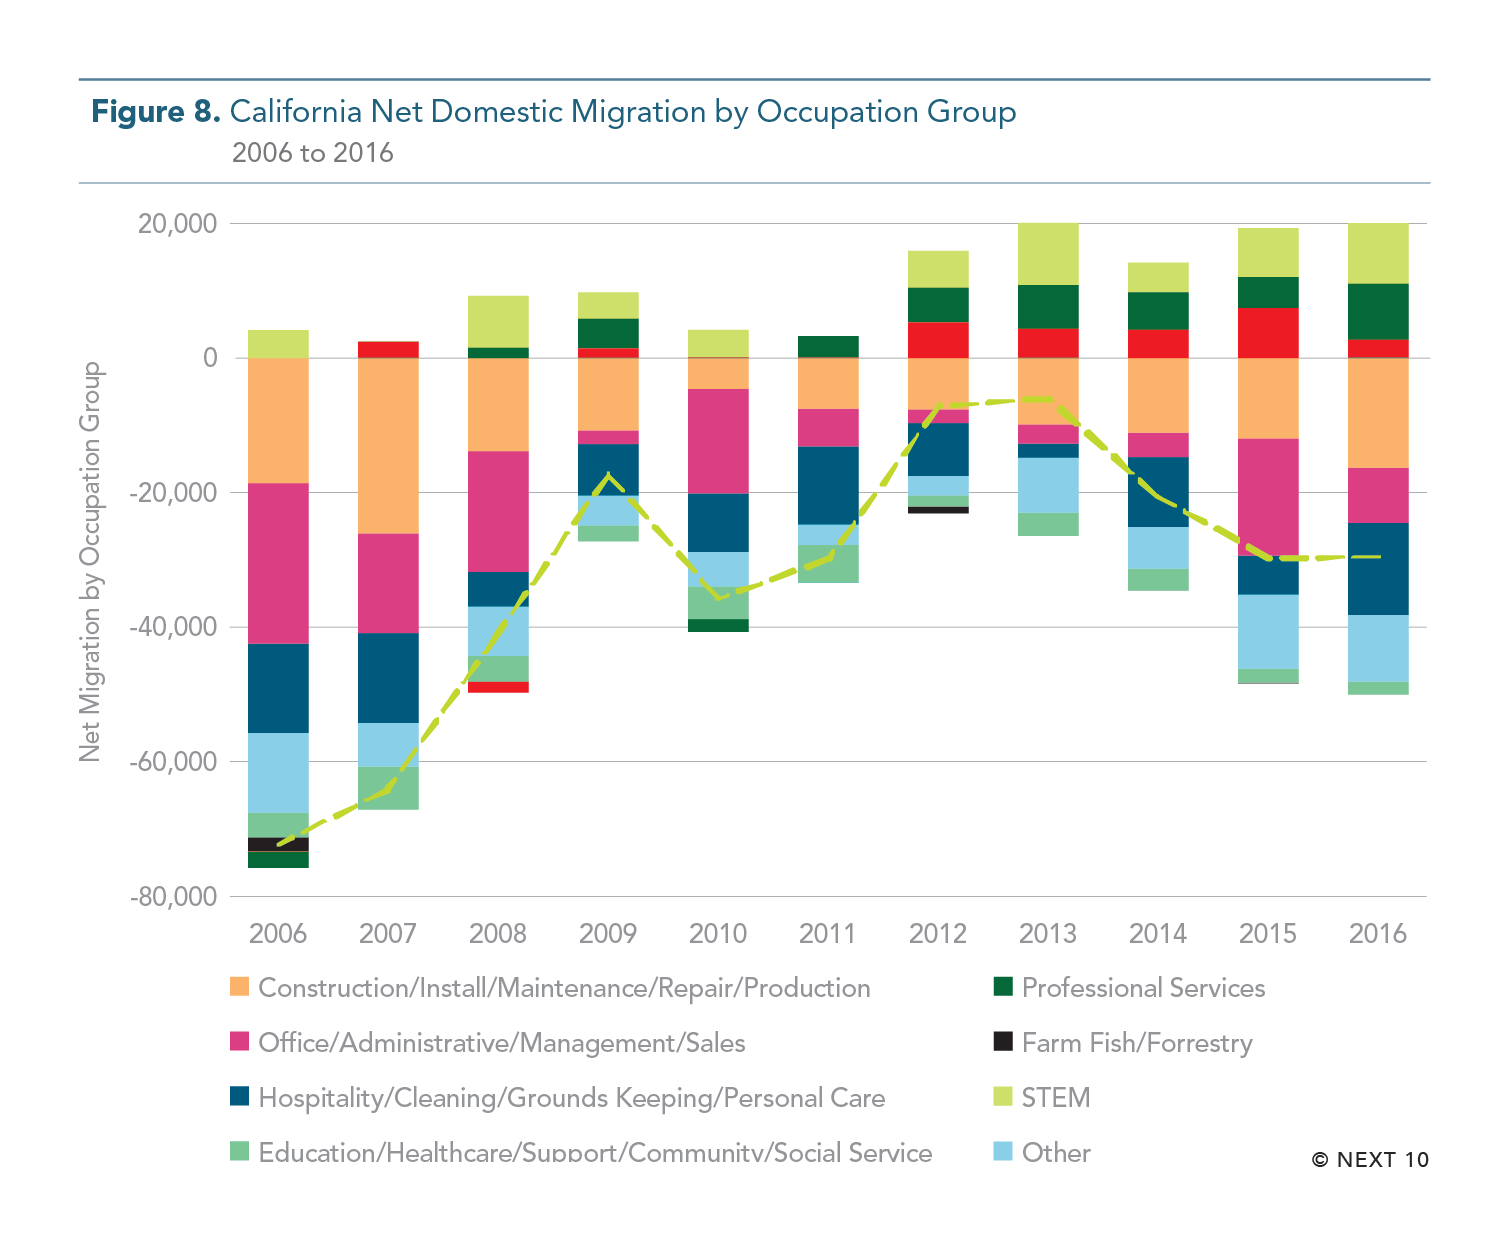
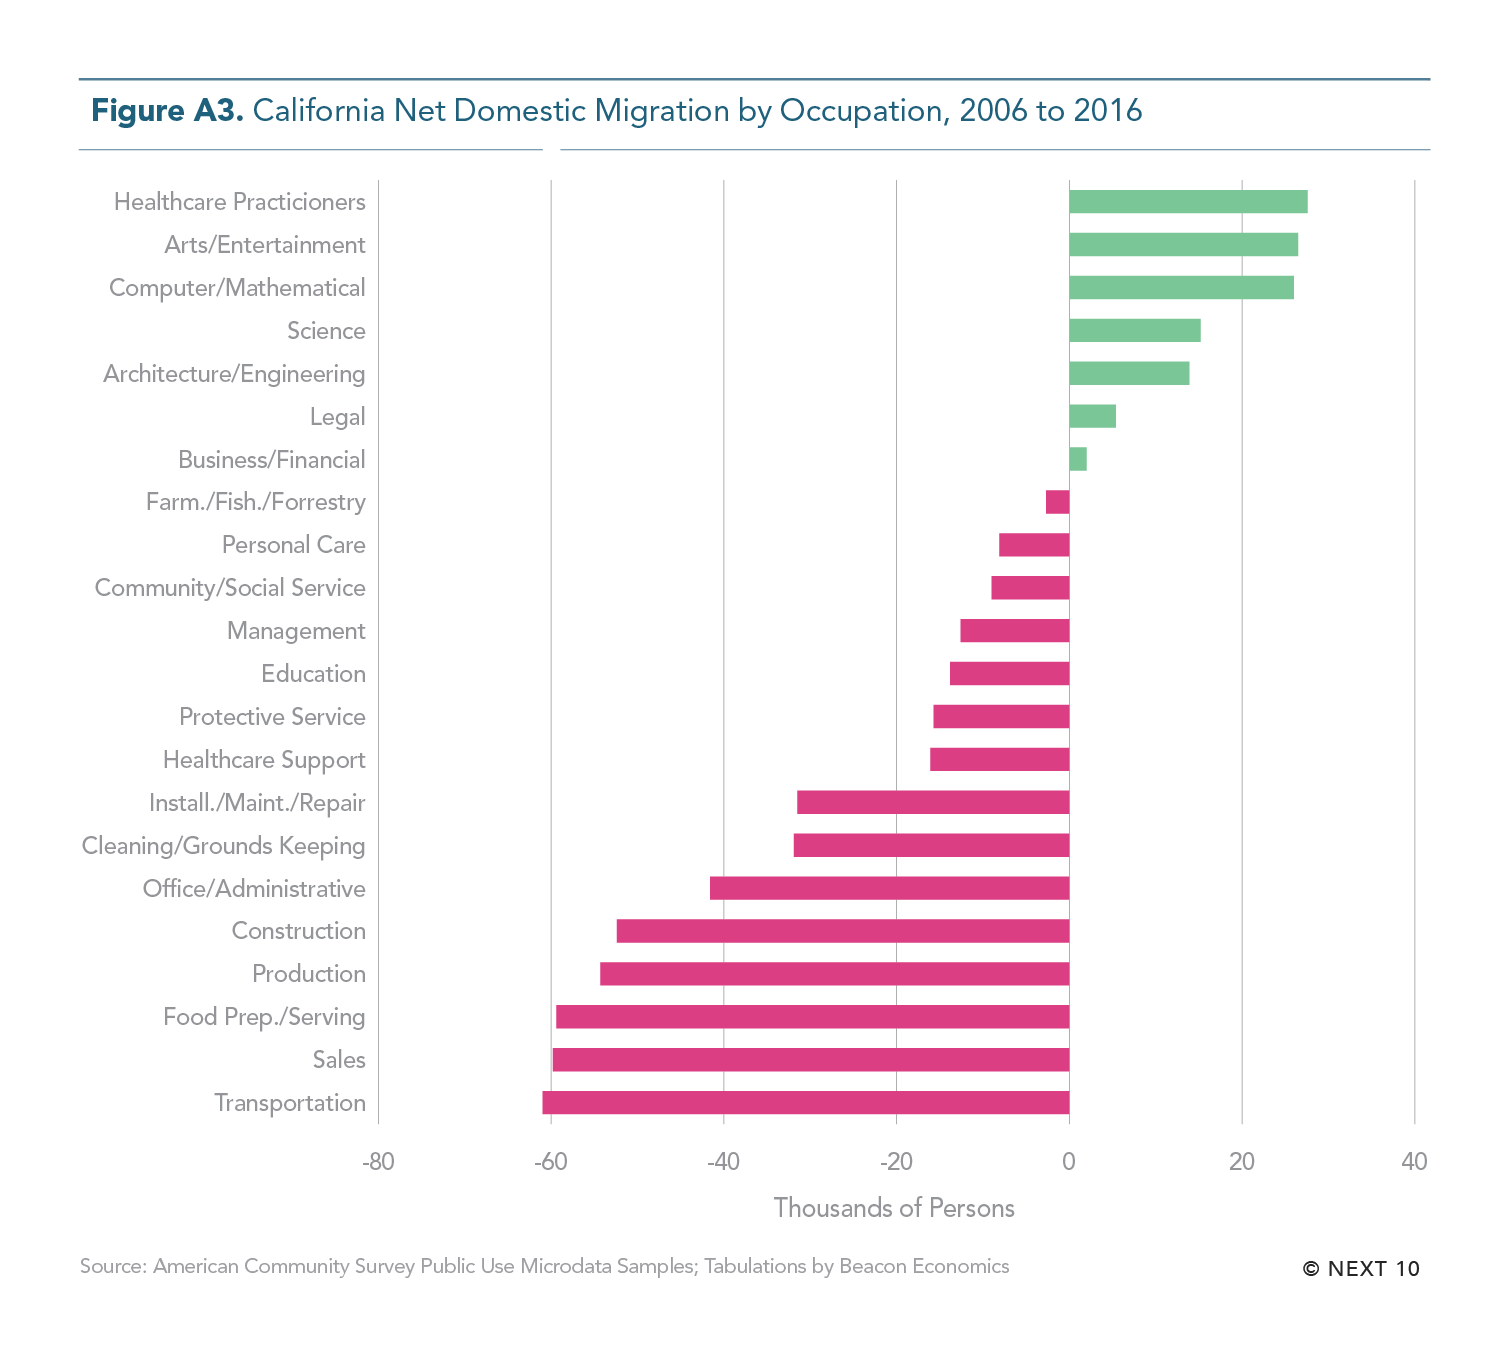
- The vast majority of people who moved out of California were concentrated in lower-skilled, lower-paying fields—namely sales, transportation, and food preparation— which together accounted for a net outflow of more than 180,200 people from 2006 to 2016.
- Migration trends suggest that the middle class is also being priced out of the state.
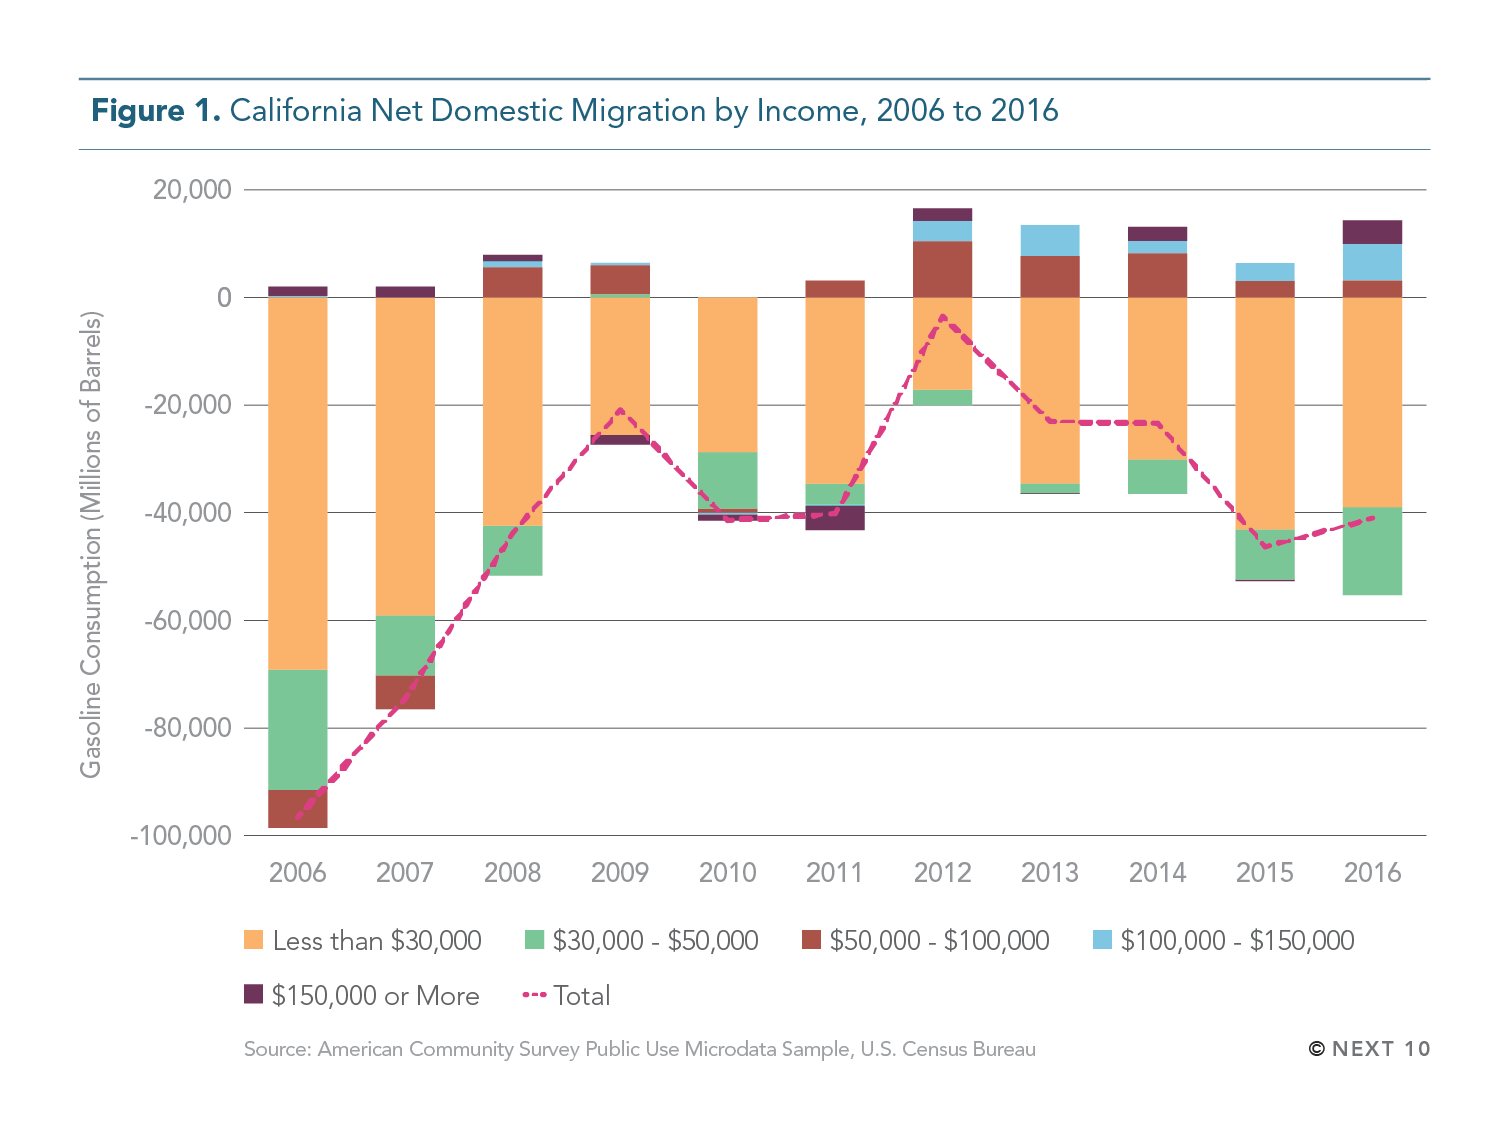
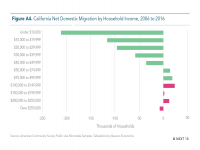
- Net migration of those earning between $30,000 and $49,999 accounted for 93,500 residents leaving California from 2006 to 2016, or 18 percent of net out-migration.
- On the other hand, net domestic migration for households earning from $50,000 to $99,999 has been positive since 2010, representing 52 percent of net in-migration.
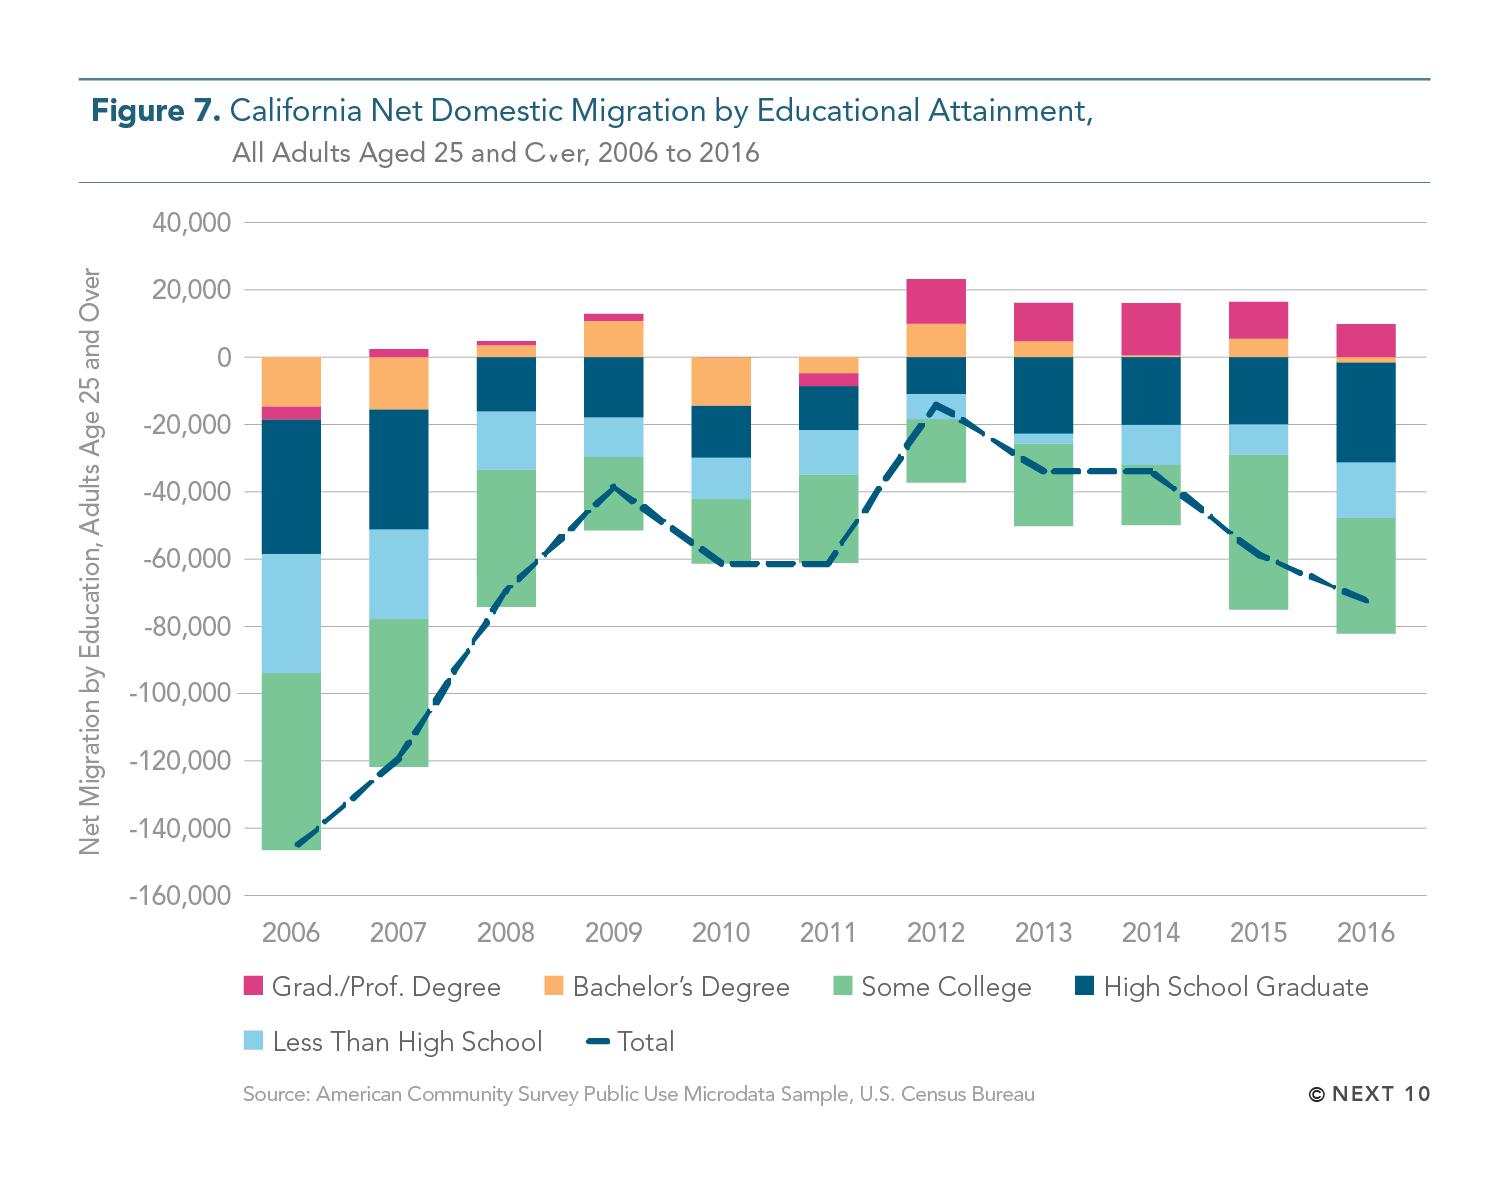
- The annual rate of net out-migration has fluctuated, and is recently on the rise, with 113,300 net residents leaving in 2016.
- That is, more people than left each year from 2009 to 2014, but not as many as the nearly 225,800 who moved out in 2006, when housing prices were sky-high ahead of the housing crash.
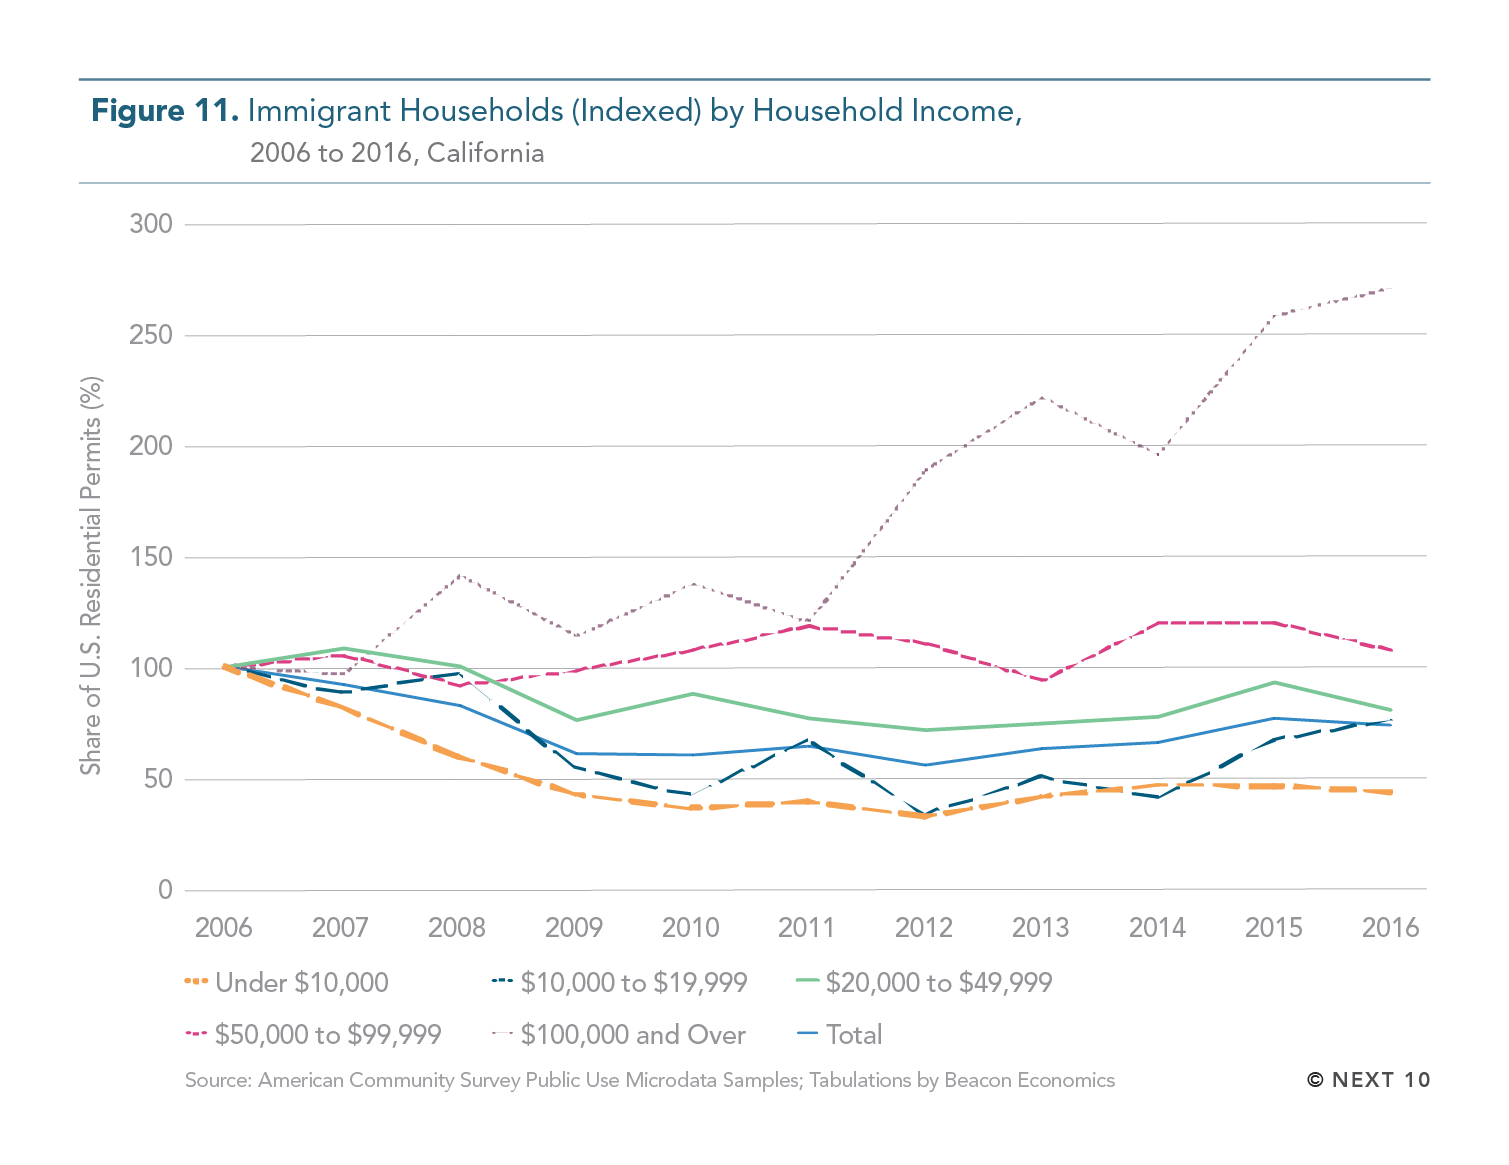
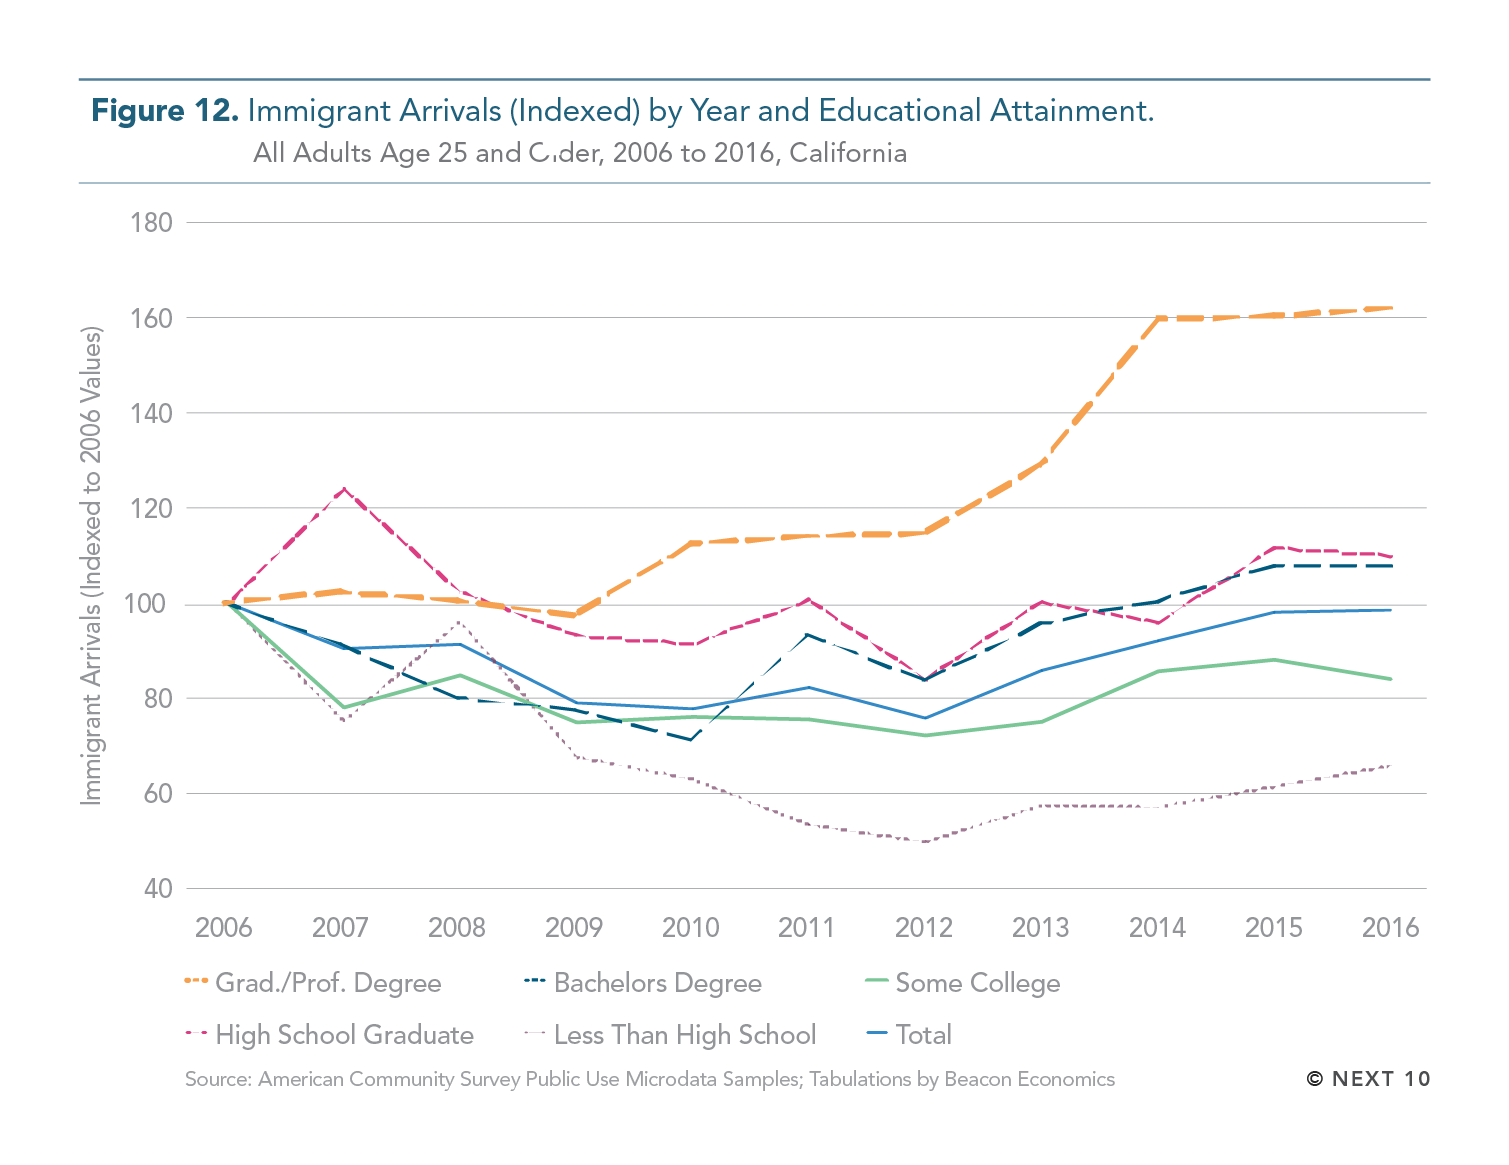
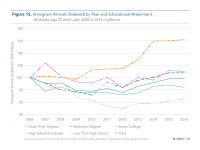
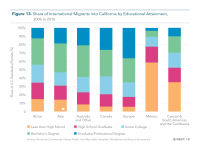
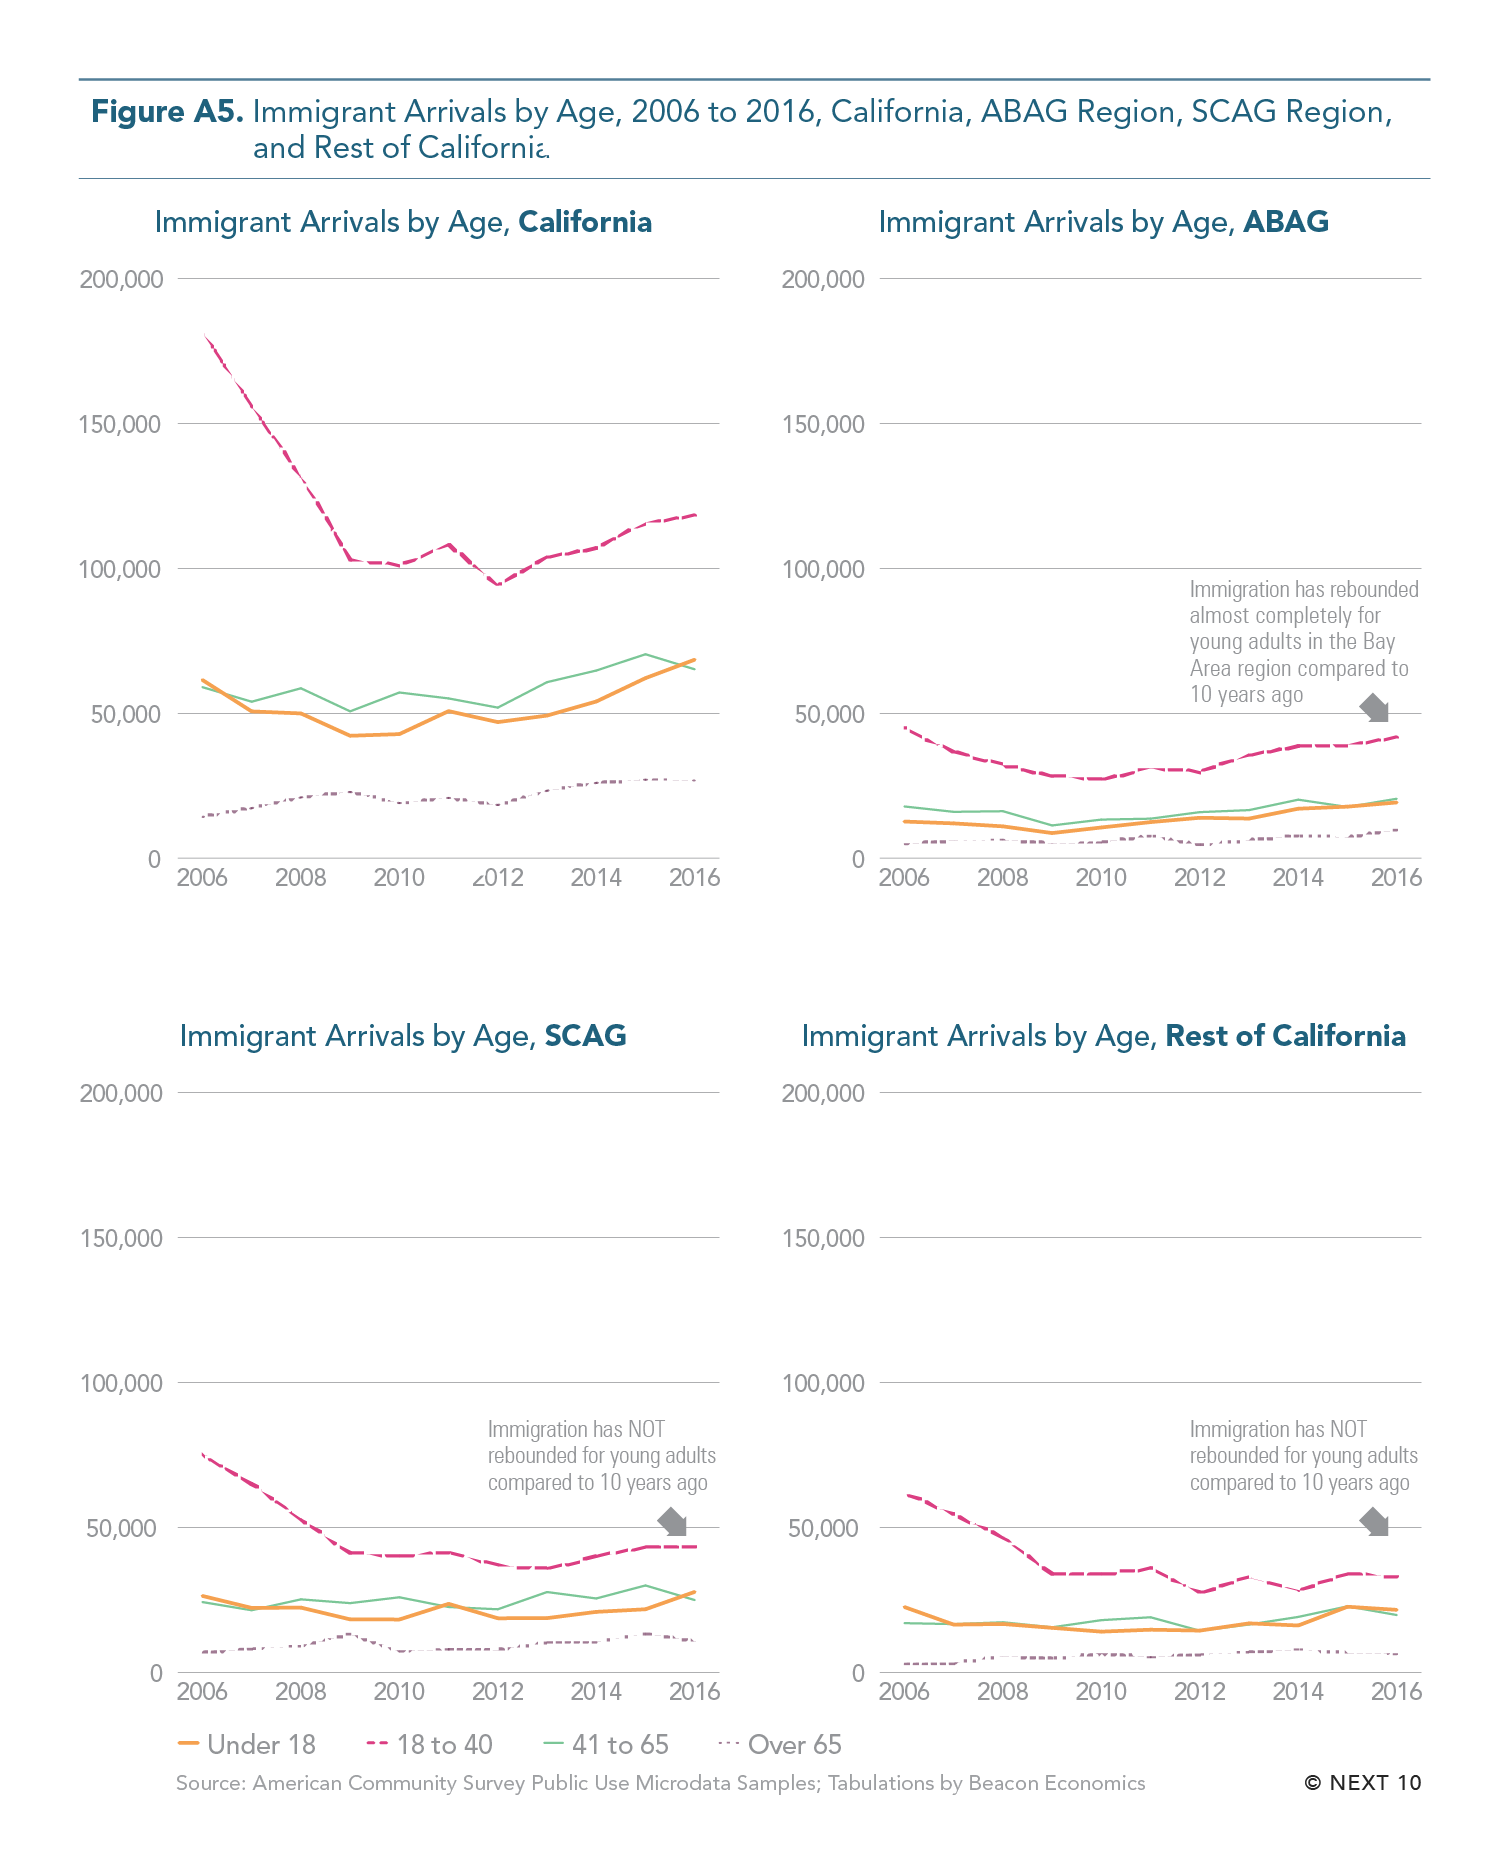
- International migrants who move to California tend to be more educated and have higher household incomes compared to domestic migrants.
- Between 2006 and 2016, immigrant households with incomes of at least $100,000 grew 170.5 percent, while immigrant households with incomes of less than $10,000 decreased 56.3 percent.
Next 10 owns the copyright to all graphics in this section, and they are available for download and limited use, subject to our Terms of Use. Please contact Next 10 at info@next10.org with any questions.