Publications
2022 California Green Innovation Index
The 14th annual California Green Innovation Index is now primarily digital, allowing readers to learn and interact with the findings of the report in a new medium. To get the full experience of the report's findings, visit the California Green Innovation Index website.
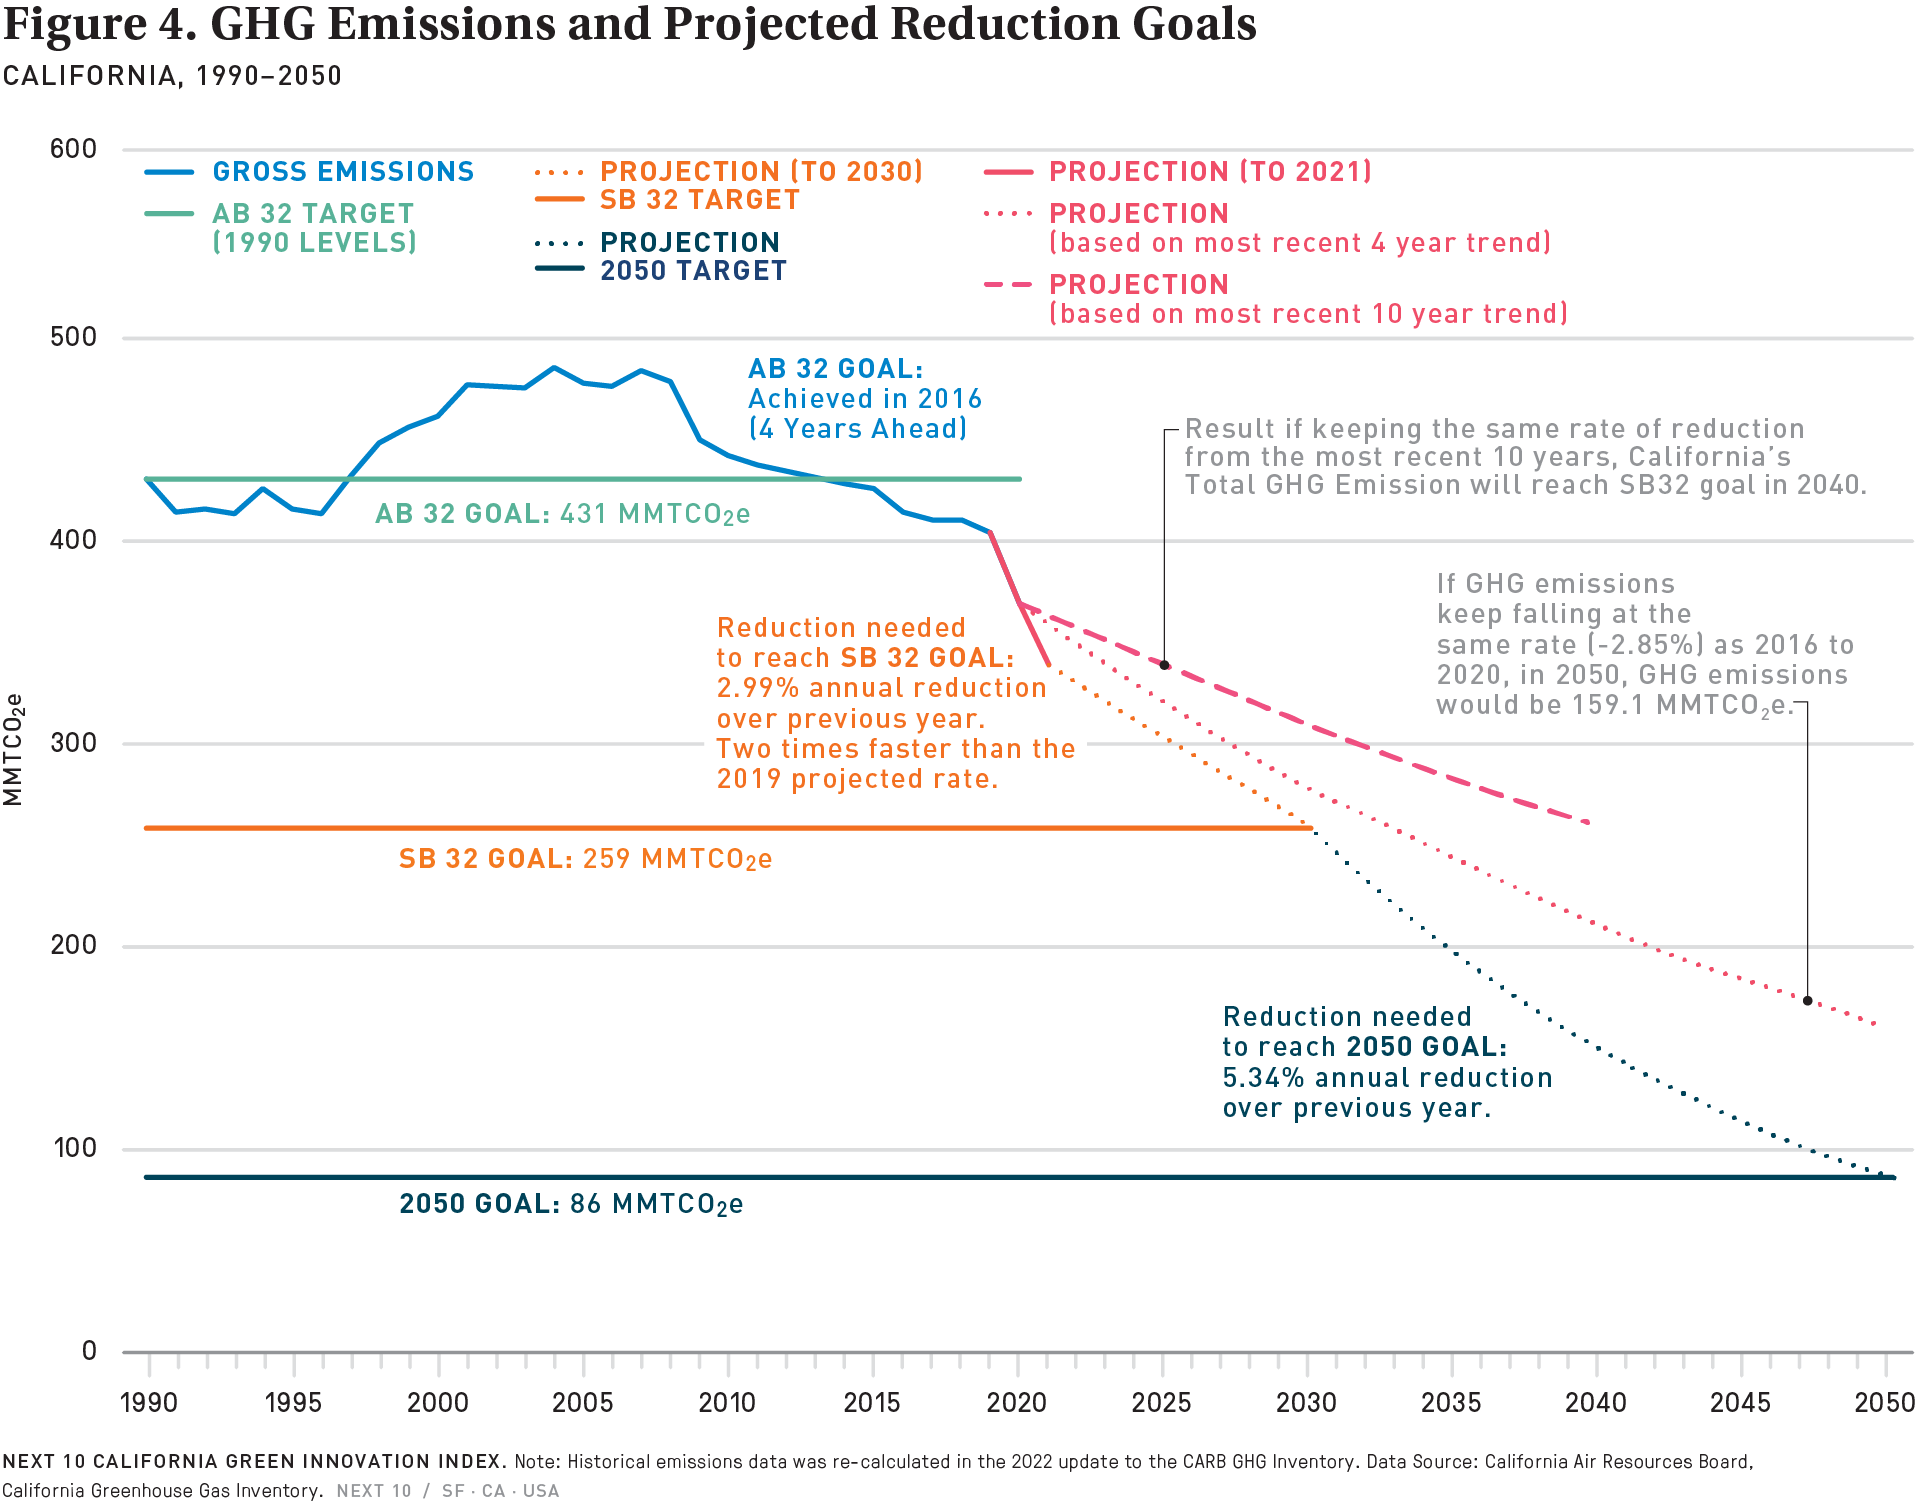
The report finds total greenhouse gas emissions dropped 8.7 percent between 2019 and 2020, though many of those reductions are a result of COVID-related transportation restrictions and economic disruptions. However, emissions from the transportation sector fell for the third consecutive year in 2020, indicating a more sustained trend in the largest-emitting sector in California. The recent passage of the Inflation Reduction Act (IRA) will also provide historic investments in electrification of transportation and clean energy generation in California and nationwide.
Encouragingly, emissions from the transportation sector fell for the third consecutive year in 2020, indicating a more sustained trend in the largest-emitting sector in California. Emissions from this sector fell by 16.1 percent from 2019 to 2020, driven by 19.8 percent reduction in emissions from light-duty passenger cars and an 18.5 percent drop in emissions from SUVs and light-duty trucks. Emissions from heavy-duty trucks—which saw the largest drop in the transportation sector in 2019—fell by 7.4 percent.
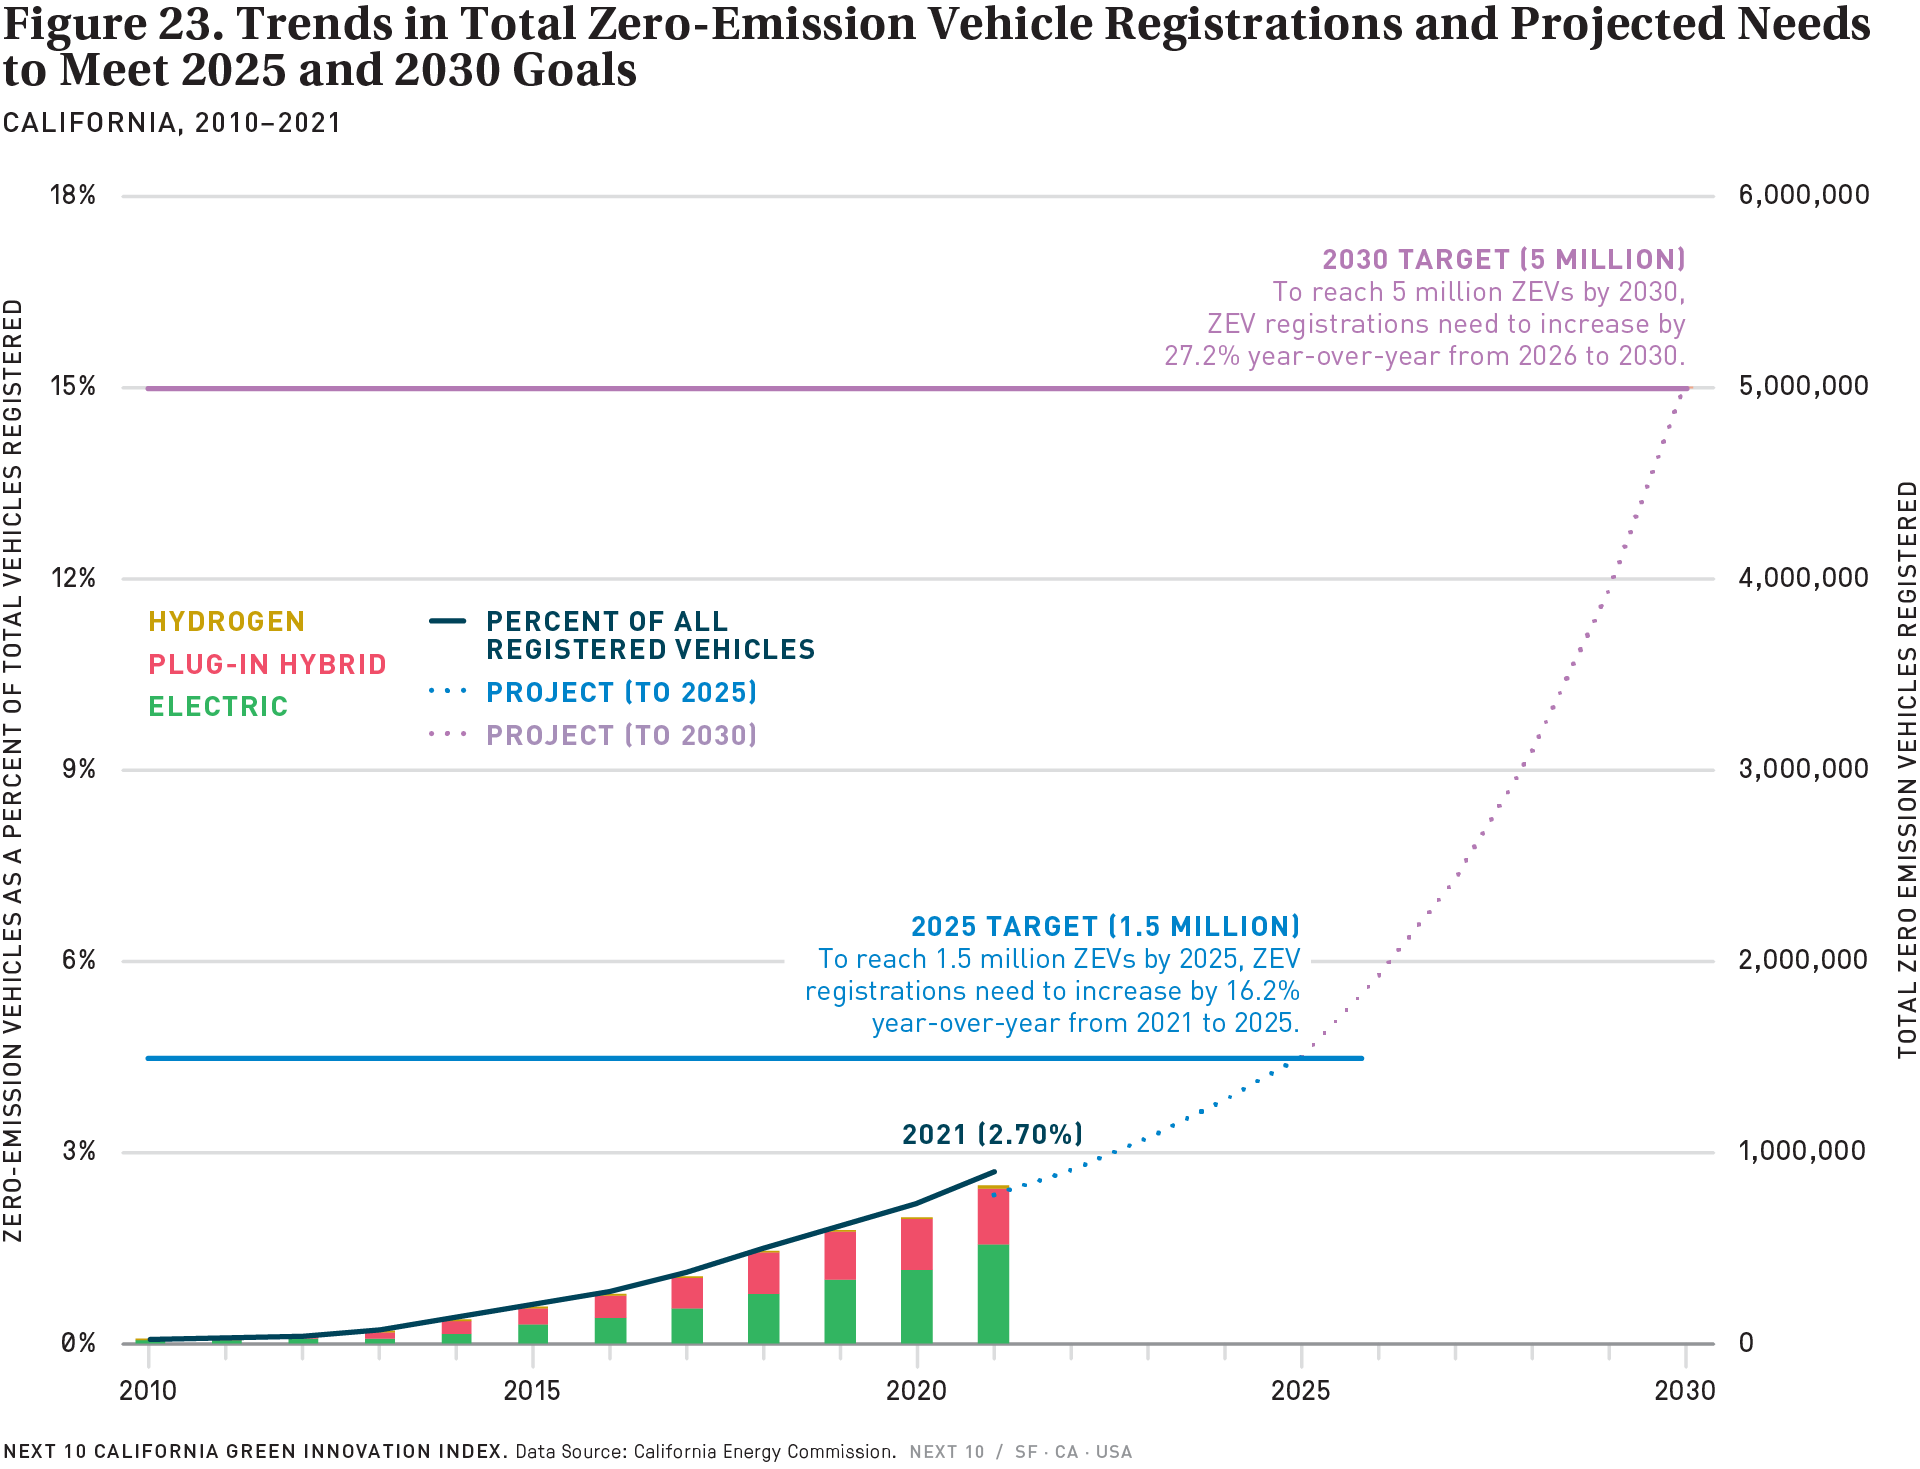
While electric vehicle sales of all classes fell 16.5 percent from 2019 to 2020 due to pandemic-related uncertainty and supply chain challenges, sales data from 2021 paint a more encouraging picture. Electric vehicle sales shot up 79 percent in 2021 compared to 2020, and battery electric vehicles reached 9.5 percent of new vehicle registration in 2021, up from the previous peak of 6.2 percent in 2020. The increase in electric vehicle ownership in rural areas showed the most encouraging signs of growth, increasing by an impressive 57.1 percent in 2021 compared to 2019. The Index’s encouraging data on electric vehicle sales contrasts sharply with its findings on public transit ridership, which plunged a stunning 52 percent in 2020. More concerningly, ridership fell an additional 3 percent in 2021—even after pandemic restrictions began to lift and some people started returning to the office.
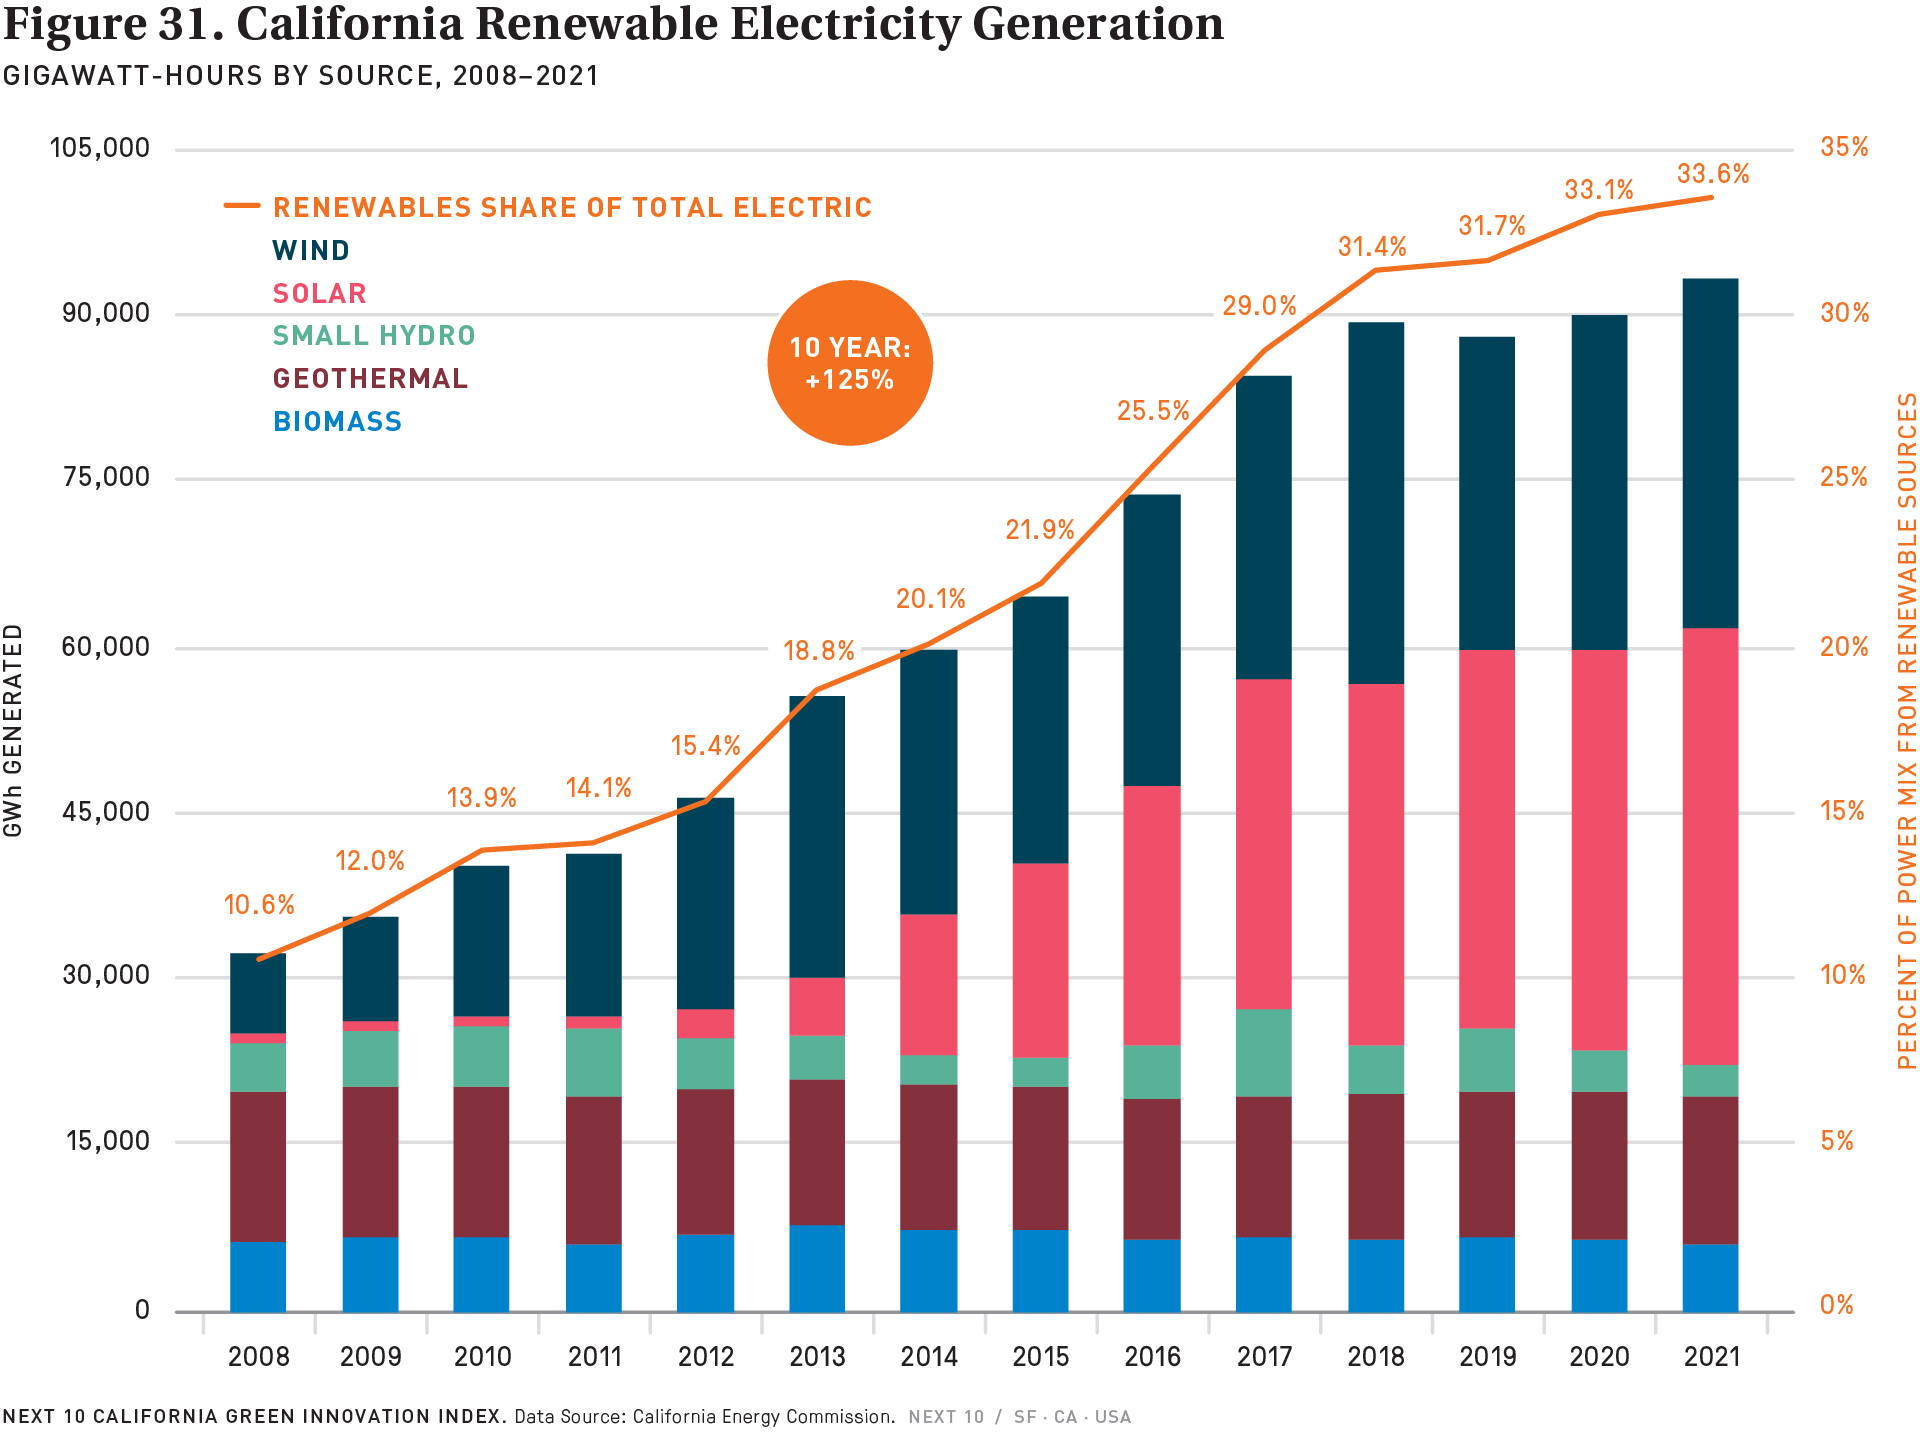
The rise in emissions from in-state generation is likely due in part to summer heat waves and a lack of robust renewable energy growth in recent years. Growth in the amount of renewable energy being generated in California has slowed considerably since 2018—it increased by only 0.5 percent to 33.6 percent of California’s total power mix (imports and in-state, but excluding large hydro) from 2020 to 2021. For California to meet its 2026 RPS goal of 50 percent, the share of electricity generation from renewables would need to increase by 8.3 percent each year from 2021 to 2026, revised upward from the 6.1 percent annual growth rate previously predicted in 2018. While California still has a sizable lead in generation from renewables (33.6% in California vs. 13.8% in the rest of the U.S.), the pace of growth has slowed in California (+2.2%) compared to the U.S. (+3.5%) relative to 2008.
While renewable growth has slowed since 2018, California added significant battery storage in 2021—more than 7.5 times the amount in 2020. This is crucial to reducing curtailments of wind and solar that have been increasing over the last four years, particularly in 2022 through October. Compared to 2021, there has been 57.1 percent more curtailment in solar and 47.5 percent more in wind in 2022 through the end of October. Curtailment tends to be at the highest levels from March to June and during the middle of the day (from 10 AM to 2 PM), when there is an oversupply of solar, and at lower levels from September to December.
The online 2022 California Green Innovation Index can be found at https://greeninnovationindex.org/.
Next 10 owns the rights to this publication. Any usage of content from this publication is subject to our Terms of Use.


Key Transportation-Sector Findings Include:
- Transportation-sector emissions accounted for 37.9% of California’s total emissions in 2020, down from 41.2% in 2019.
- Consumer preferences continued to shift towards pickup trucks, mini-vans, and SUVS in 2021, as the light truck sales (+16.6%) more than doubled the sale of cars (+7.1%).
- Natural gas-powered vehicle registrations fell 23.2% in 2021, while registrations of electric vehicles increased by 34%, compared to 2020.
- While sales of battery electric, plug-in hybrid, and hydrogen vehicles increased significantly in 2021, they still only accounted for 2.8% of all registered on-road vehicles in California in 2021, up from 2.2% in 2020.
Key Renewable Energy Findings Include:
- Emissions from California’s in-state electricity generation increased by 6.3% in 2020, due to increased reliance on natural gas power plants. However, emissions from the state’s total electric power sector (import and in-state) still ticked down by 1.1%, due to a significant 14.1% emissions reduction from electricity imports.
- For California to meet its 2026 goal of 50% of generation from RPS-eligible renewable sources, the share of electricity generation from renewables would need to increase by 8.3% each year from 2021 to 2026, revised upward from the 6.1% annual growth rate previously predicted in 2018.
- Ongoing drought is significantly hampering California’s electricity generation from hydroelectric. Small hydro made up just 1% of California’s total power generation in 2021—one of the lowest percentages since the RPS program’s inception in 2002.
- California now imports 30.1% of its electricity supply from neighboring markets, with about 61% coming from the Southwest and 39% from the Northwest.
- Electricity generation from RPS-eligible renewable sources and large hydroelectric power made up 42.9% of the power mix in 2021, a slight decrease from 45.3% the year before.
- Electricity curtailment—or the deliberate reduction in output below what could have been produced due to a misalignment between electricity supply and demand—spiked in 2022. As of October 2022, 56.6% more electricity was curtailed than in 2021. Continued investment in battery storage can help reduce the need for curtailment by storing electricity for use during high-demand hours.
Other Key Findings Include:
- Emissions from the use of Substitutes for Ozone-Depleting Substances (substitutes for ODS) are the fastest-growing source of emissions in California. In 2020, GHG emissions from substitutes for ODS from all economic sectors accounted for 5.6% of total included statewide emissions, up from the 2019 share (4.9%) and a considerably larger share compared to 2010 (2.9%) and 2000 (1.2%). This year, the U.S. finally moved to ratify the global agreement to phase out the use of hydrofluorocarbons (HFCs) known as the Kigali Amendment to the Montreal Protocol—joining the global effort to tackle this concerning source of climate pollution.
- Natural gas combustion in the residential sector declined by 0.64% from 2019 to 2020.
- Emissions from the residential and commercial sectors were down by 0.7% and by 4.1%, respectively, in 2020 compared to 2019.
- Natural gas consumption (per capita) in the residential sector was 21.6% lower in 2020 than in 2000—suggesting both a gradual gain in efficiency and a shift towards electricity for heating.
Next 10 owns the copyright to all graphics in this report, and they are available for download and limited use, subject to our Terms of Use. Please contact Next 10 at info@next10.org with any questions.
To view and download all of the figures in this report, visit GreenInnovationIndex.org