Publications

2021 California Green Innovation Index
For the first time since Next 10 began producing the Index in 2008, the 13th annual California Green Innovation Index is now primarily digital, allowing readers to learn and interact with the findings of the report in a new medium in 2021. To get the full experience of the report's findings, visit the California Green Innovation Index website.
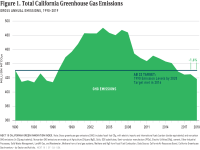
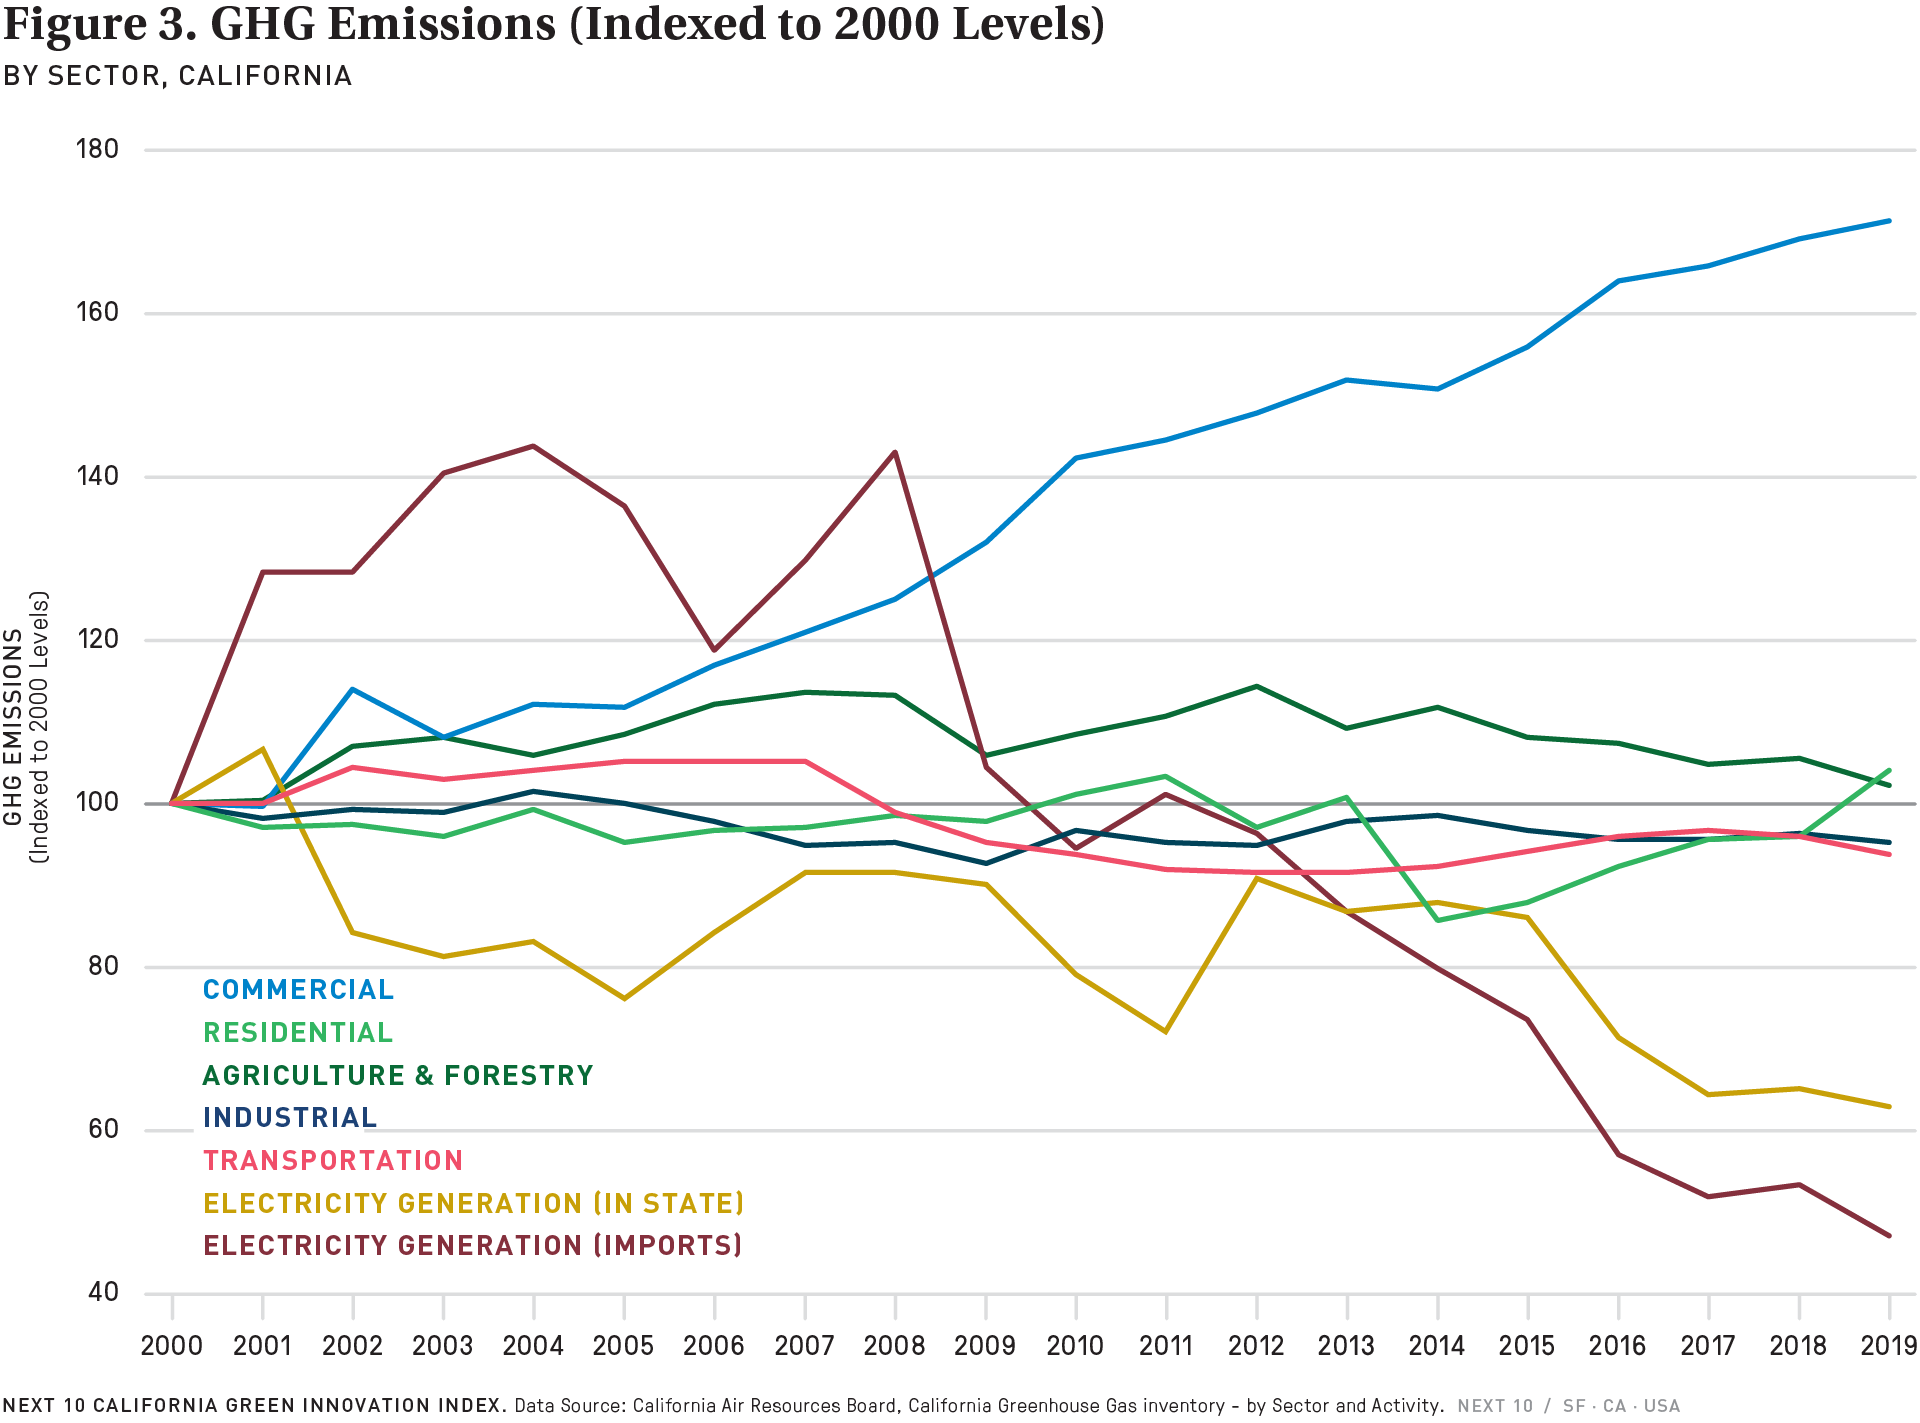
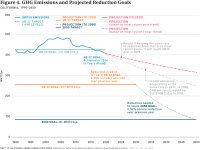
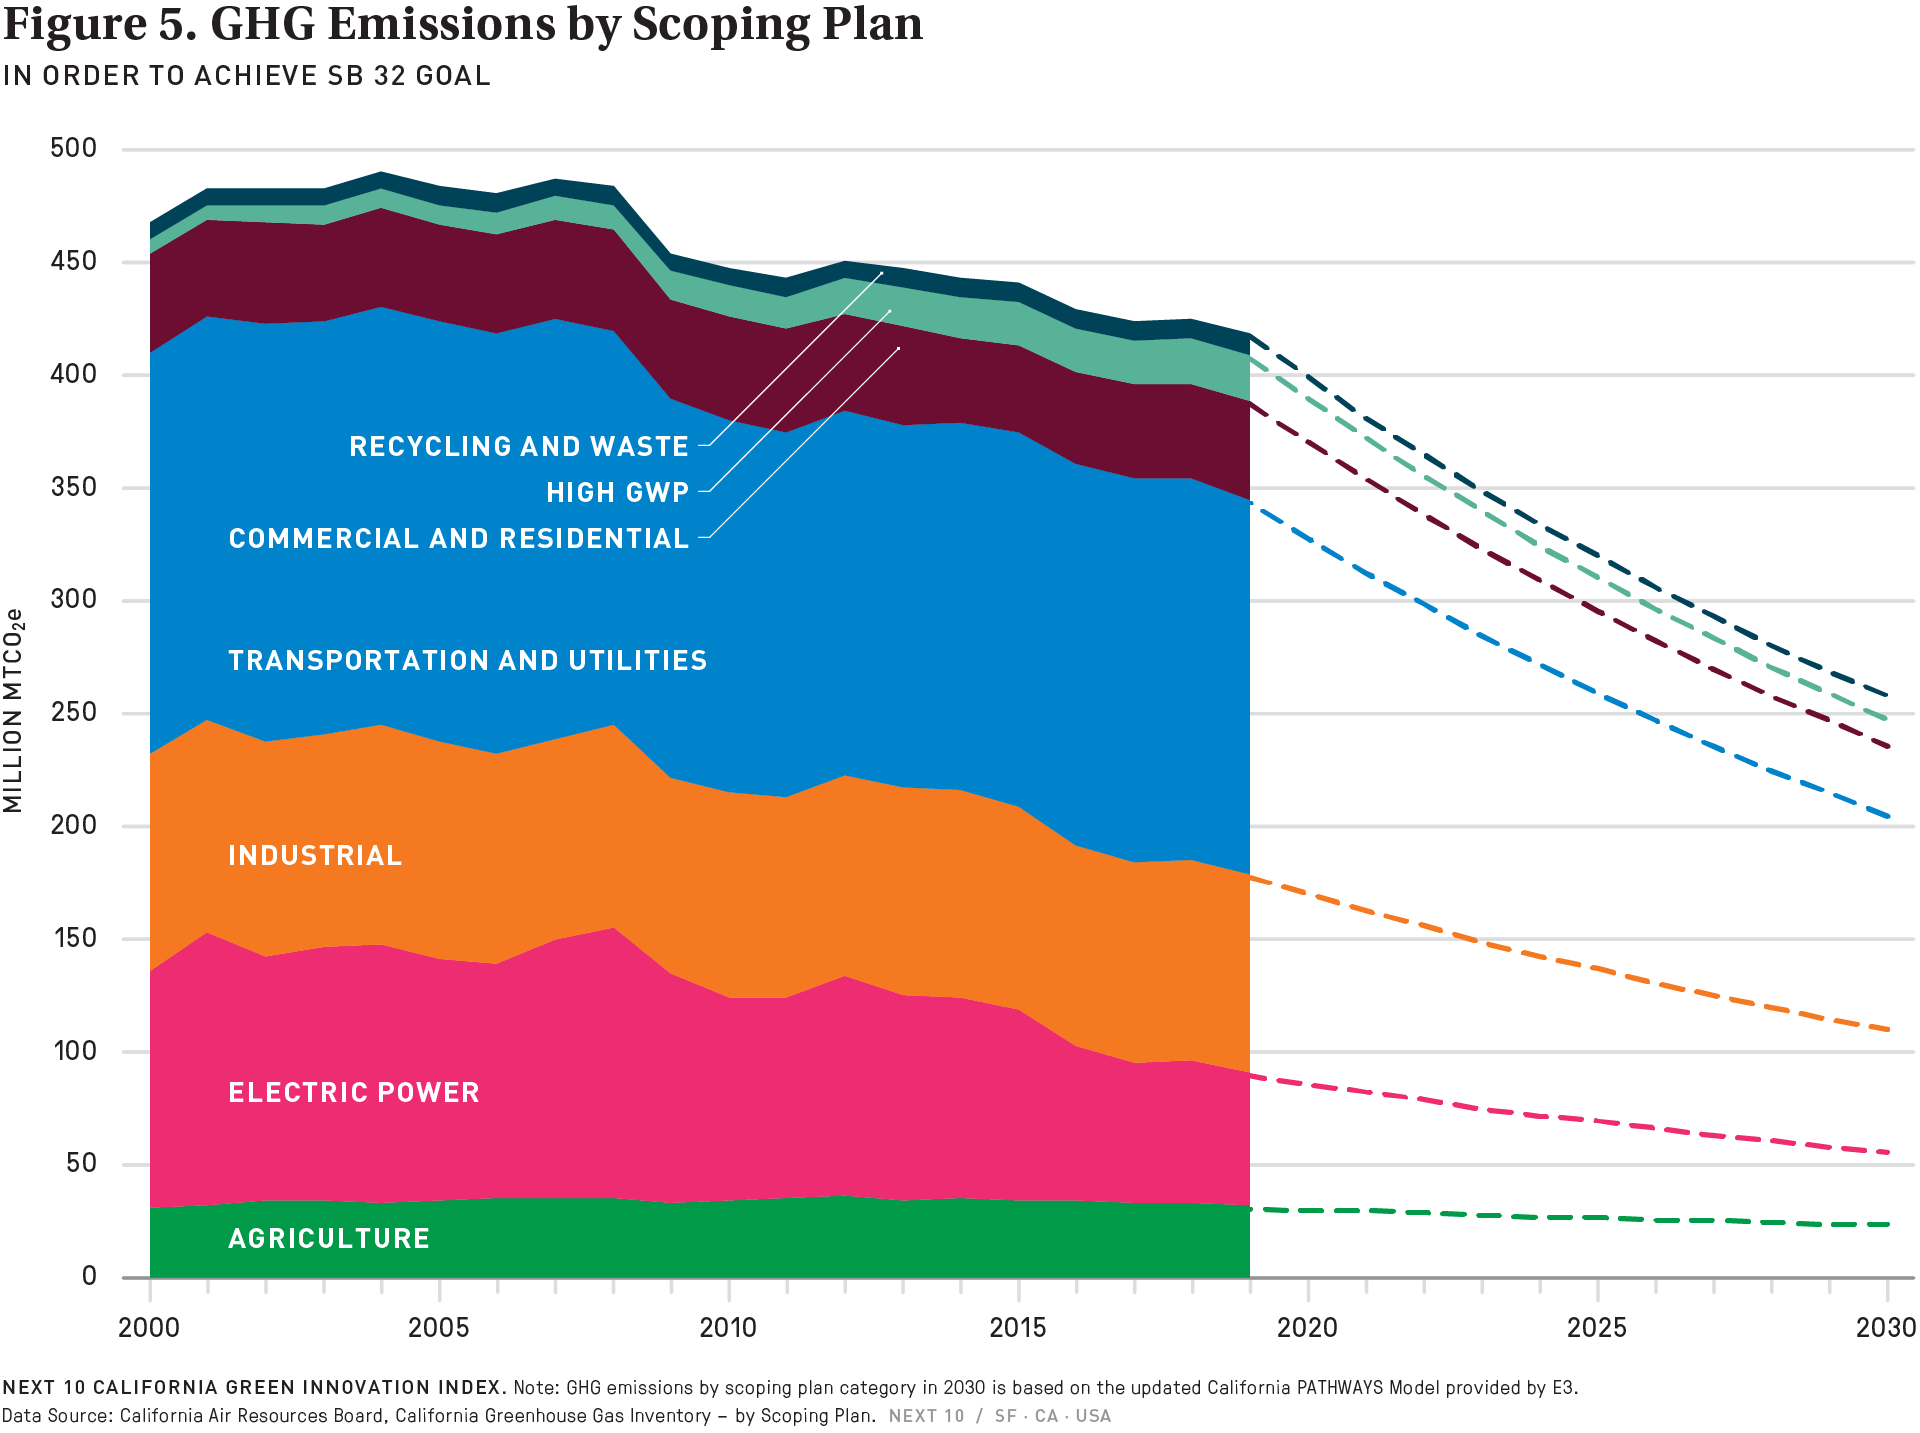
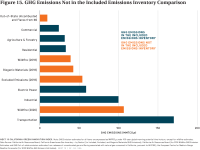
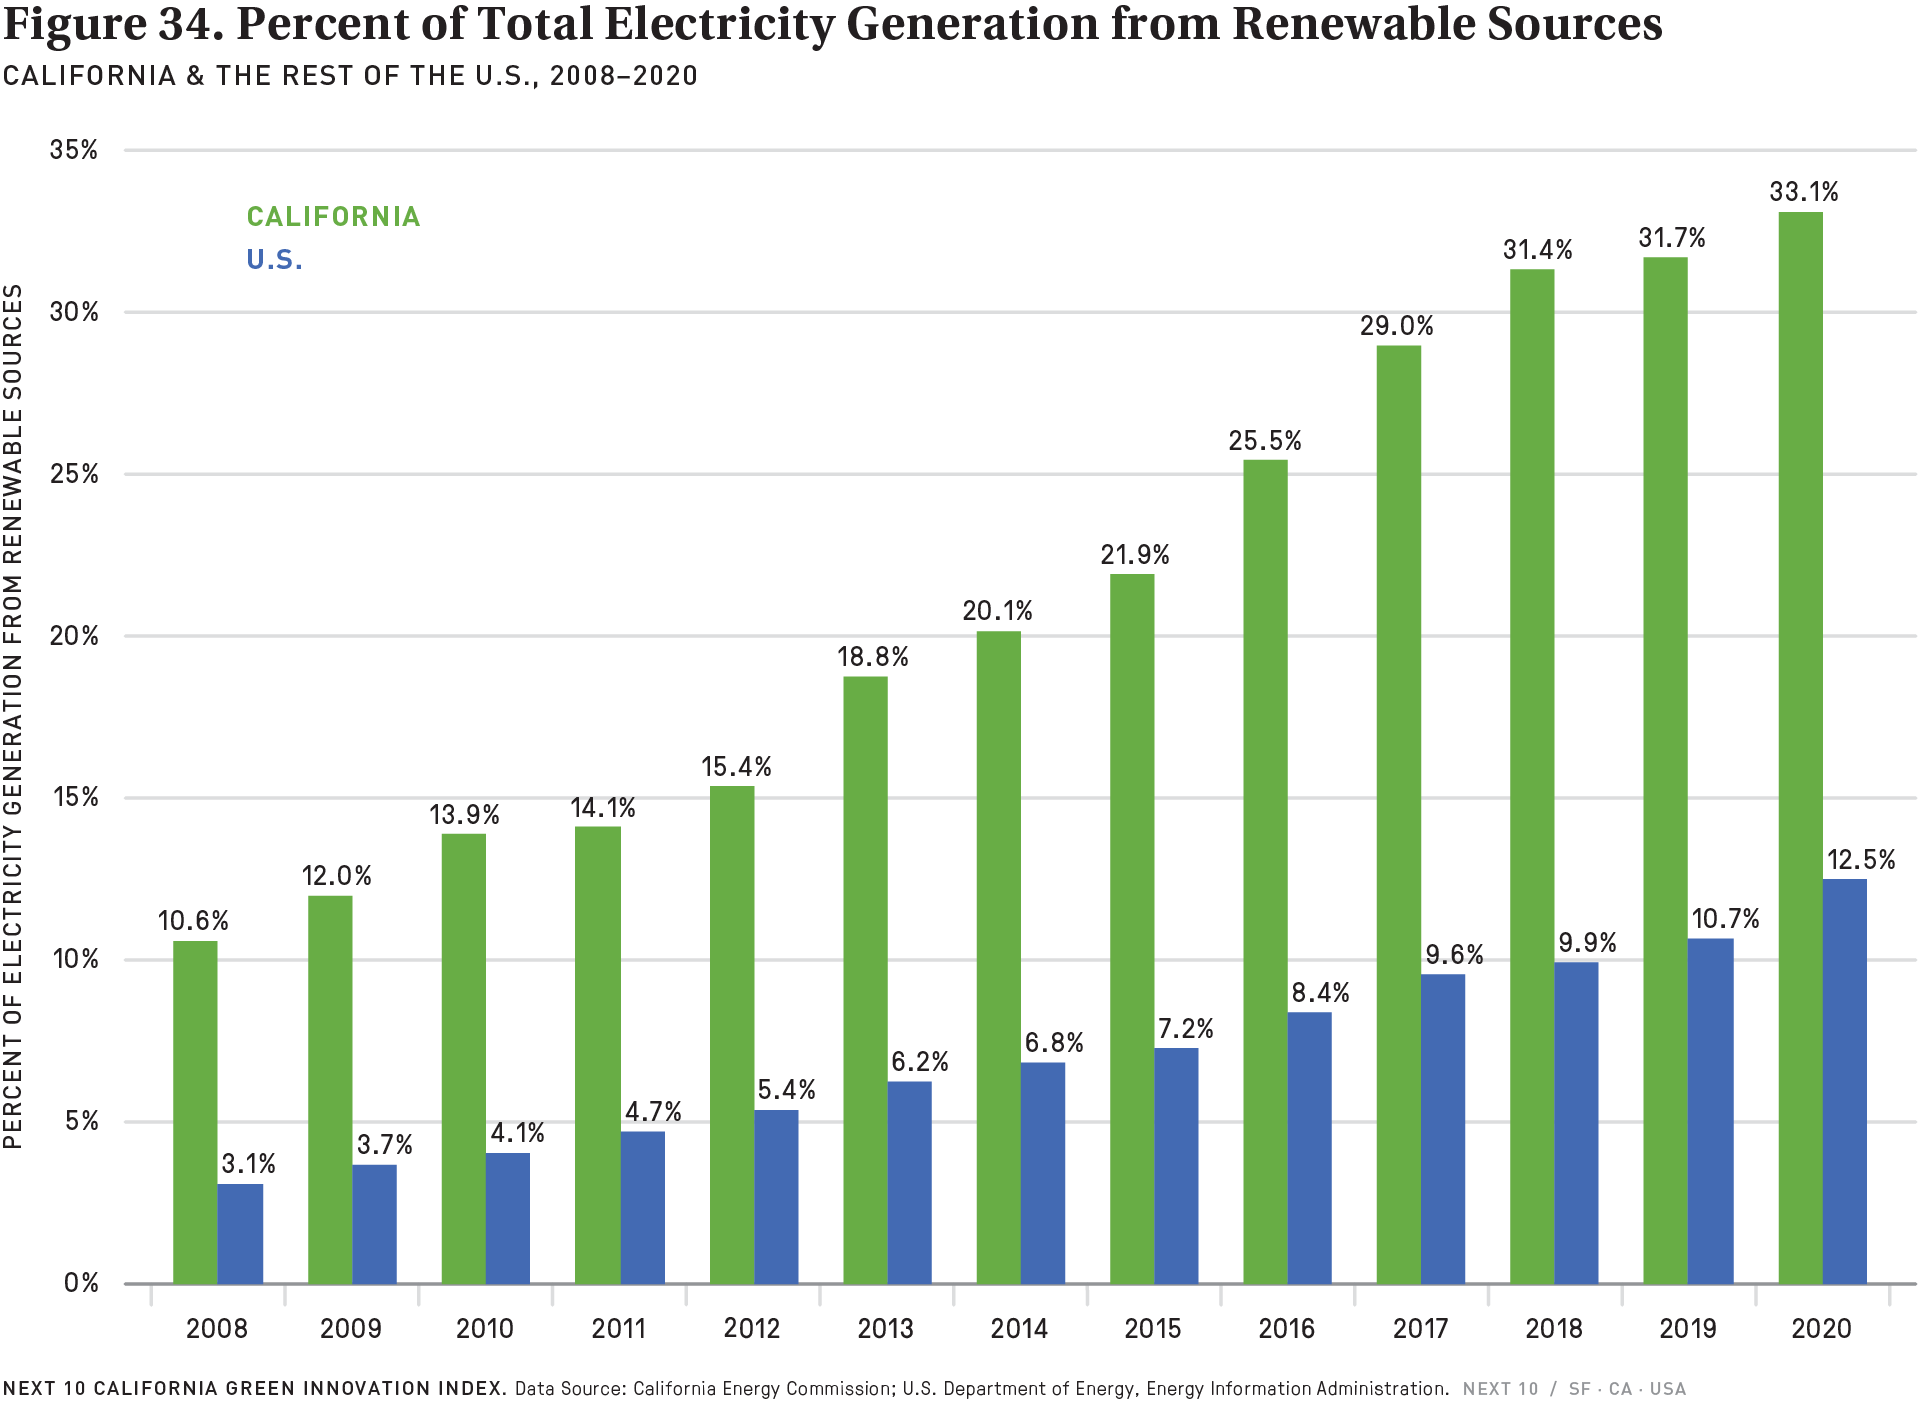
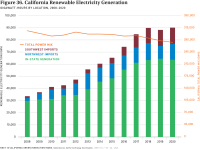
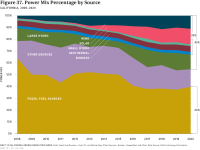
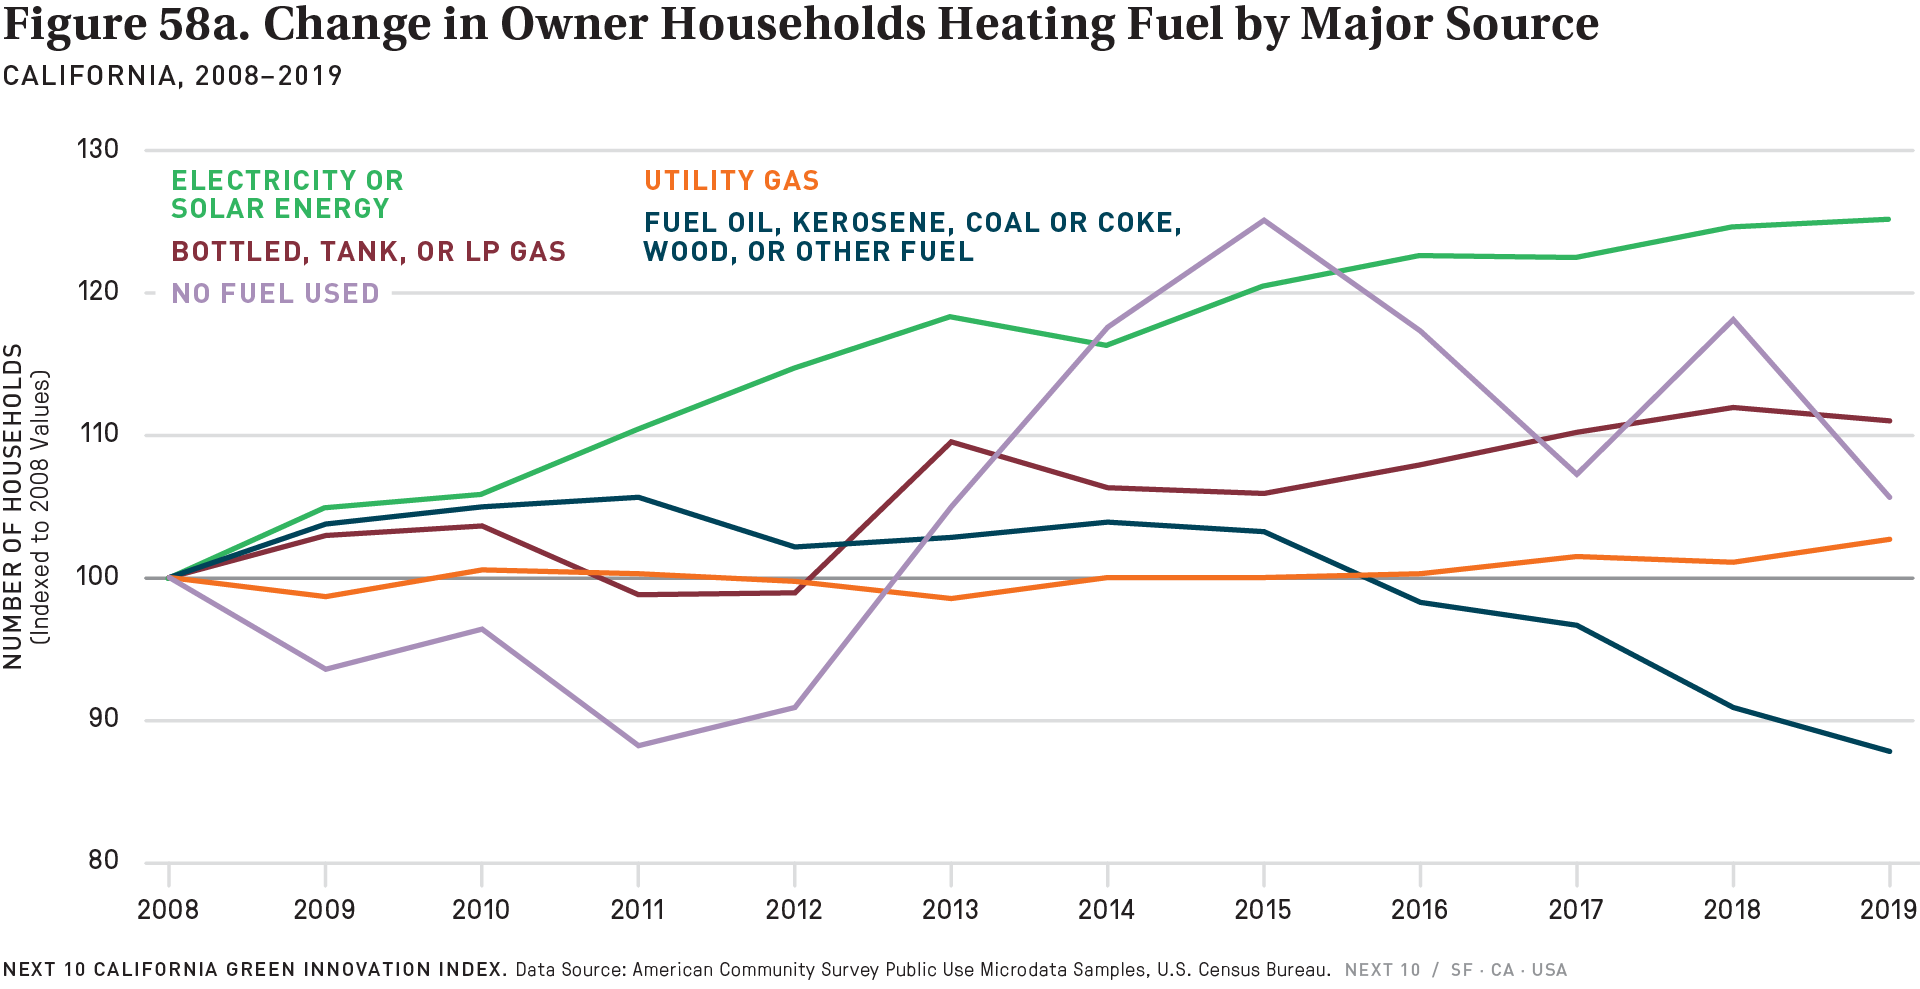
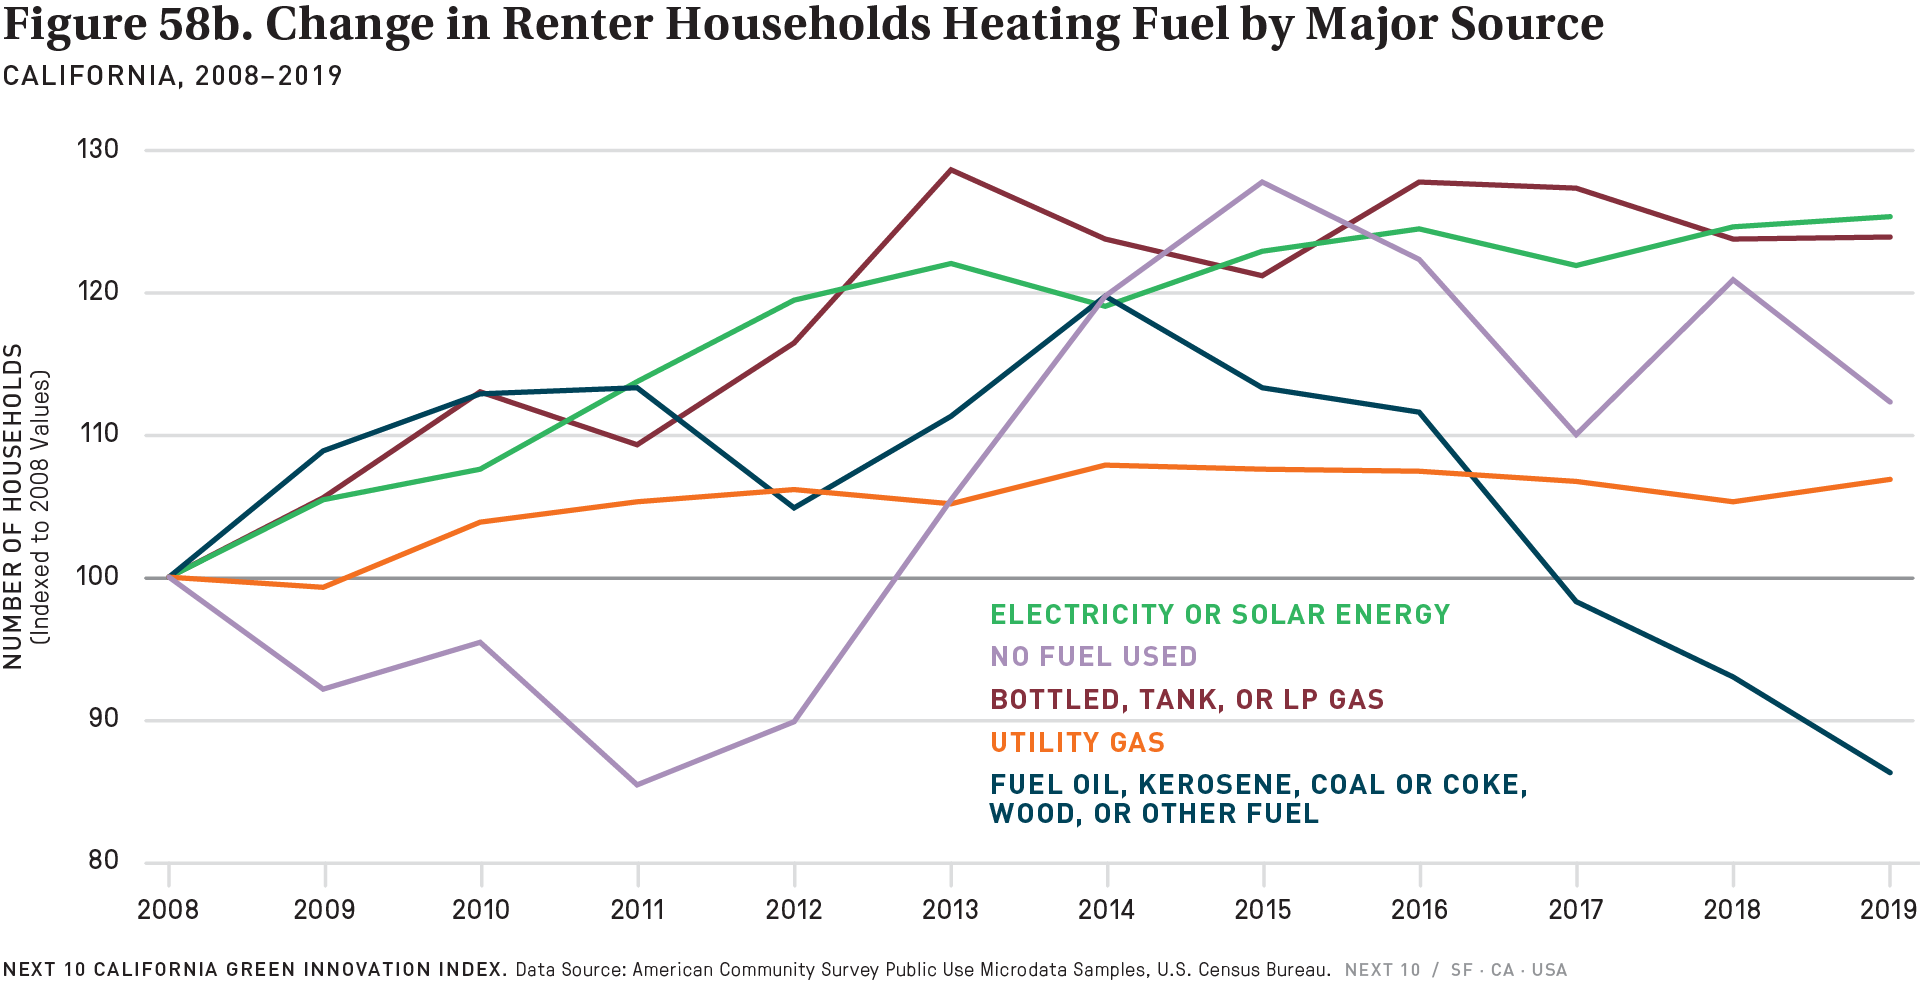
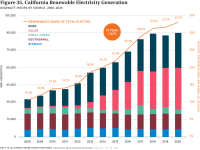
The report finds total greenhouse gas emissions dropped 1.6 percent between 2018 and 2019—the second largest percentage decrease since 2010—but far short of what is needed to comply with California’s mandate to cut emissions 40 percent below 1990 levels by 2030. California must now sustain a 4.3 percent annual decrease through 2030—a reduction that is more than 2.5 times greater than was achieved in 2019. While California’s vibrant clean energy economy is supporting strong job numbers, it is failing to deliver the necessary annual emissions reductions, as slowing renewable energy growth, underwhelming transportation sector gains, and a worrisome cross-sector over-dependence on natural gas pose major challenges for the state. The consumption of natural gas in homes and buildings in California is on the rise—up 15.3 percent in the commercial sector and 17.8 percent in residential homes since 2014, and up 19.8 percent in the industrial sector since 2009.
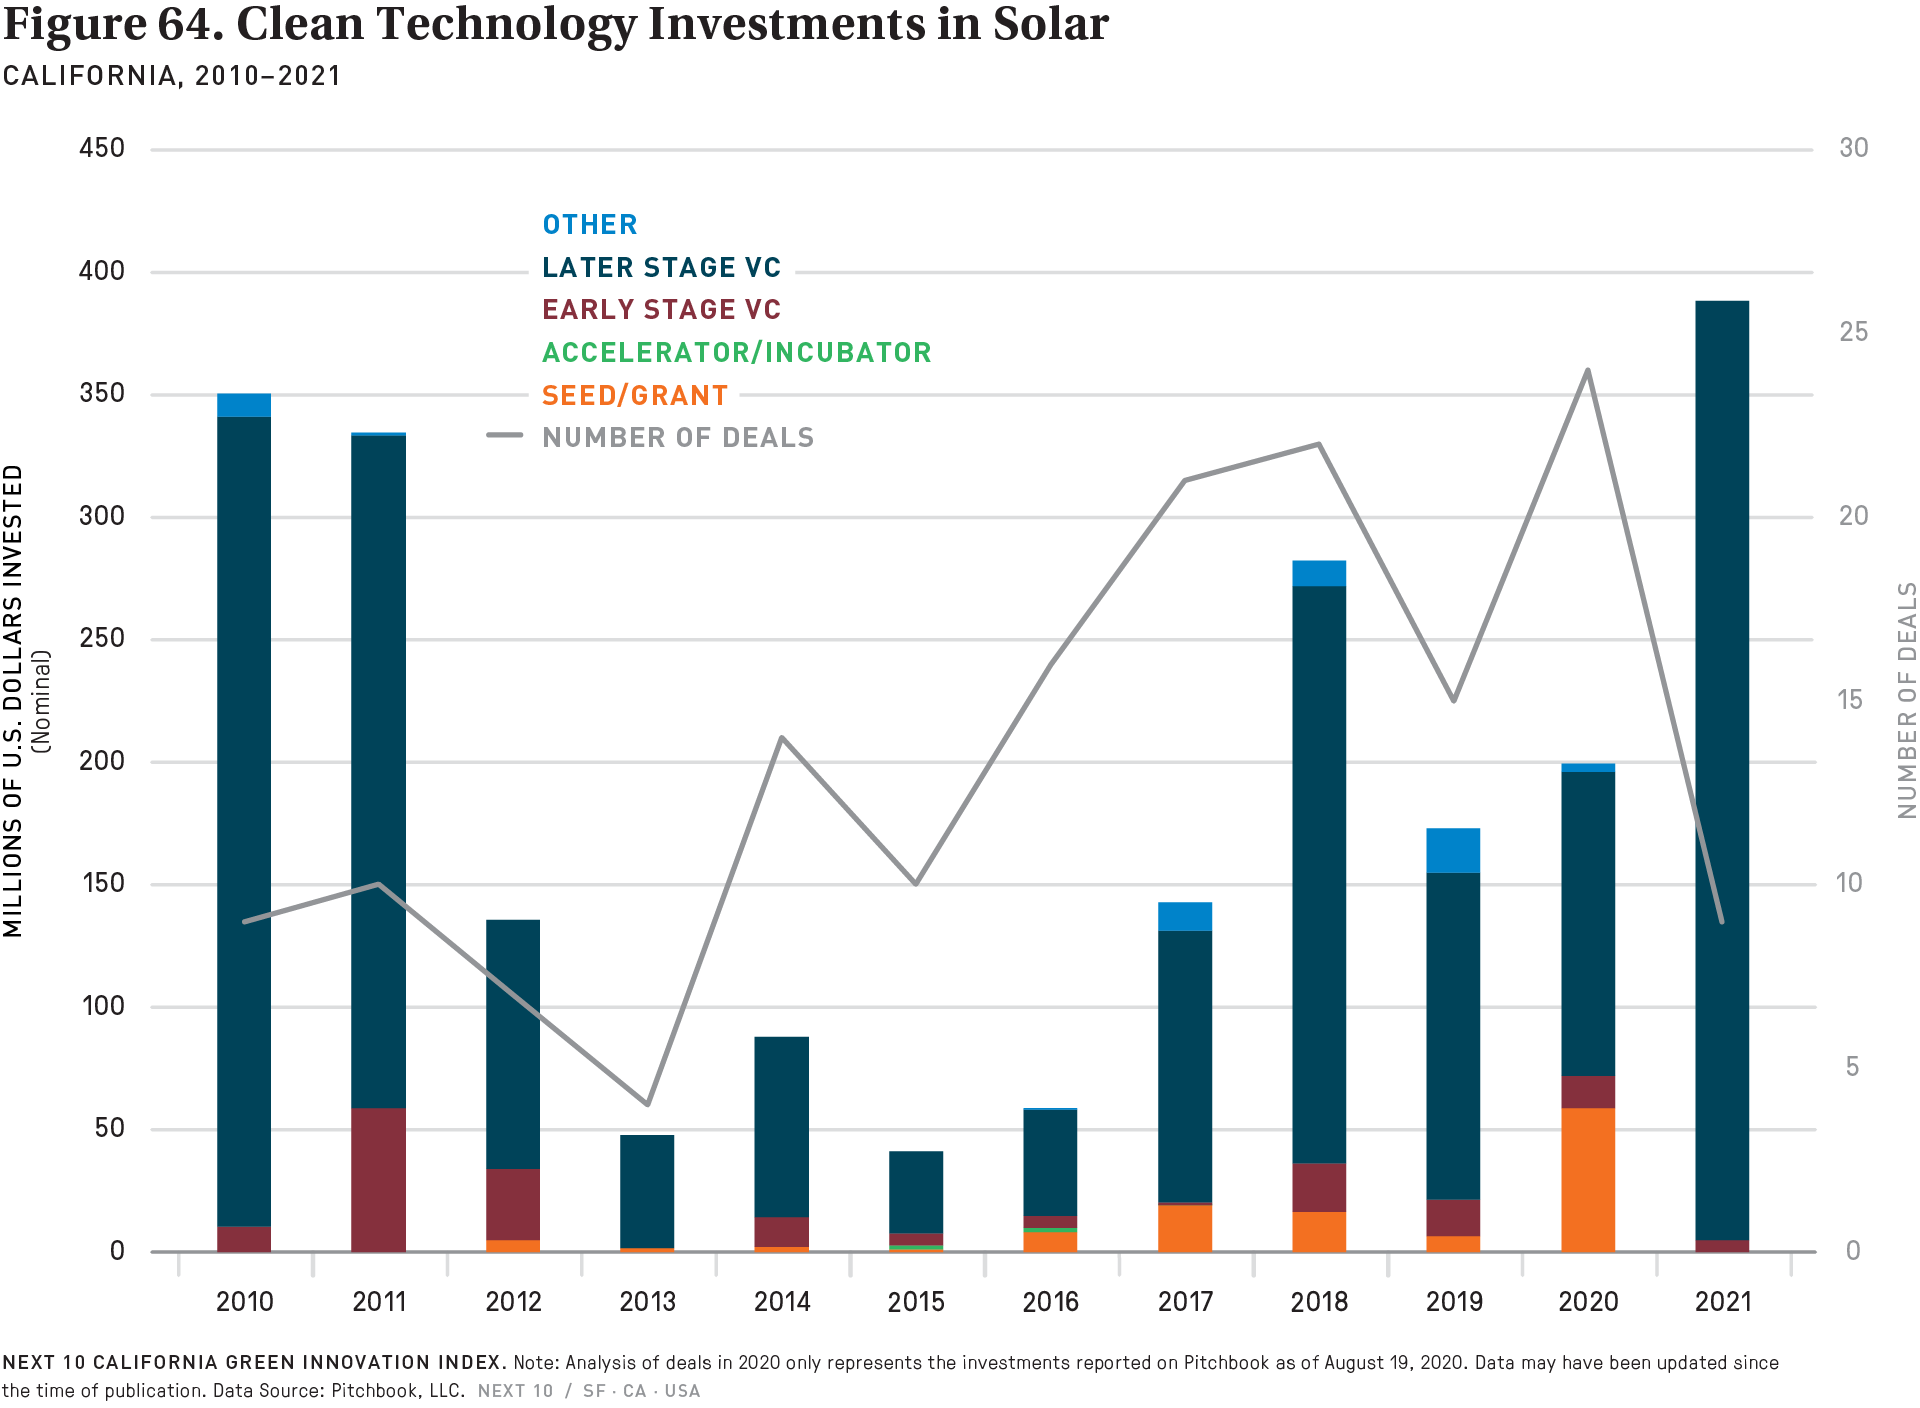
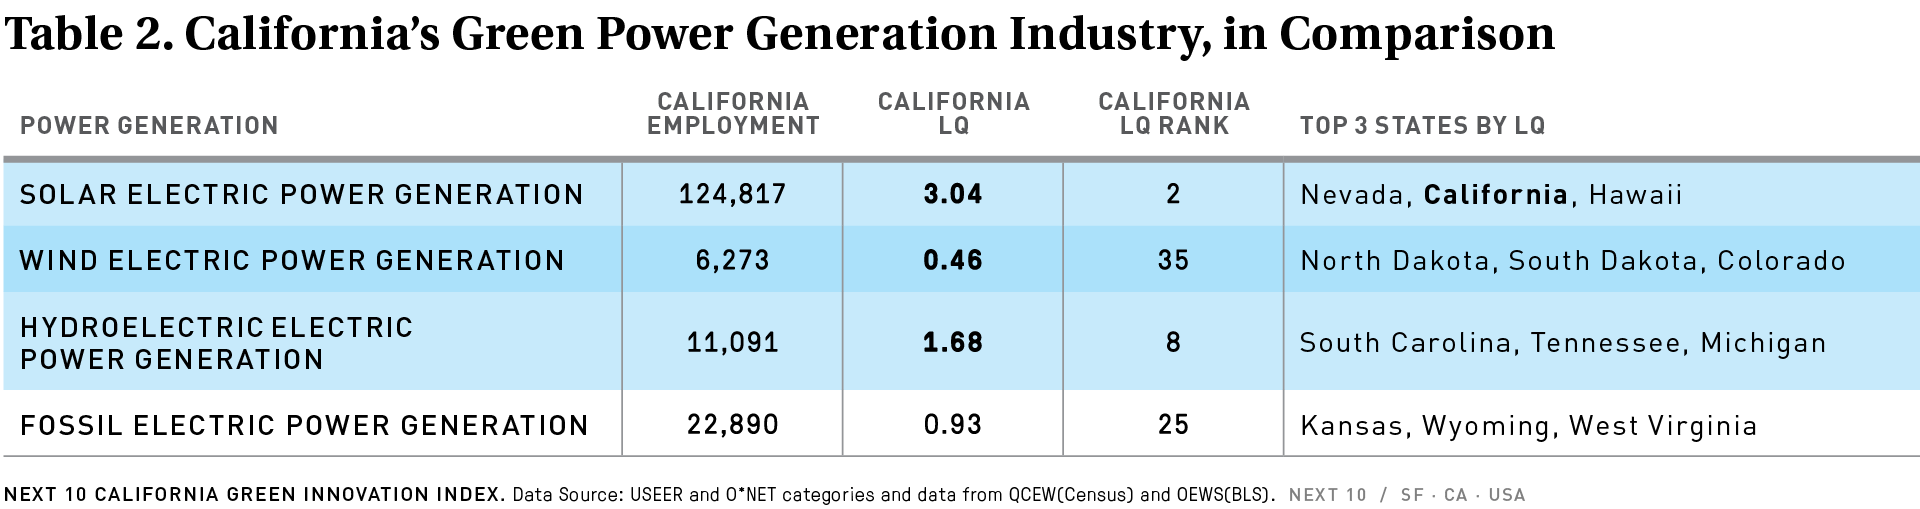
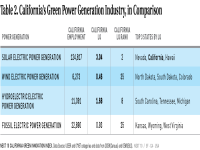
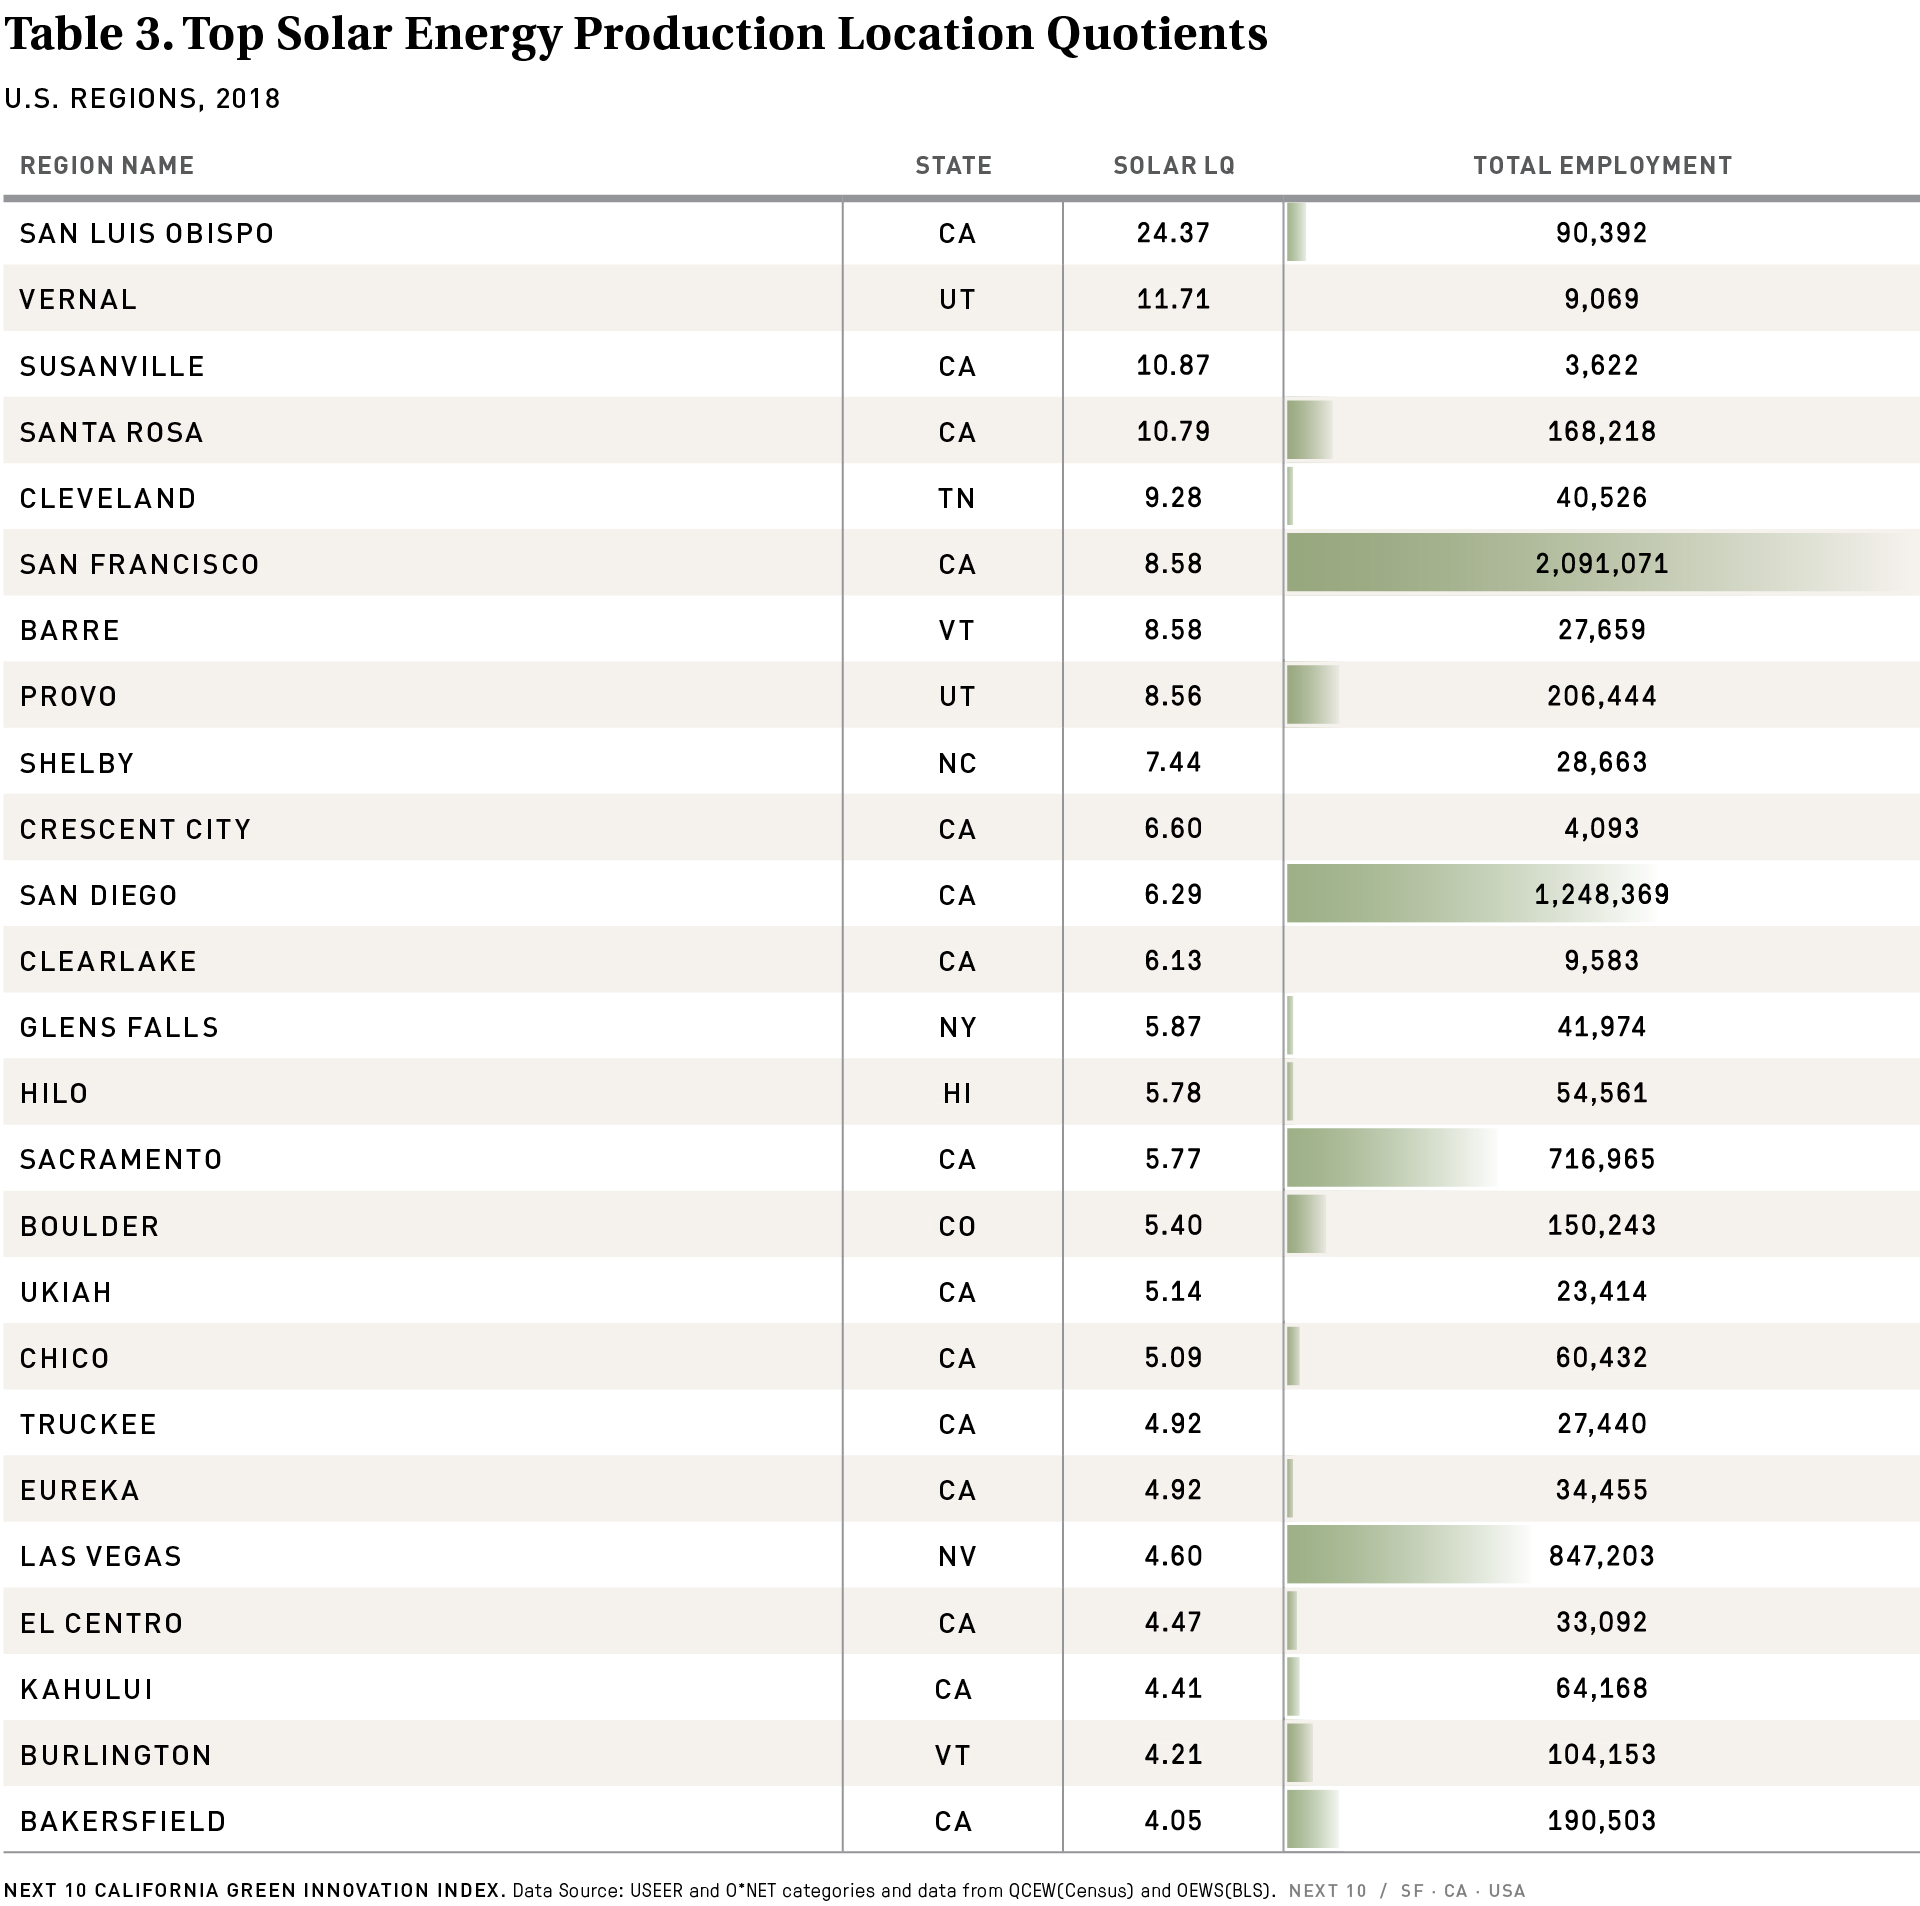
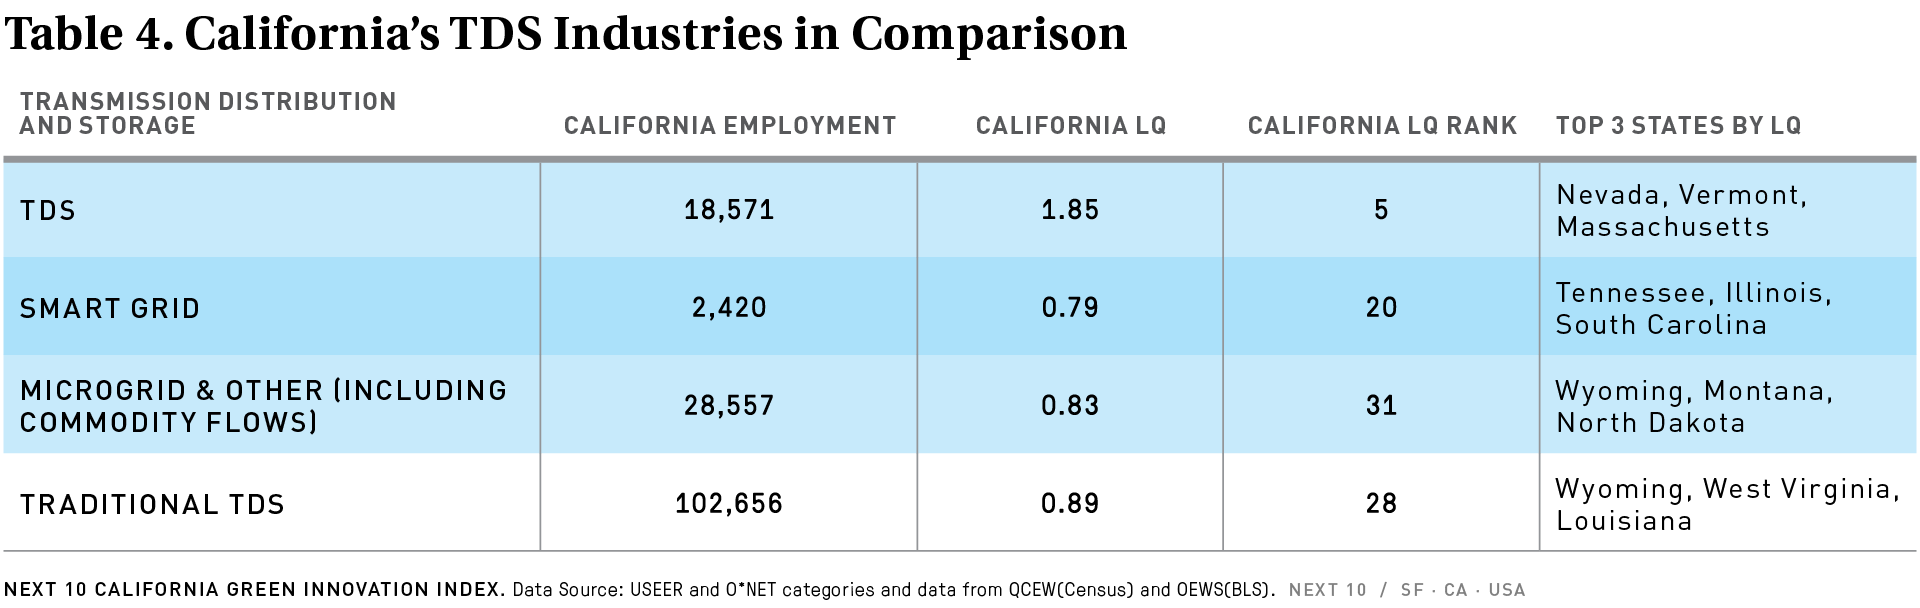
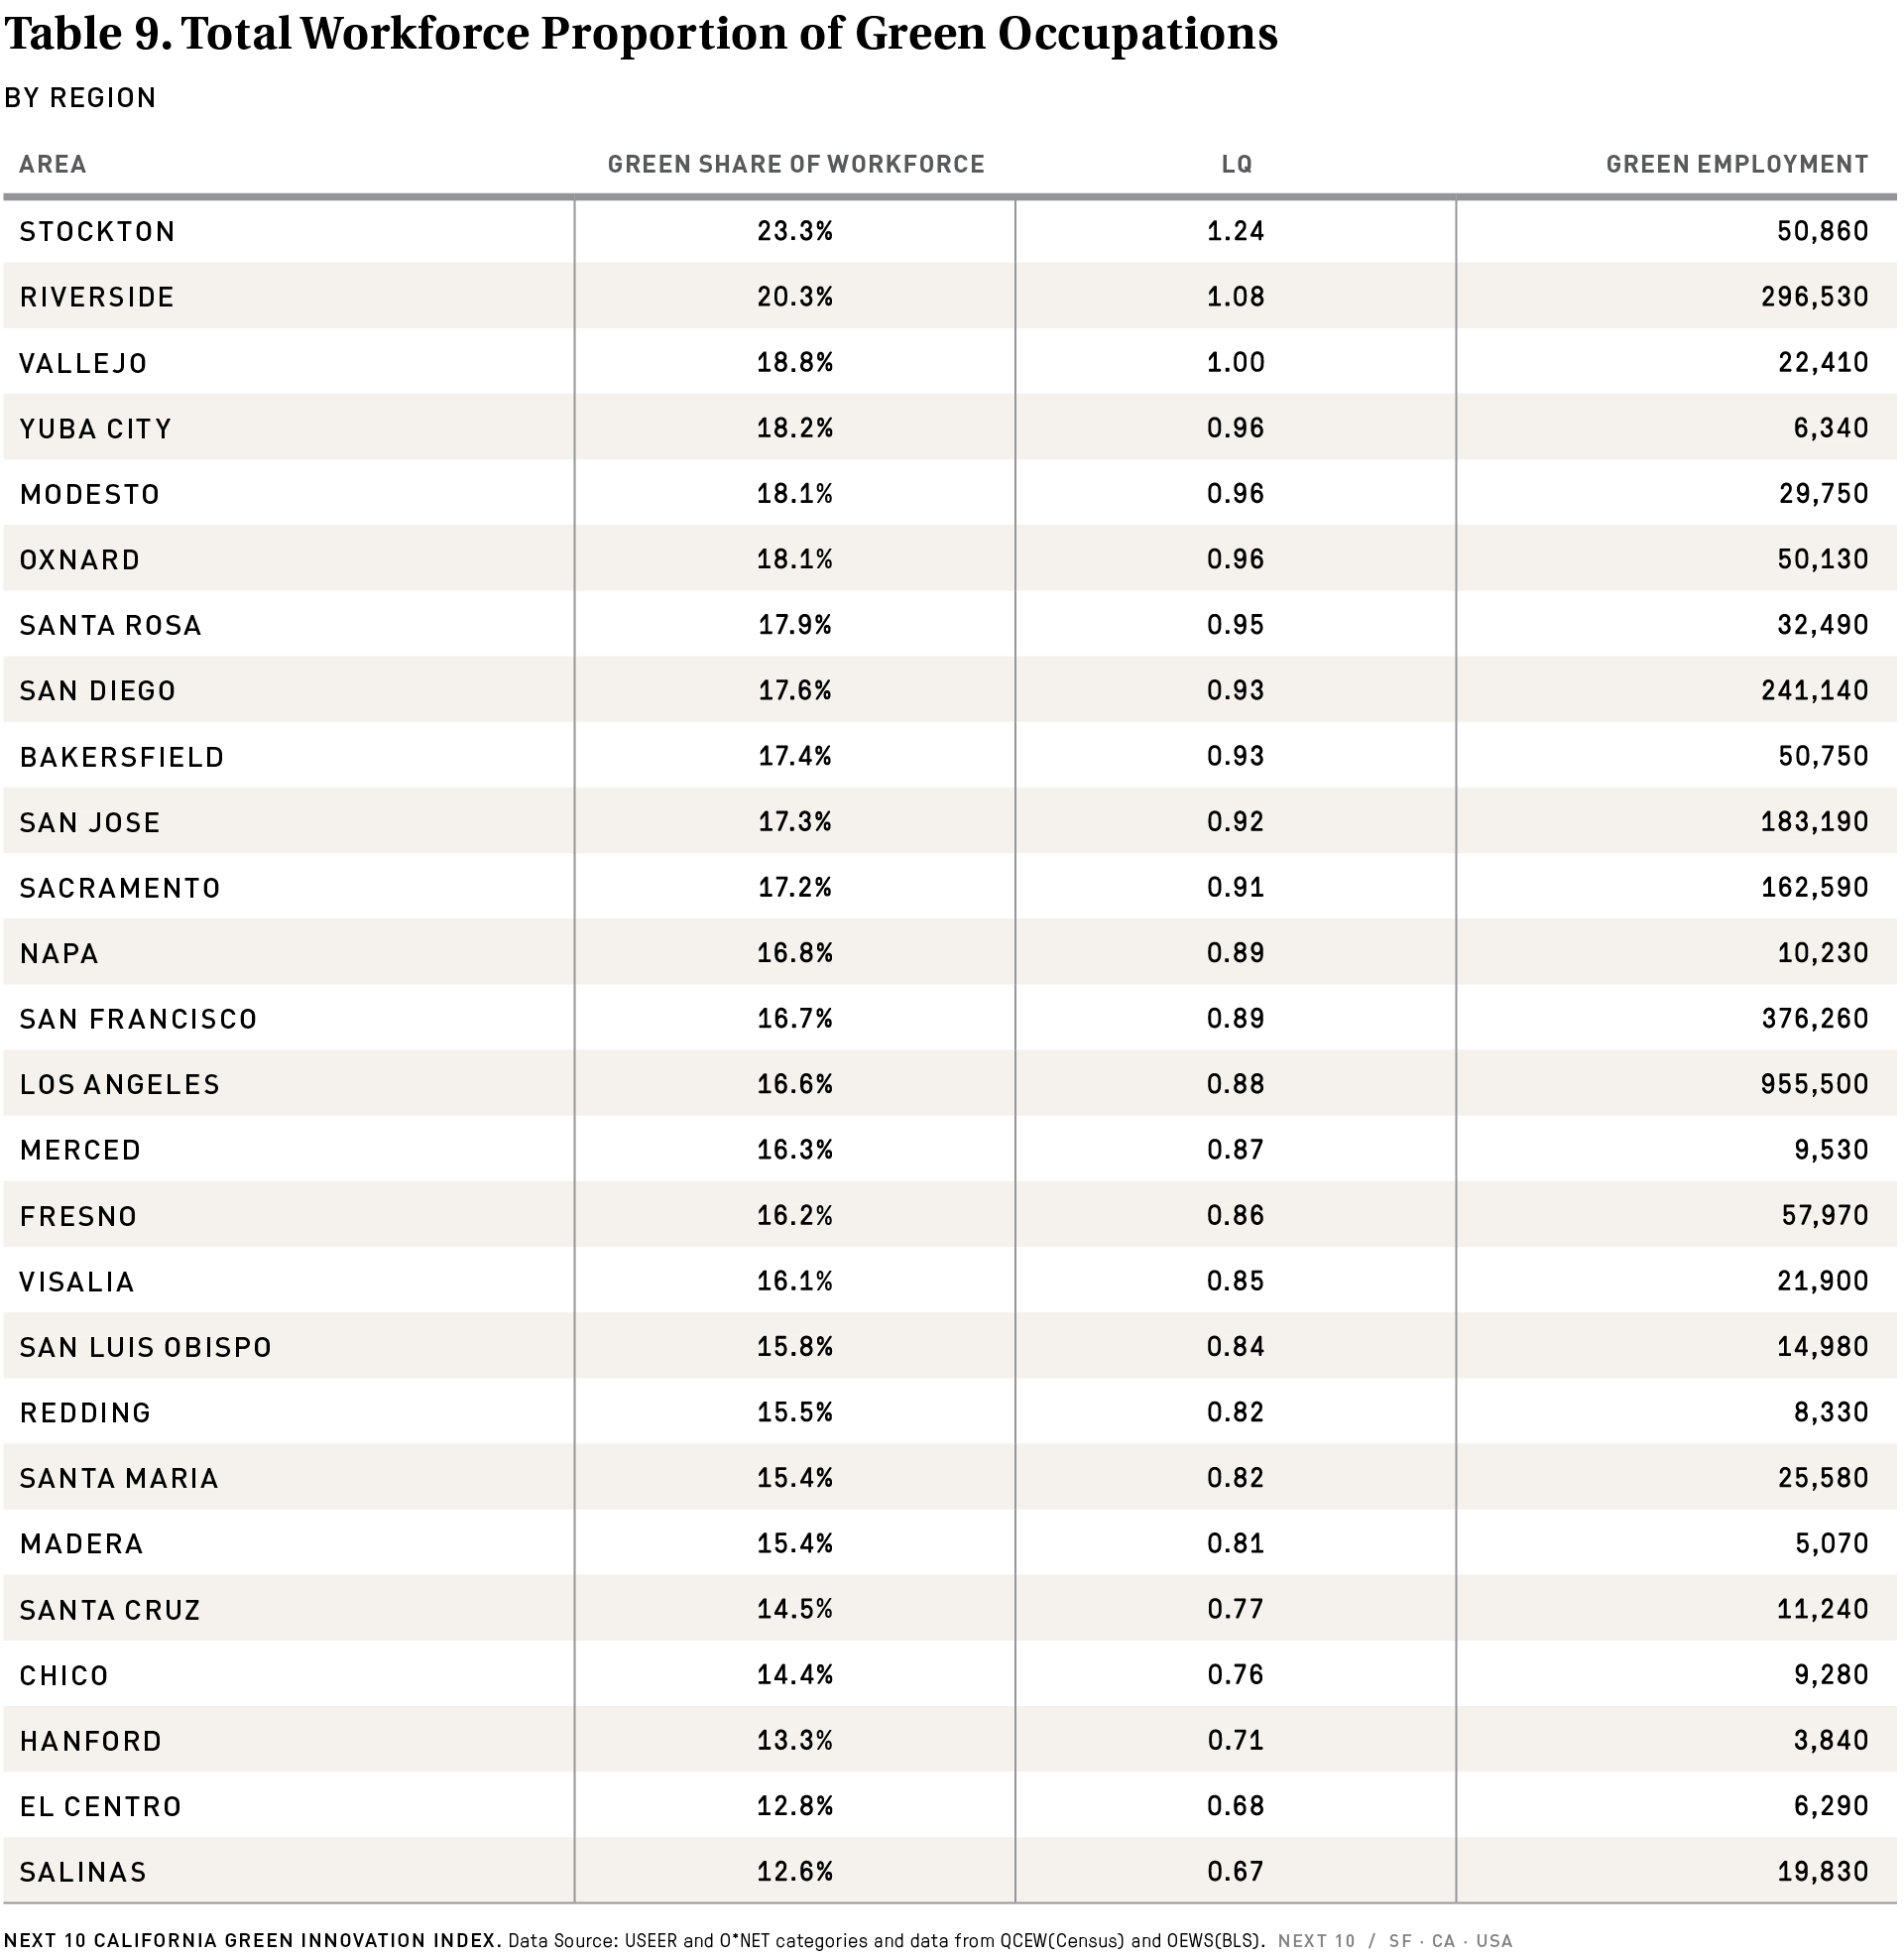
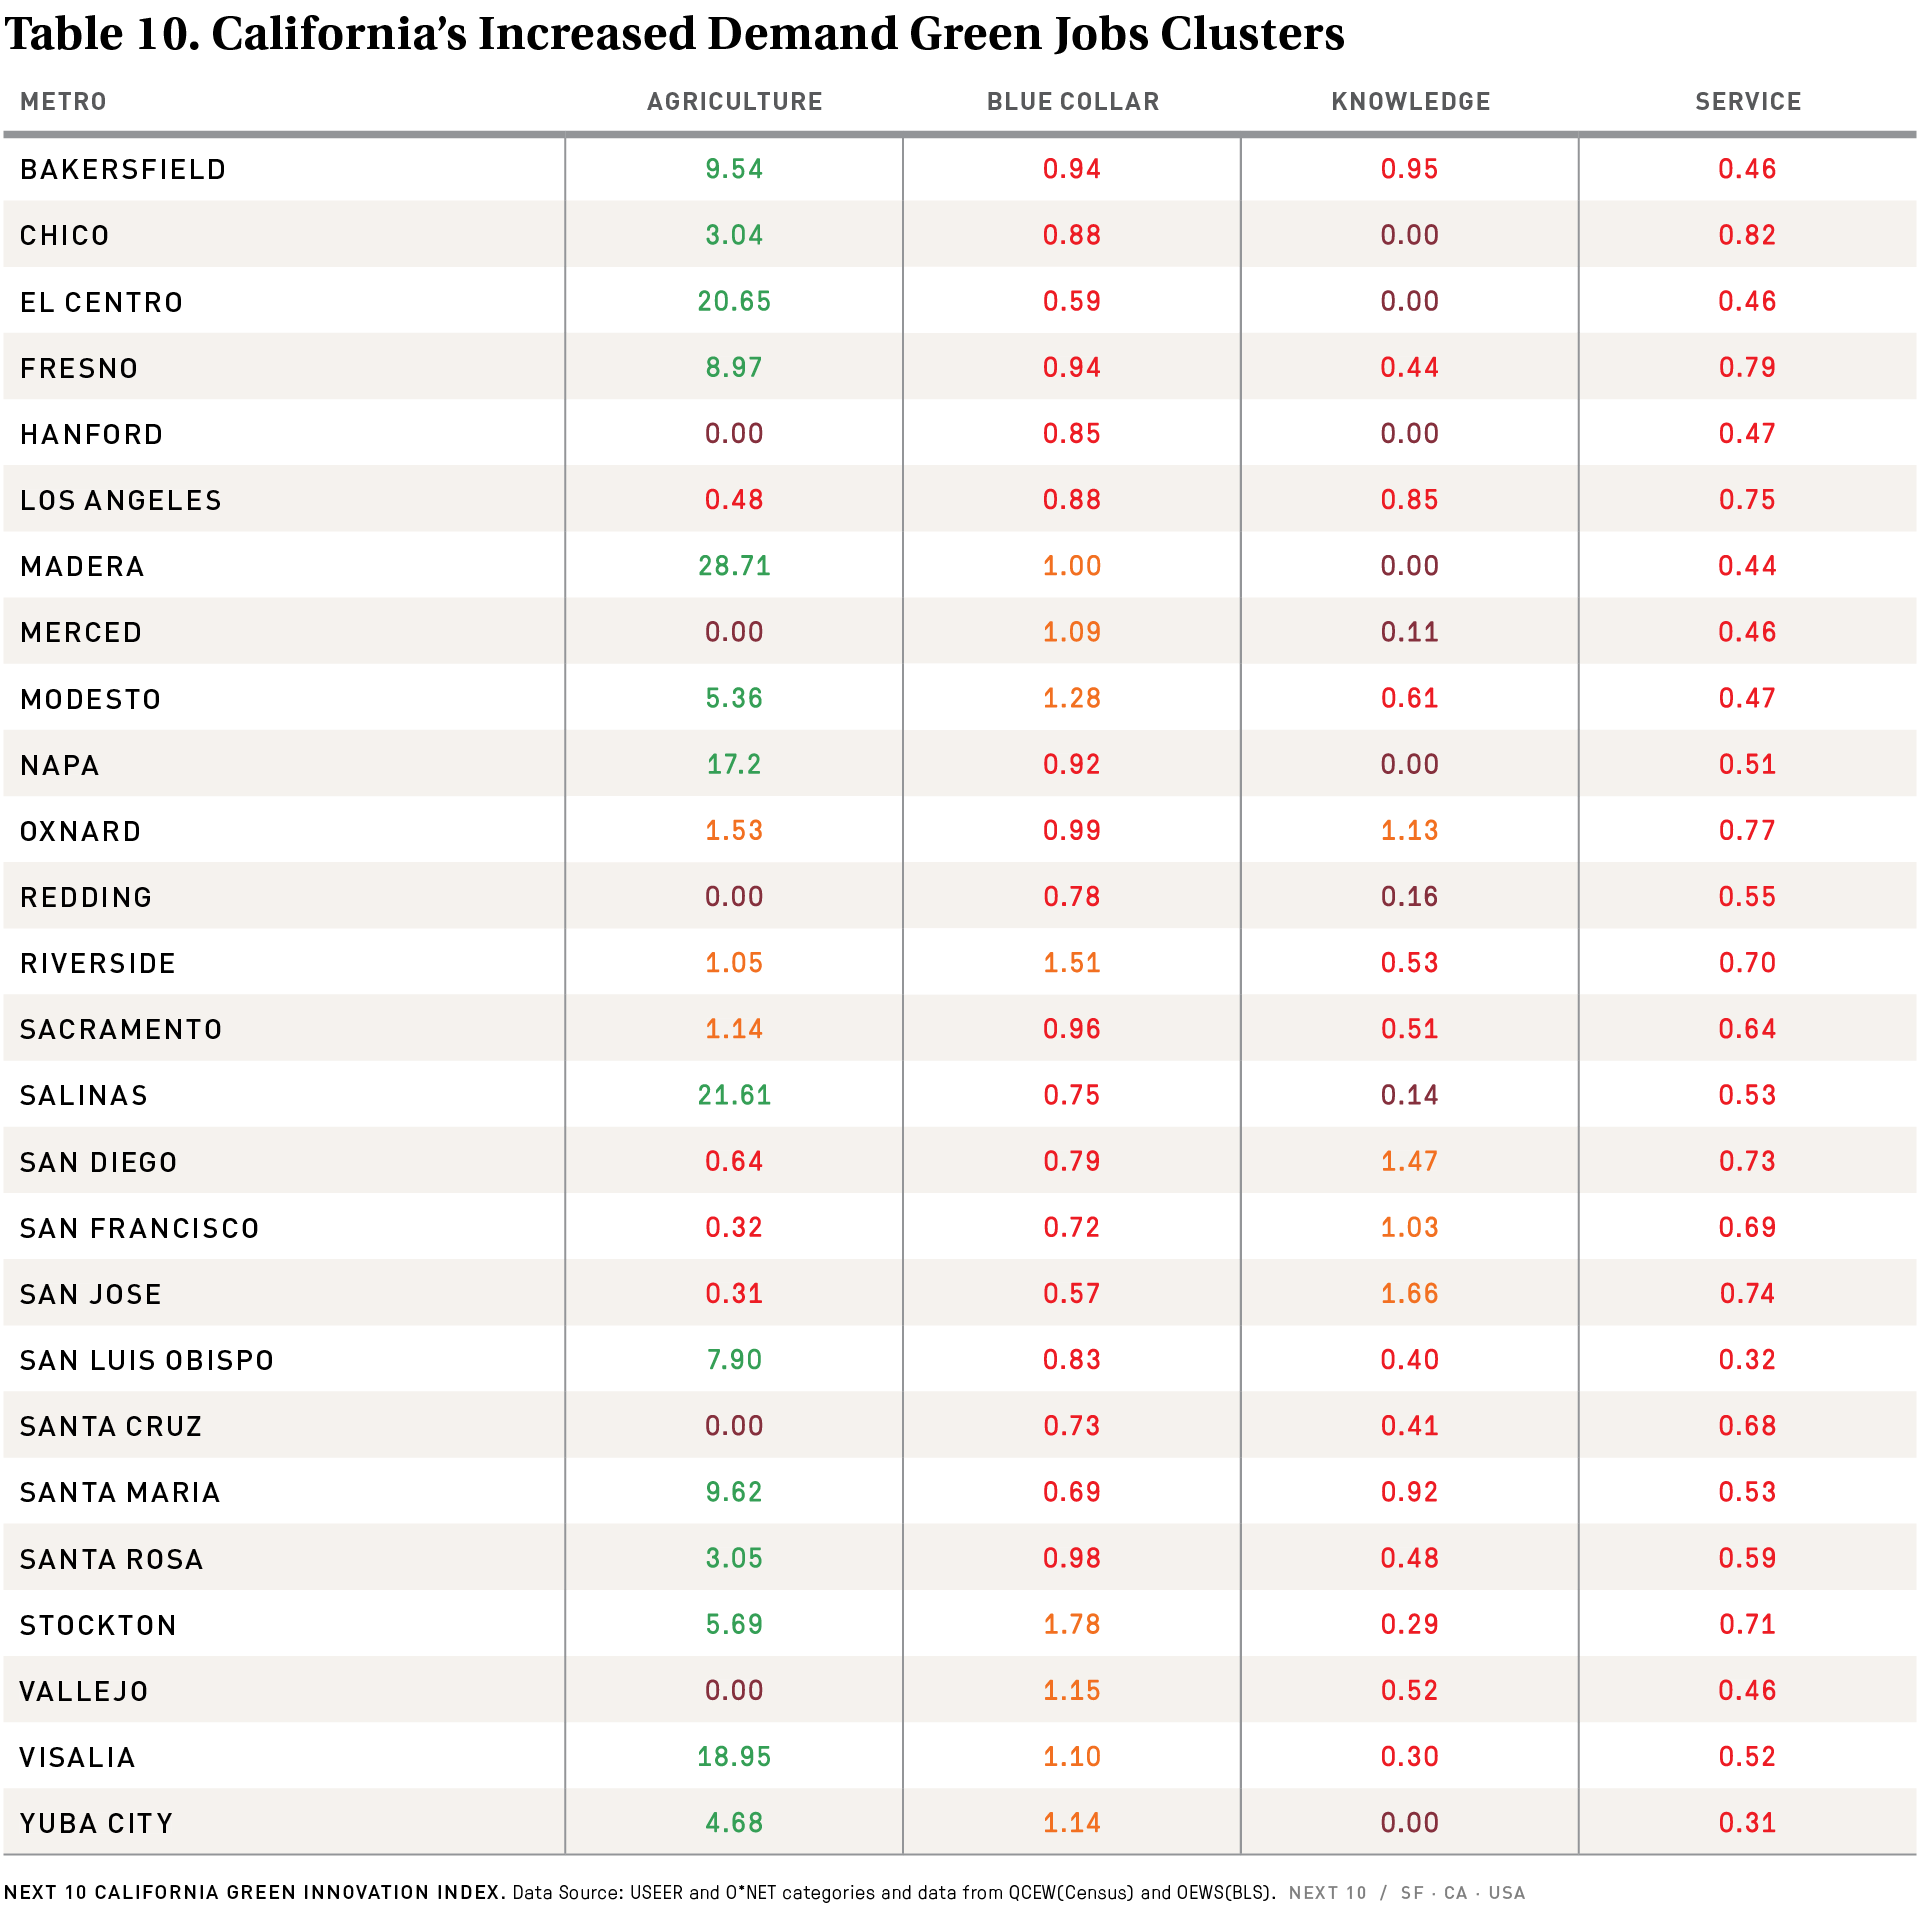
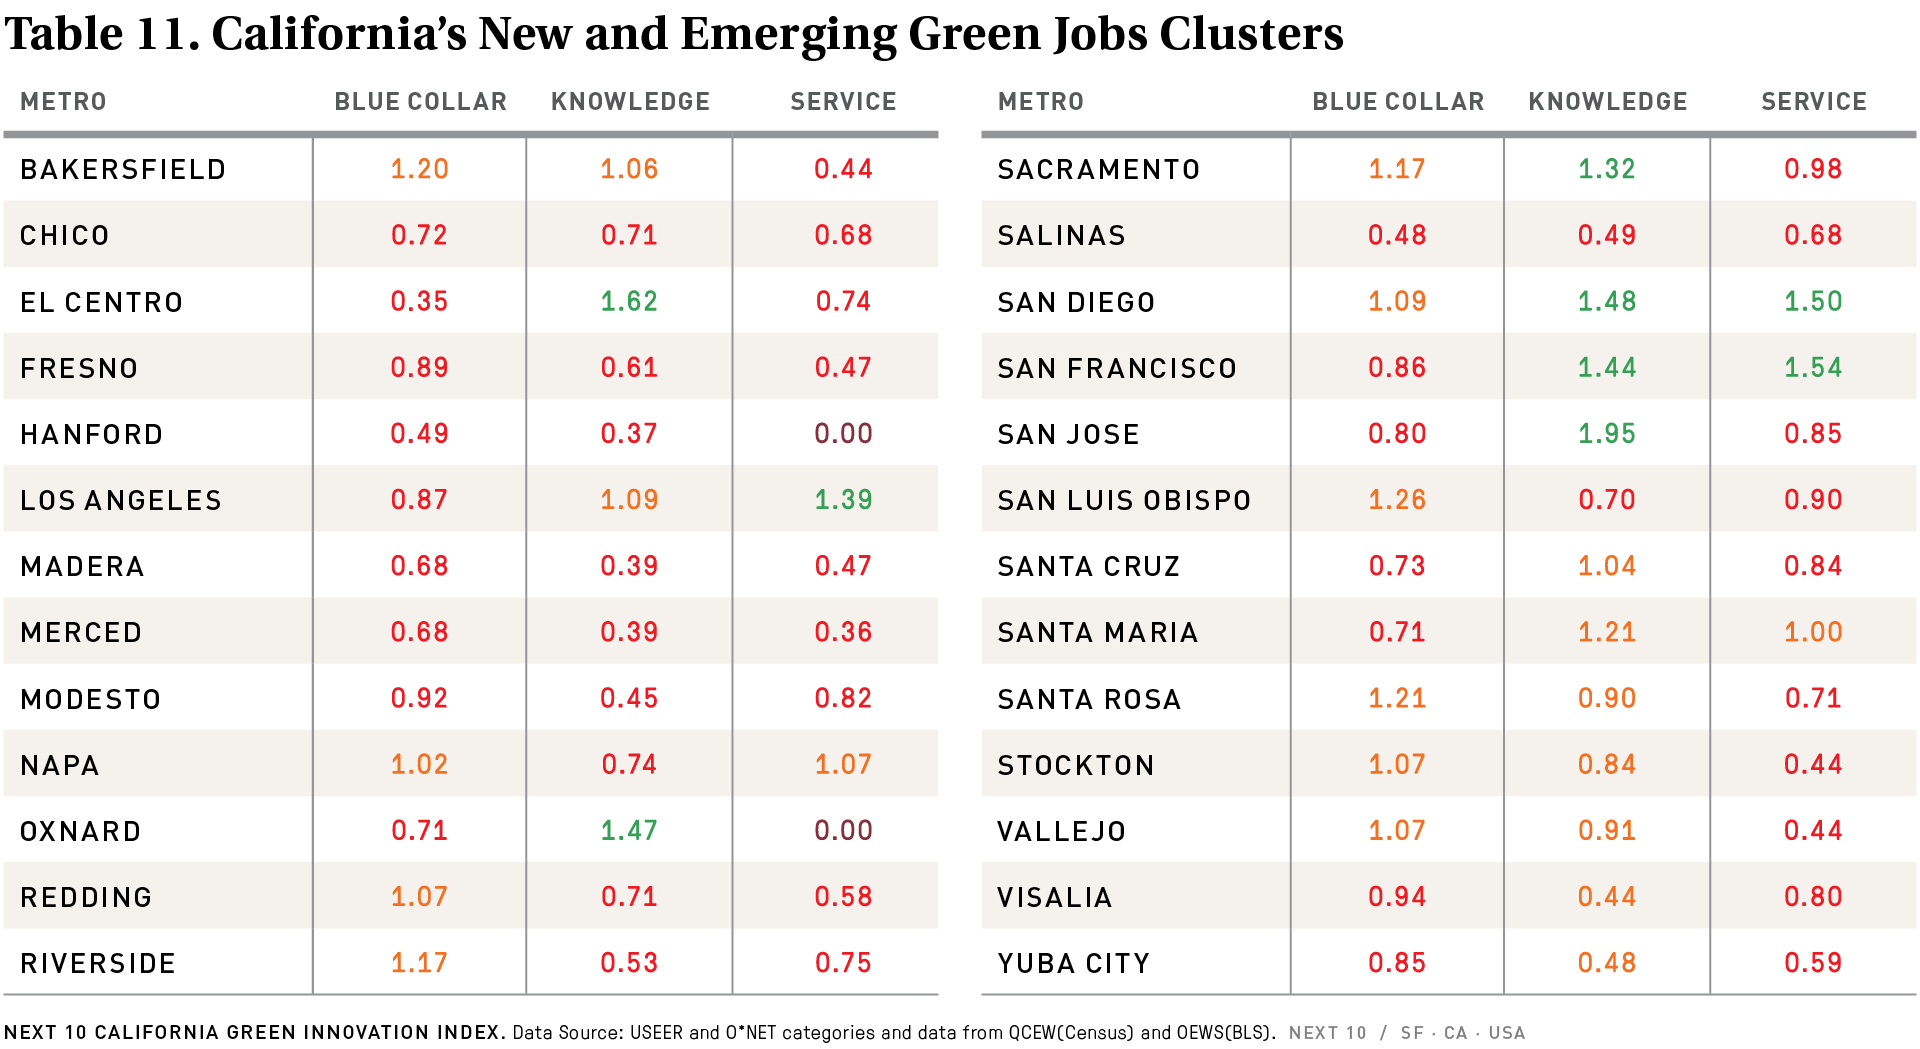
While California’s statewide emissions reductions in 2019 failed to keep pace with the dramatic reductions needed, the state did report strong jobs numbers within the clean energy sector—an encouraging sign for the state’s economic future. The Index found that California’s economy has the highest concentration of clean jobs and green jobs in power generation in the nation, largely due to its investment in solar. California boasted more than 124,000 solar power jobs in 2019—more than one-third of the total number of American jobs in that sector. California’s jobs in solar alone were more than five timThe state also boasted significant specialization within energy storage (ranking 5th in the nation with a total of 18,571 storage jobs) and a smaller, but still significant specialization in hydroelectric power production (total of 11,091 jobs; ranking 8th in specialization nationwide). The Index also found that the cities of Stockton, Riverside, Vallejo and Yuba City were actually some of the best positioned in the state for rapid job growth in green industries, due to the skillset of their workforce, including many in the trades.
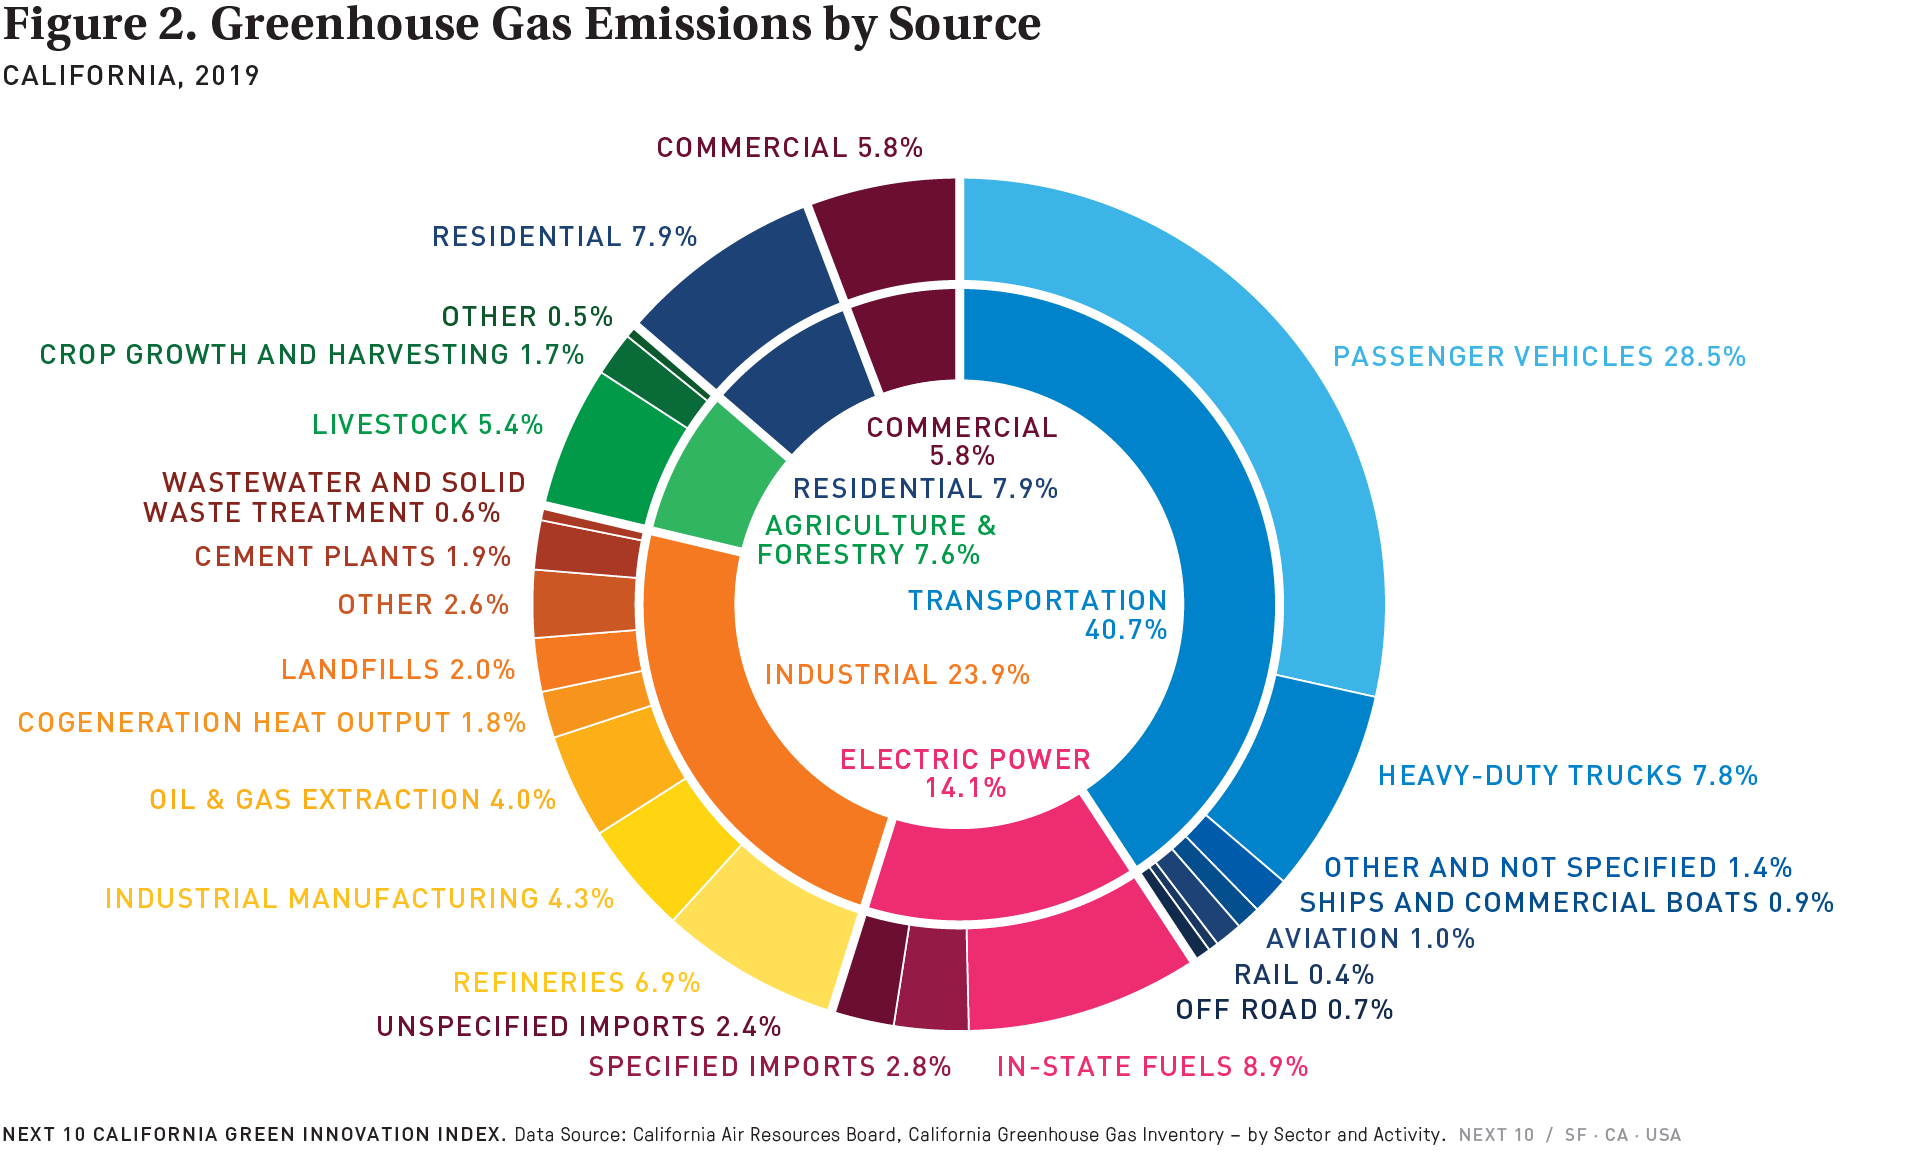
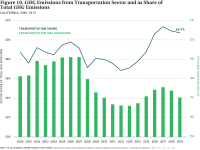
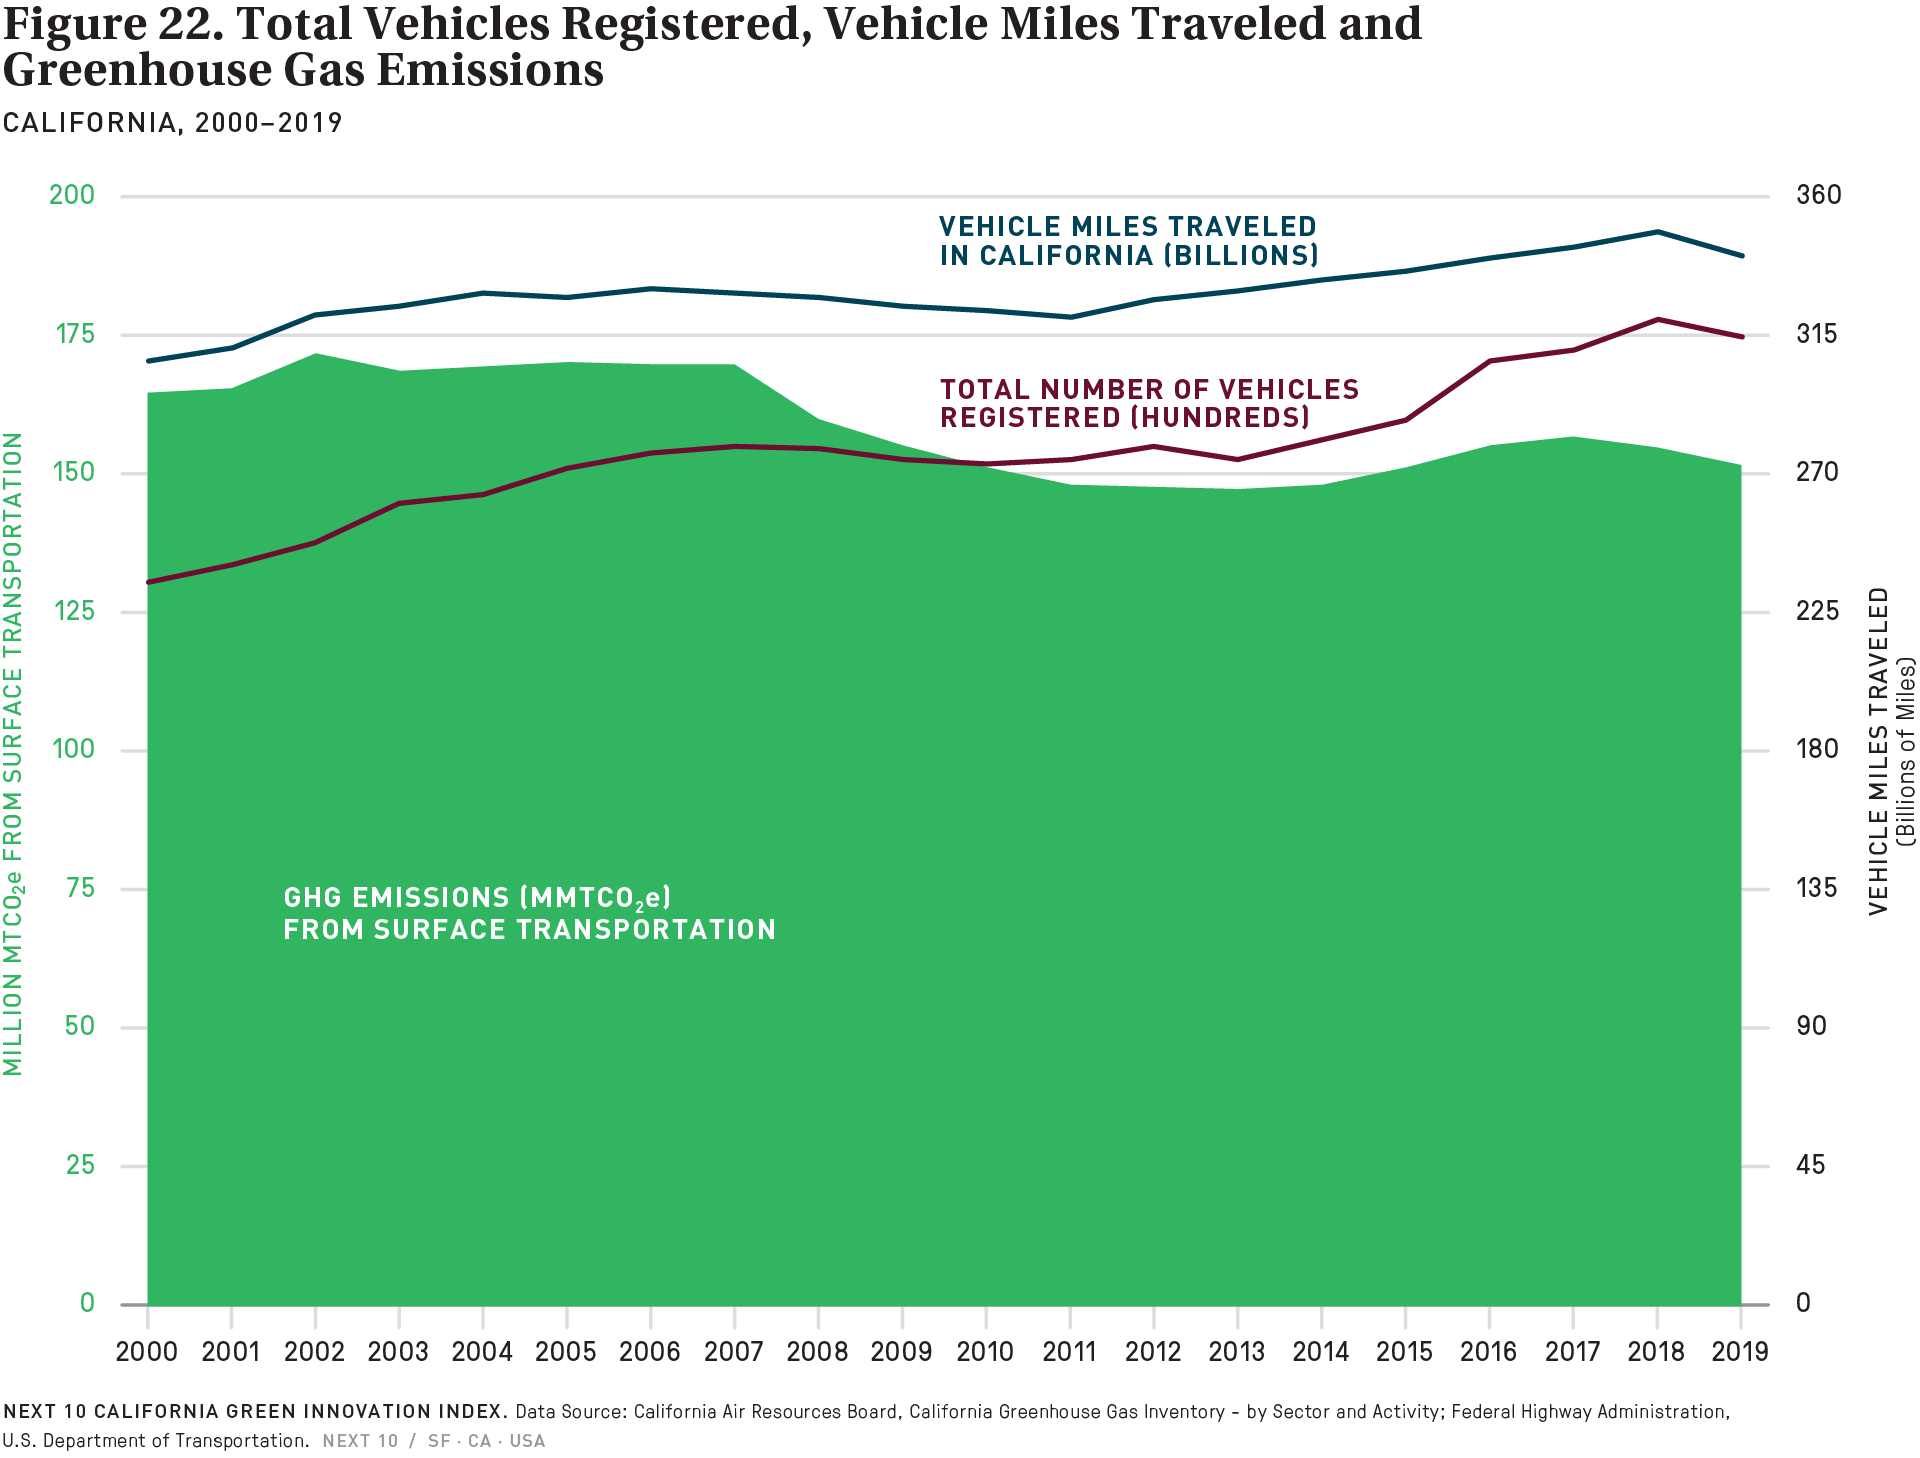
The report also found that transportation sector emissions, California’s largest source of greenhouse gas emissions, ticked downward just slightly in 2019, dropping 2.1 percent from 2018 to 2019, and remaining at just over 40 percent of the state’s total emissions (40.7% in 2019). This decrease was driven largely by a substantial 7.5 percent drop in heavy-duty vehicle emissions—and aided by a small (1.5%) drop in light-duty truck and SUV emissions.
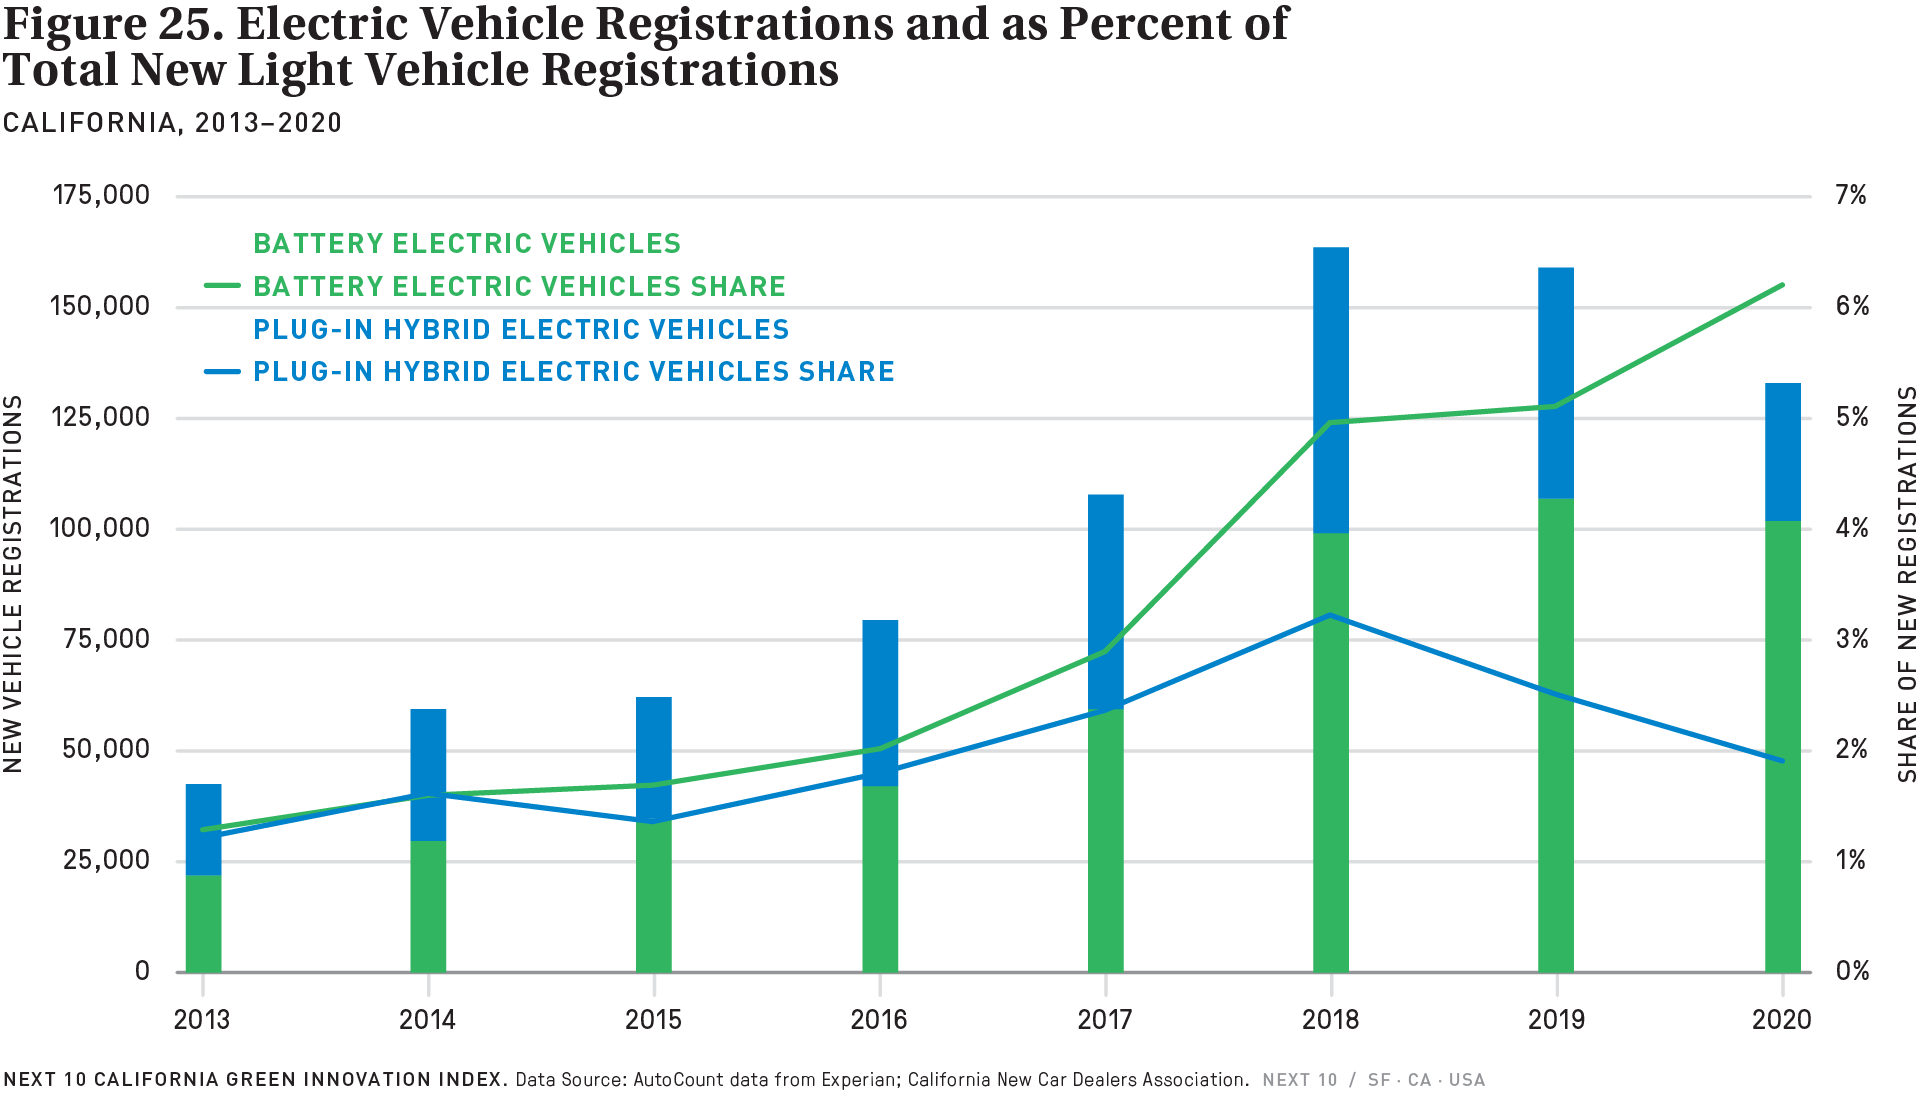
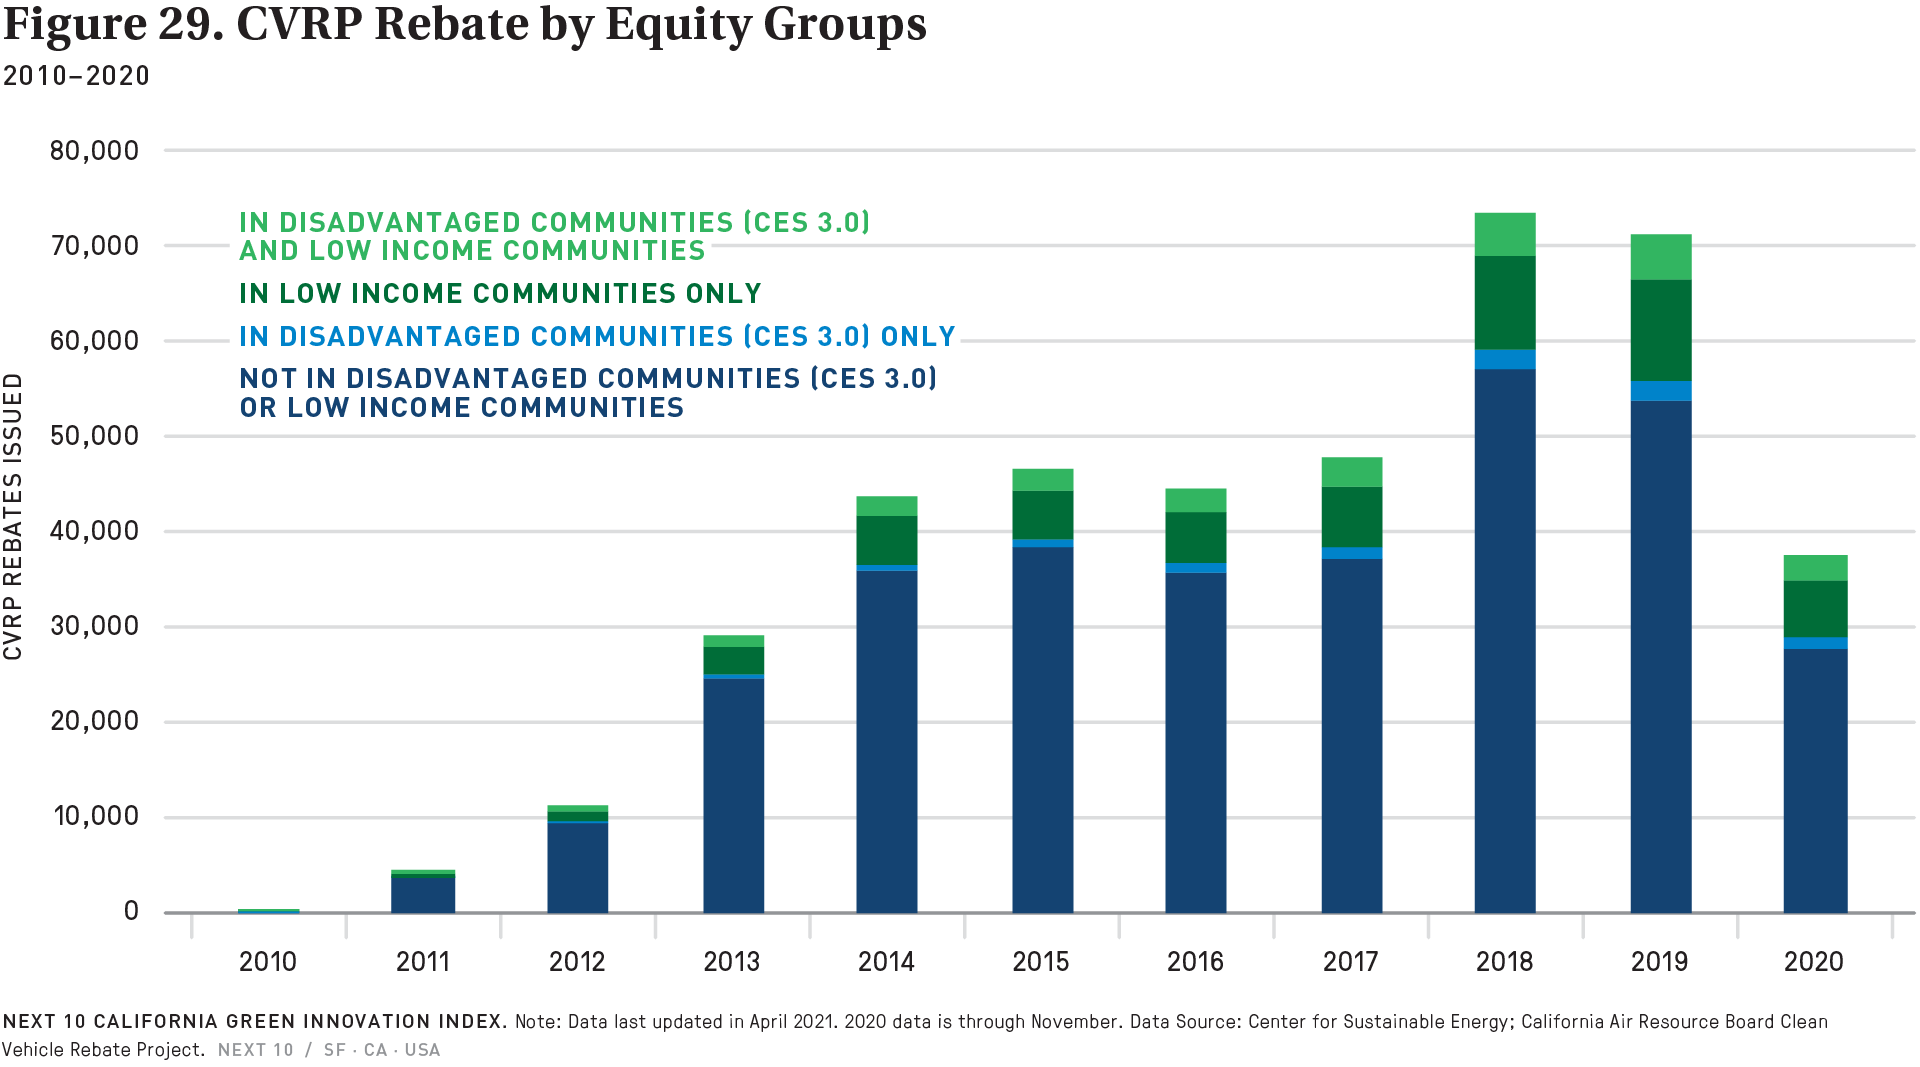
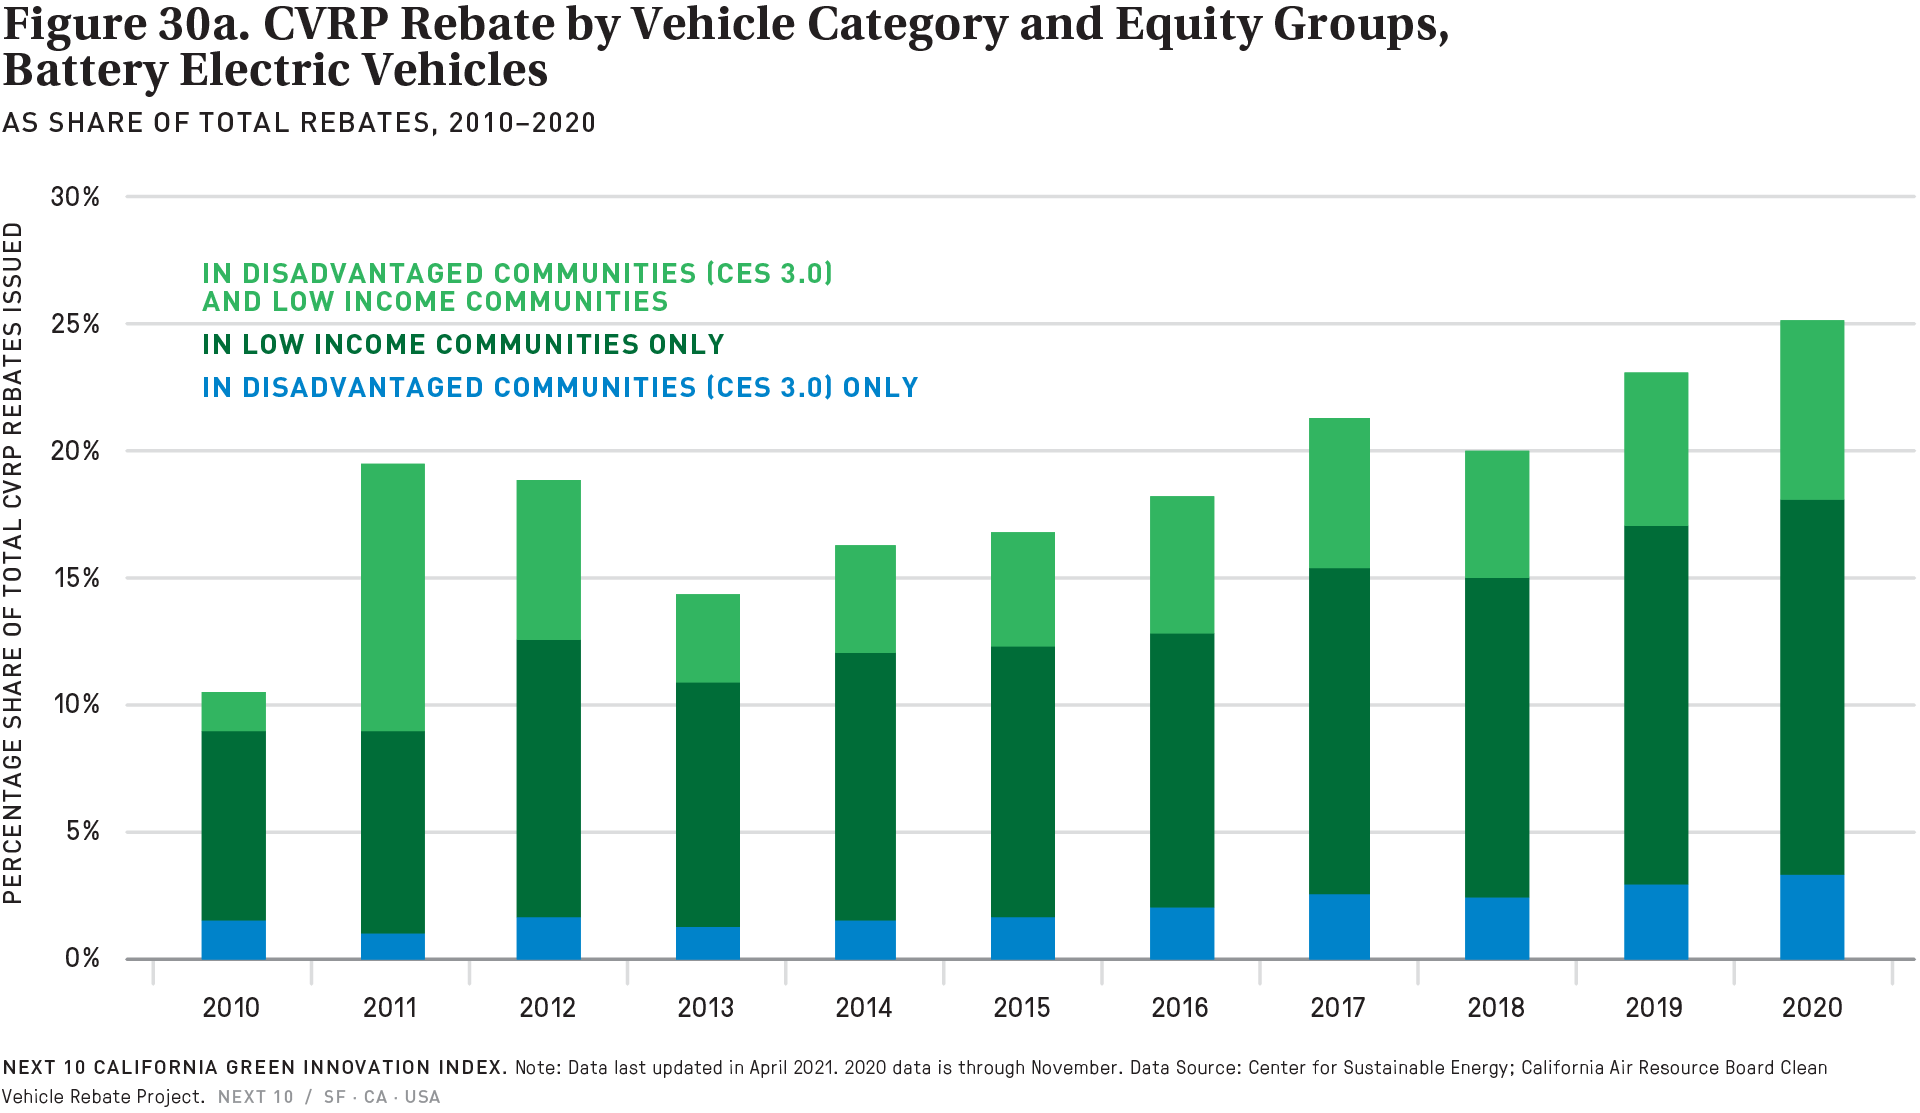
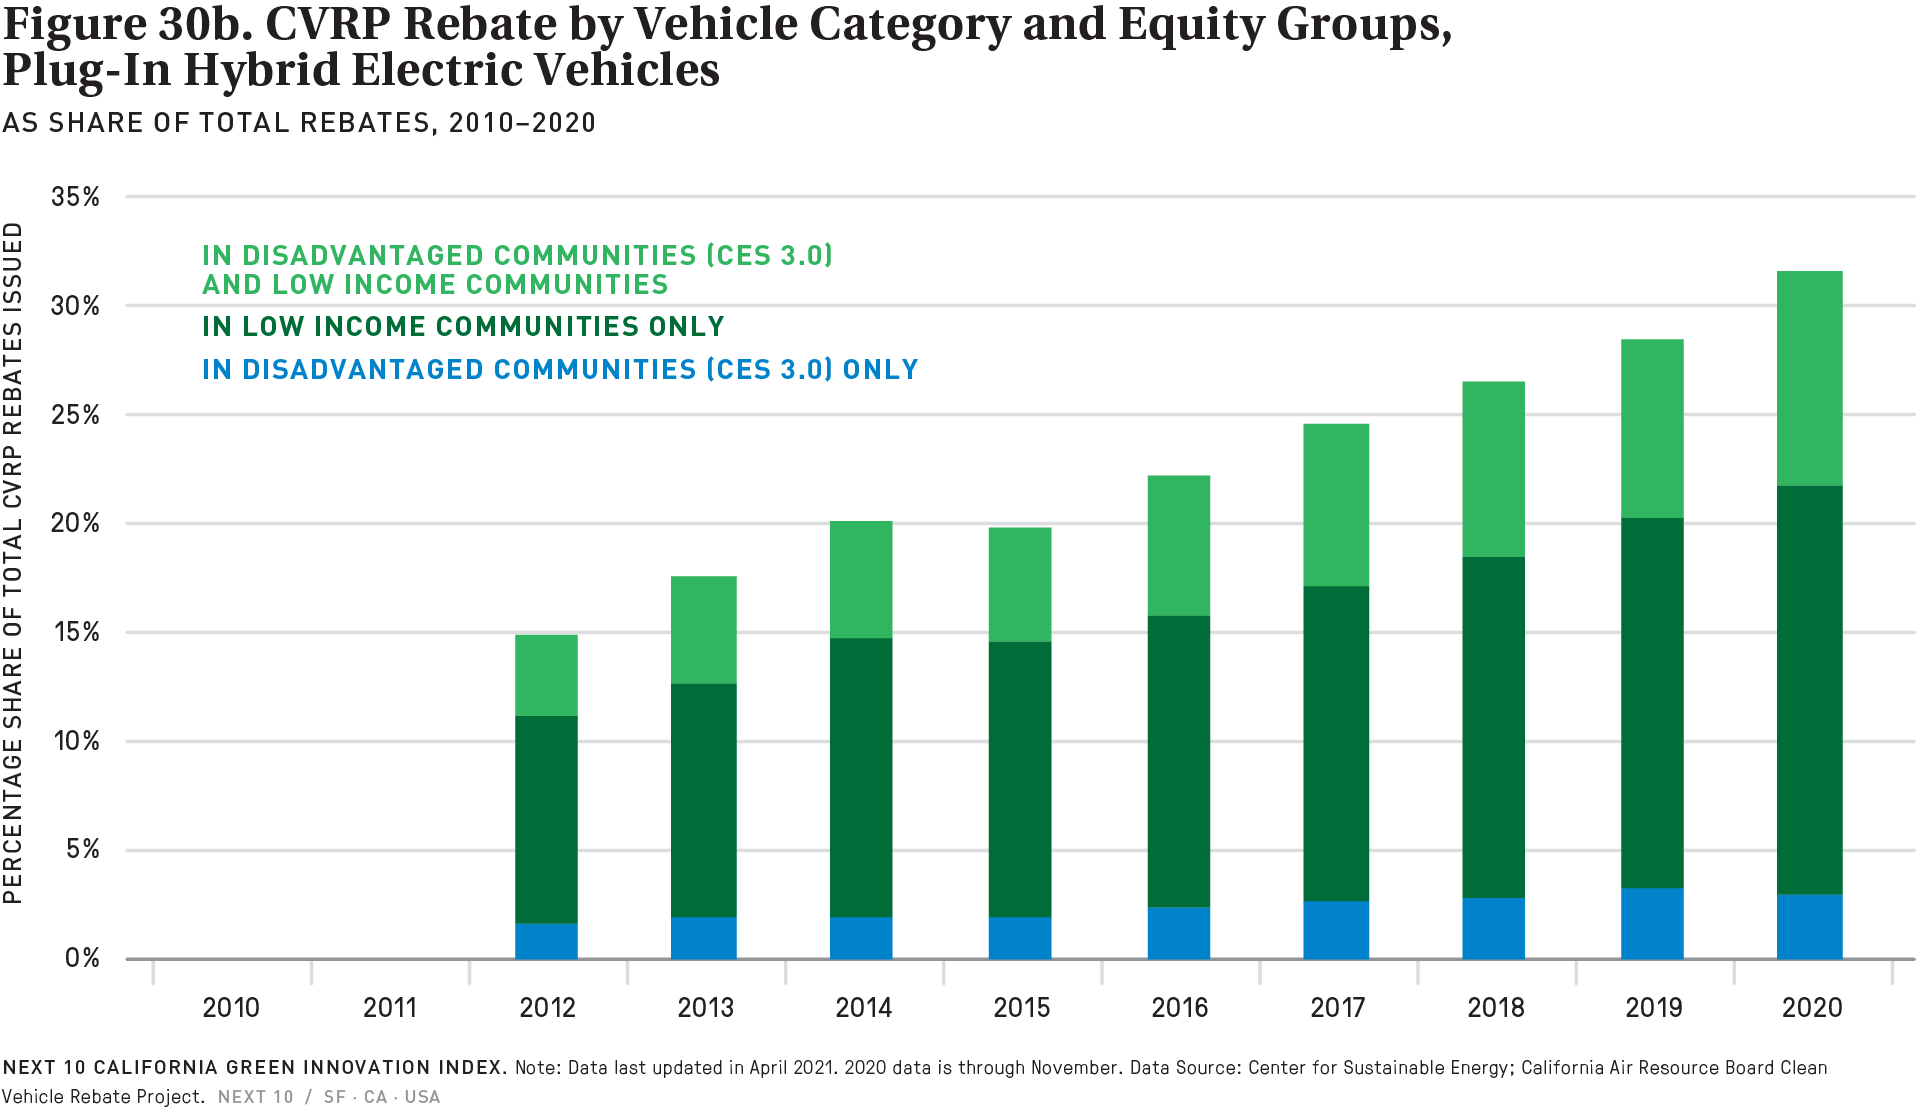
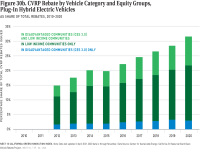
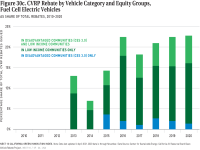
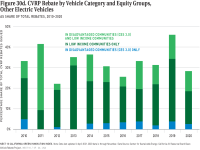
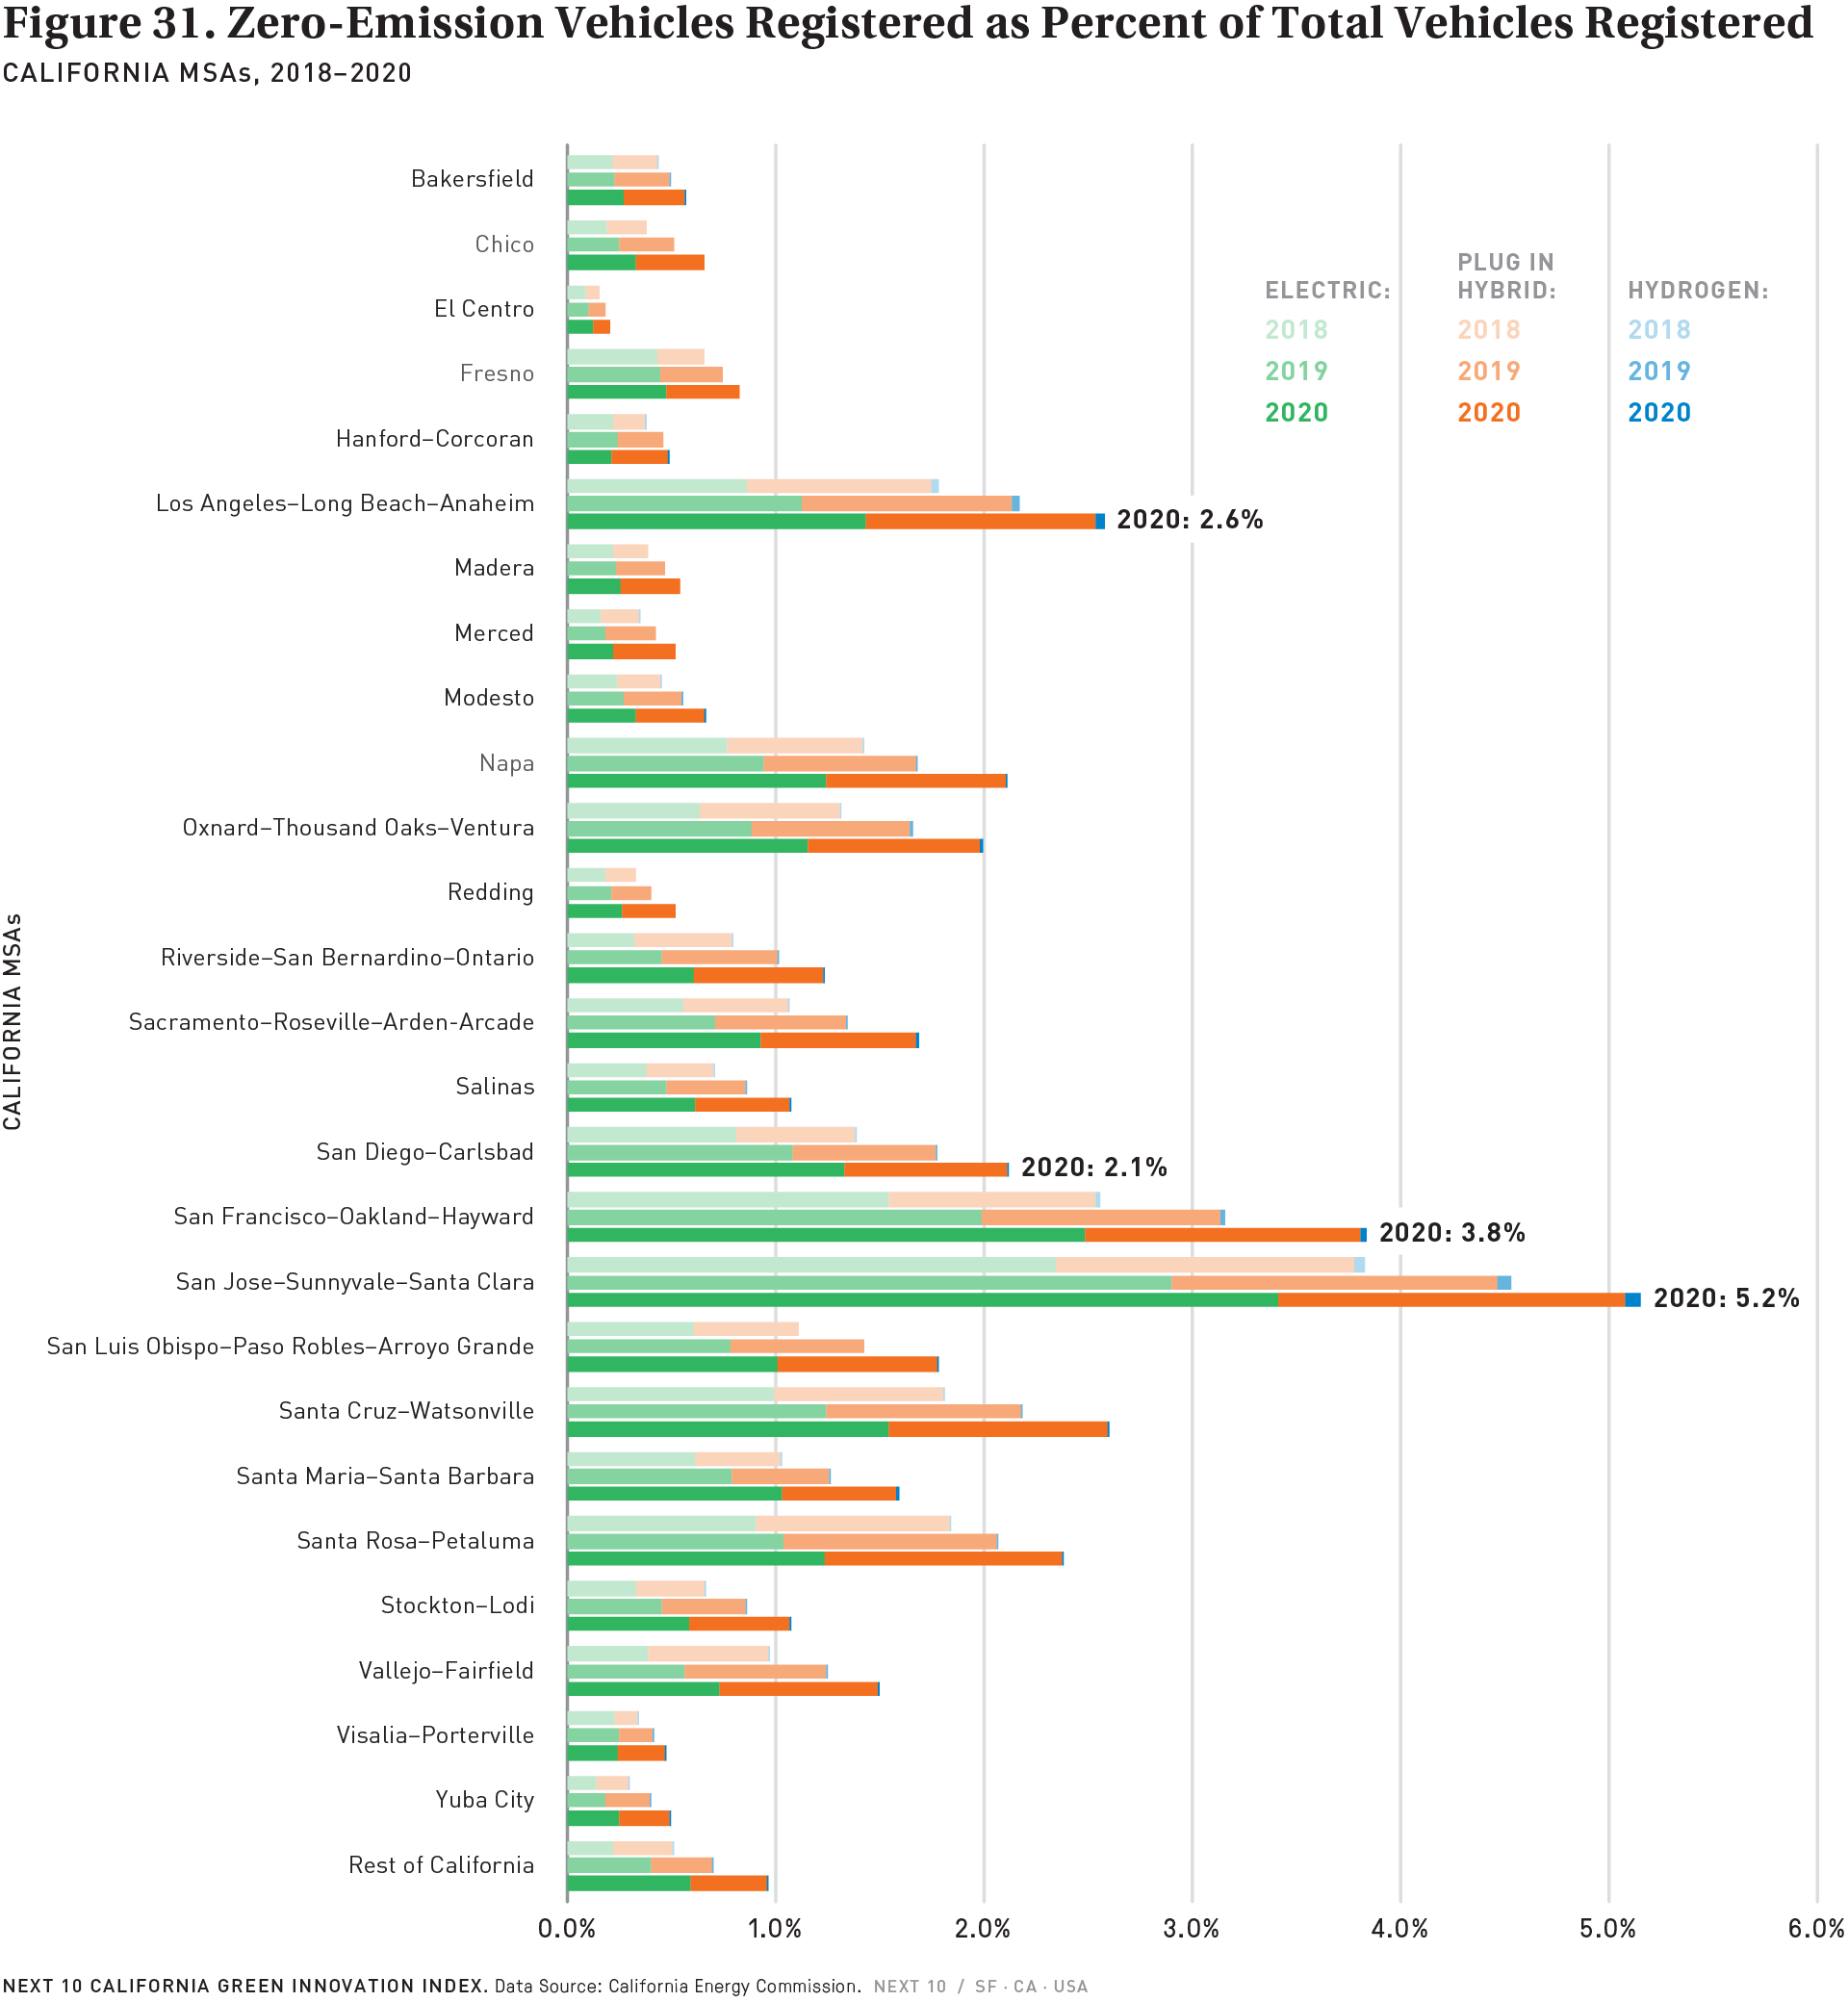
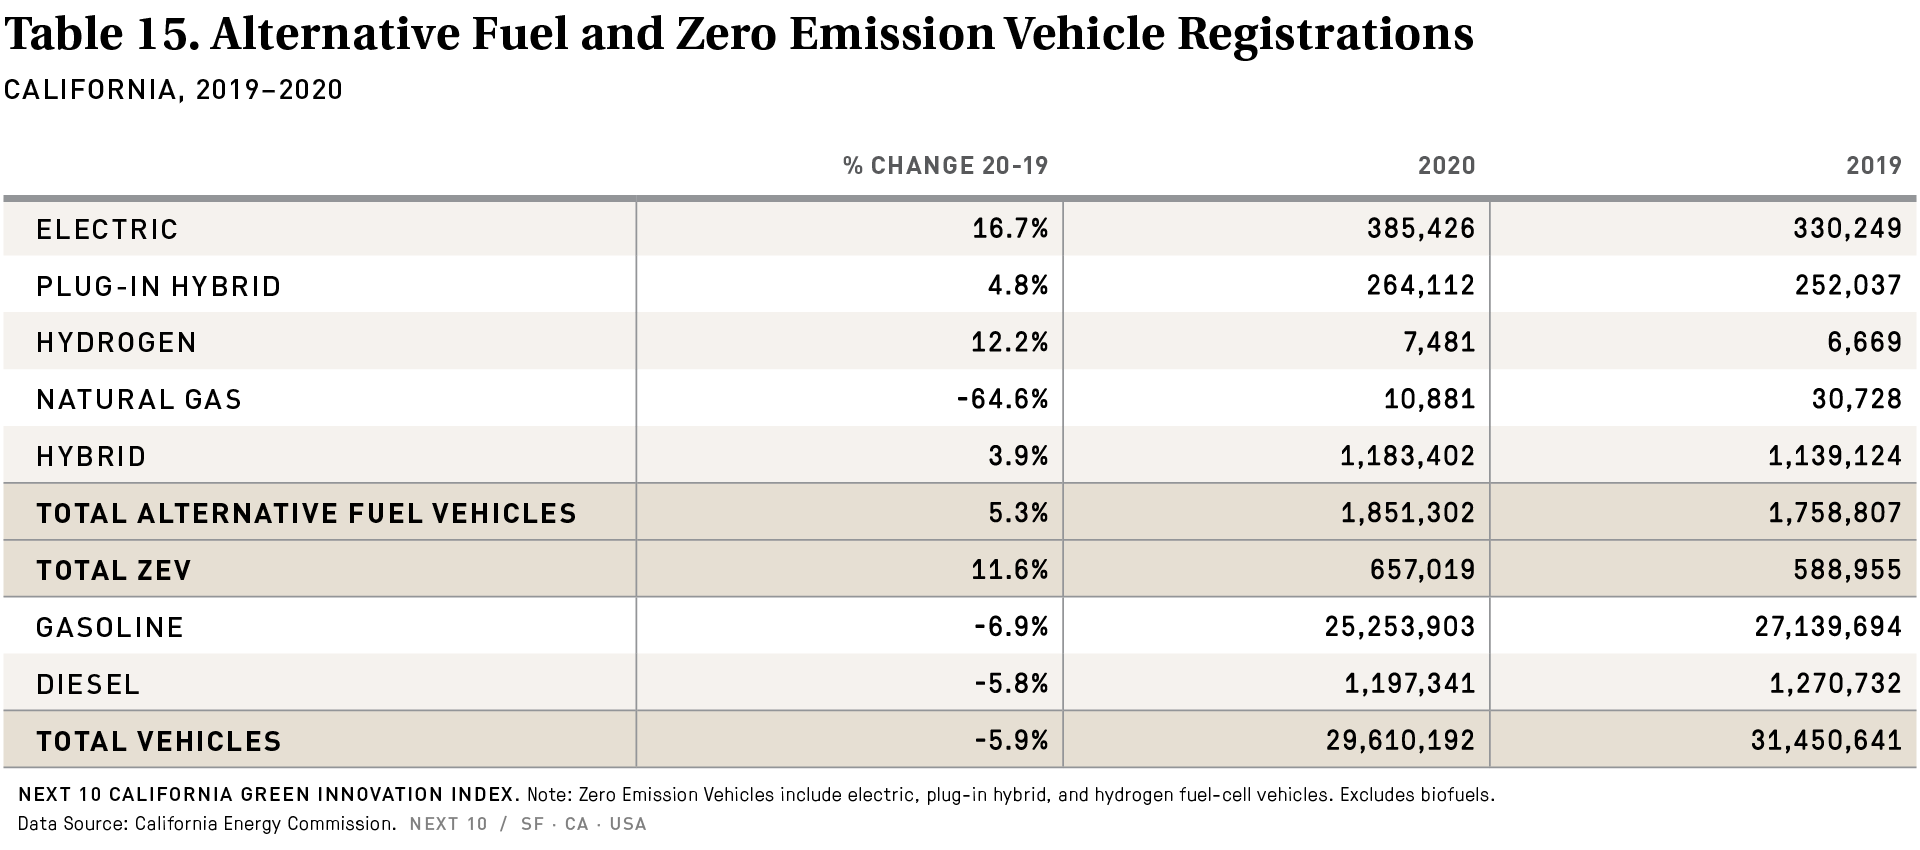
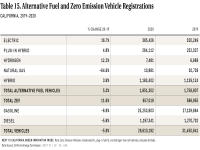
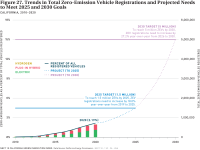
The total number of zero-emissions vehicles (ZEVs) registered in California is growing (+11.6% in 2020 compared to 2019), though a greater pace of adoption is needed to meet the state's target of 1.5 million ZEVs on the road by 2025. Major policy developments over the last two years, such as Governor Newsom's executive order setting a target of 100 percent of car sales being ZEVs by 2035 and the approval of the Advanced Clean Trucks rule ramping up sales requirements for electric trucks, could lay the groundwork for a rapid transition to ZEVs in the coming years. There are also promising signs that ZEV adoption is expanding at a faster pace outside the traditional urban market into more rural areas. In 2020, more than 26.3 percent of Clean Vehicle Rebate Program (one of California's key clean transportation incentive programs) rebates came from disadvantaged communities, up for 17.8 percent in 2015.
Wildfires continue to present a persistent challenge, with emissions from wildfires reaching the highest level since the state began tracking them—more than 106 MMTCO2e in 2020, more than any other sector aside from transportation in 2019. While some of these carbon emissions will be reabsorbed as California's fire-ravaged forests recover, the scale of the emissions is worrying nonetheless—especially given that wildfires are likely to continue to grow in size and severity as temperatures rise with climate change.
The newly-online 2021 California Green Innovation Index can be found at https://greeninnovationindex.org/.
Next 10 owns the rights to this publication. Any usage of content from this publication is subject to our Terms of Use.
Featured Graphics


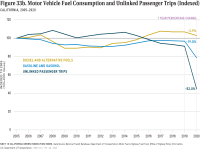
Key Transportation-Sector Findings Include:
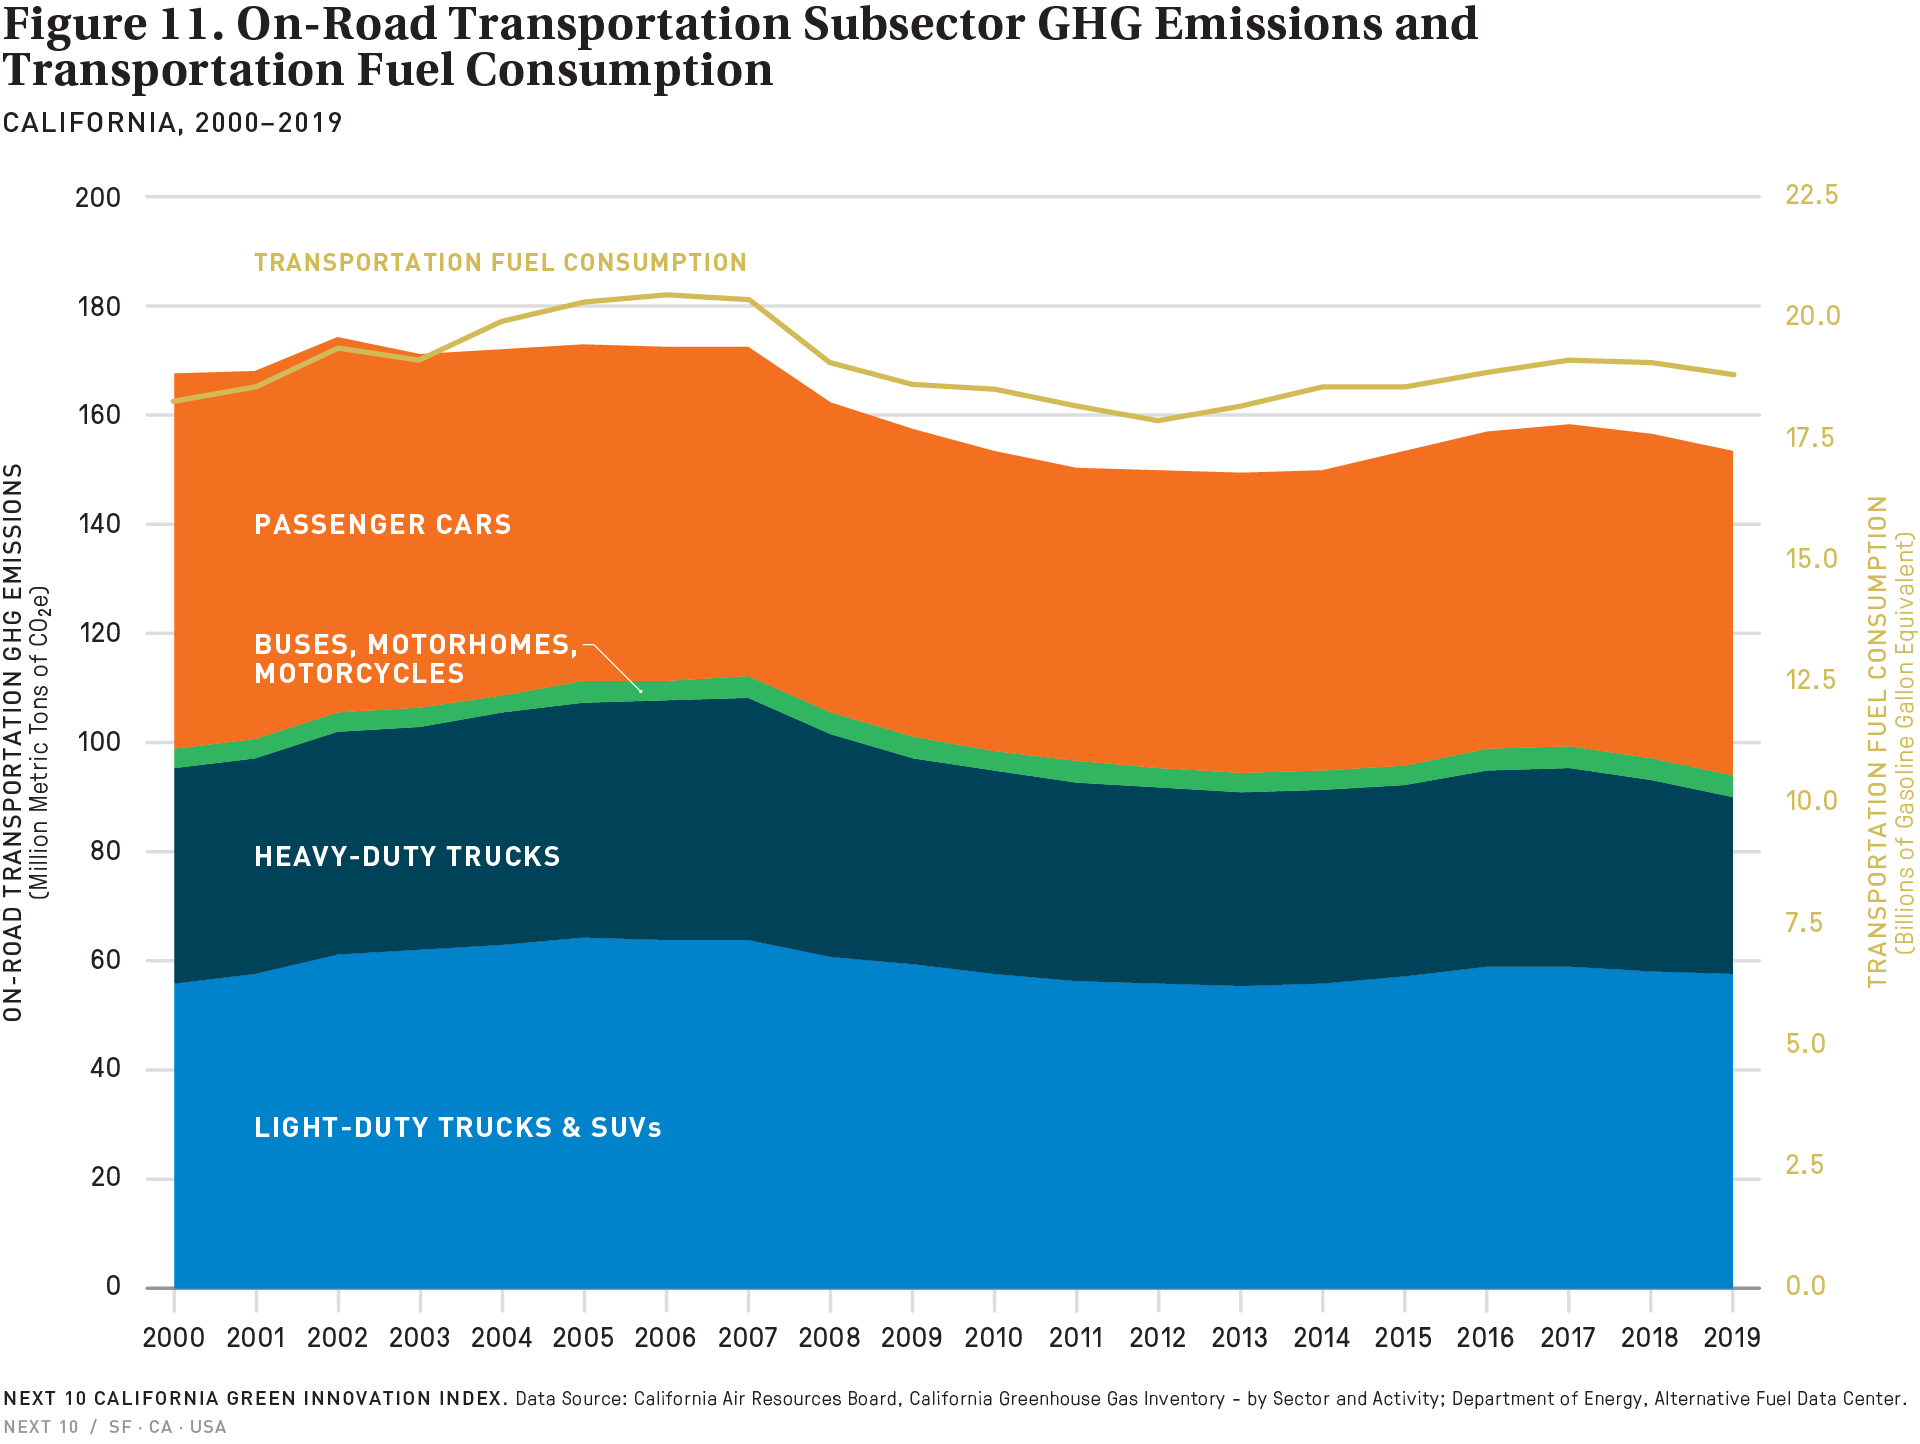
- Greenhouse gas emissions dropped 1.9% from on-road vehicles (passenger cars, buses, light-duty trucks, heavy-duty trucks) in 2019.
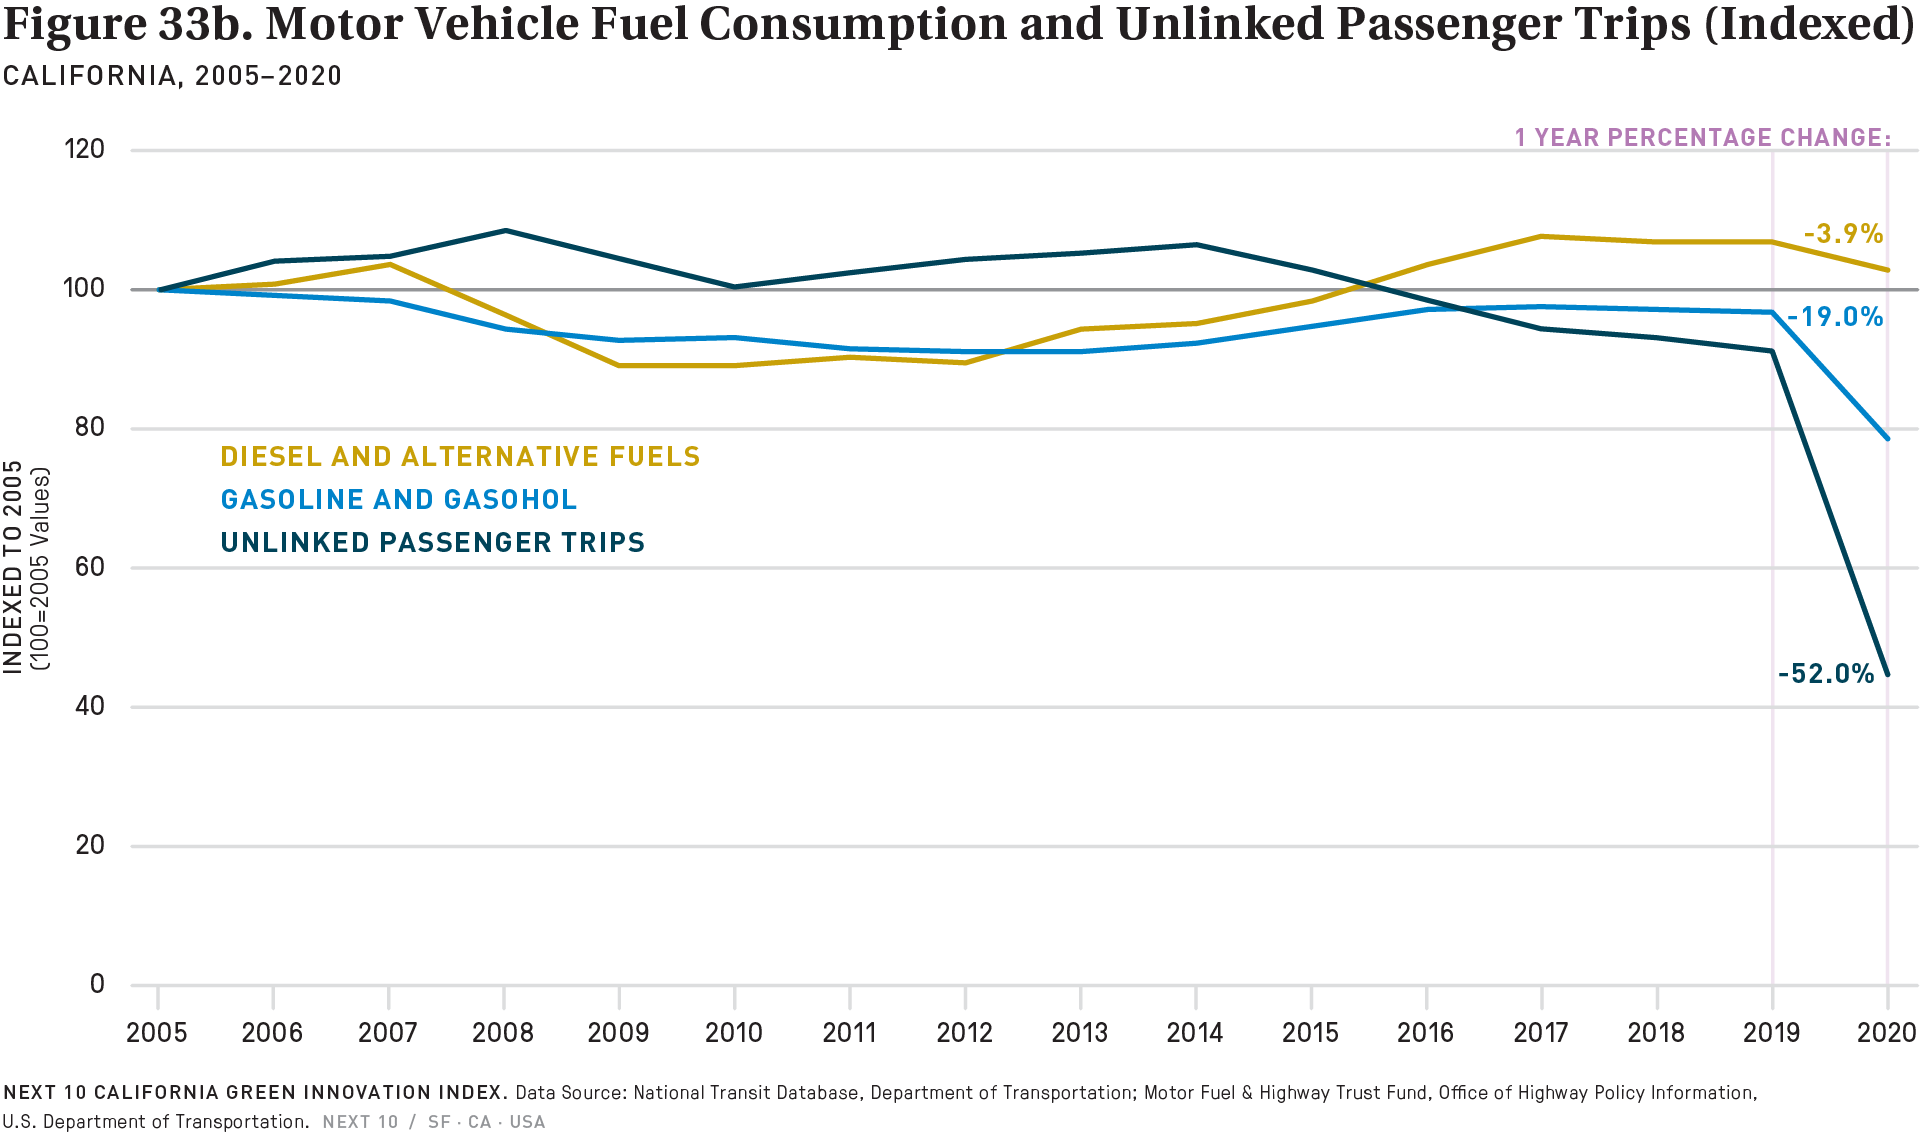
- The amount of transportation fuel consumed in 2019 was similar to 2016—but thanks to increases in fuel economy, as well as an increase in zero-emissions vehicles, greenhouse gas emissions per unit of fuel consumed were 2.4% lower in 2019 compared to 2016.
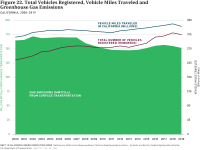
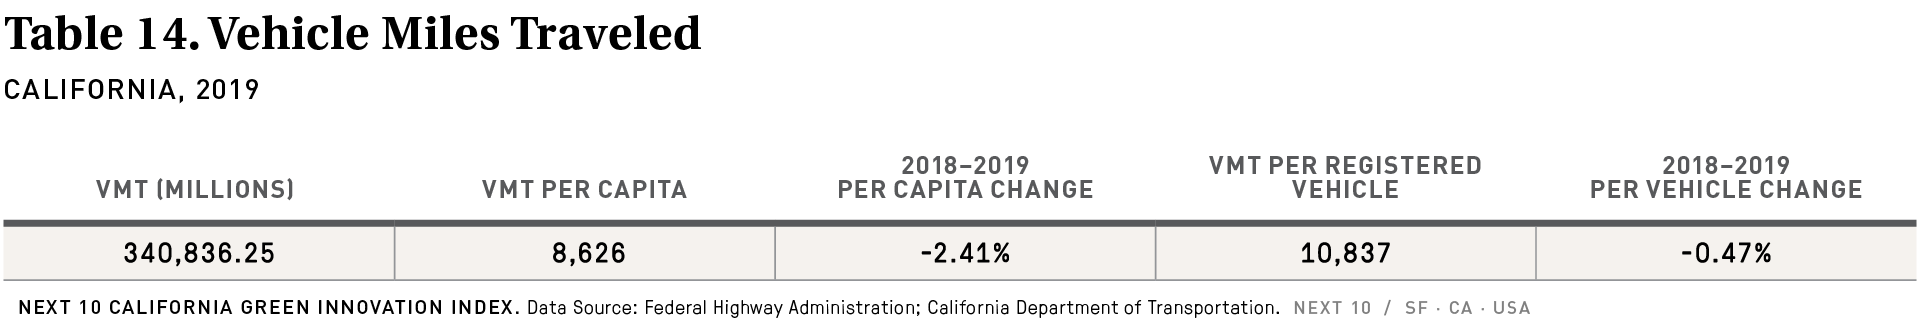
- After years of increases, the total number of vehicles registered and vehicle miles traveled (VMT) in California dropped by 1.8% and 2.3% respectively from 2018 to 2019.
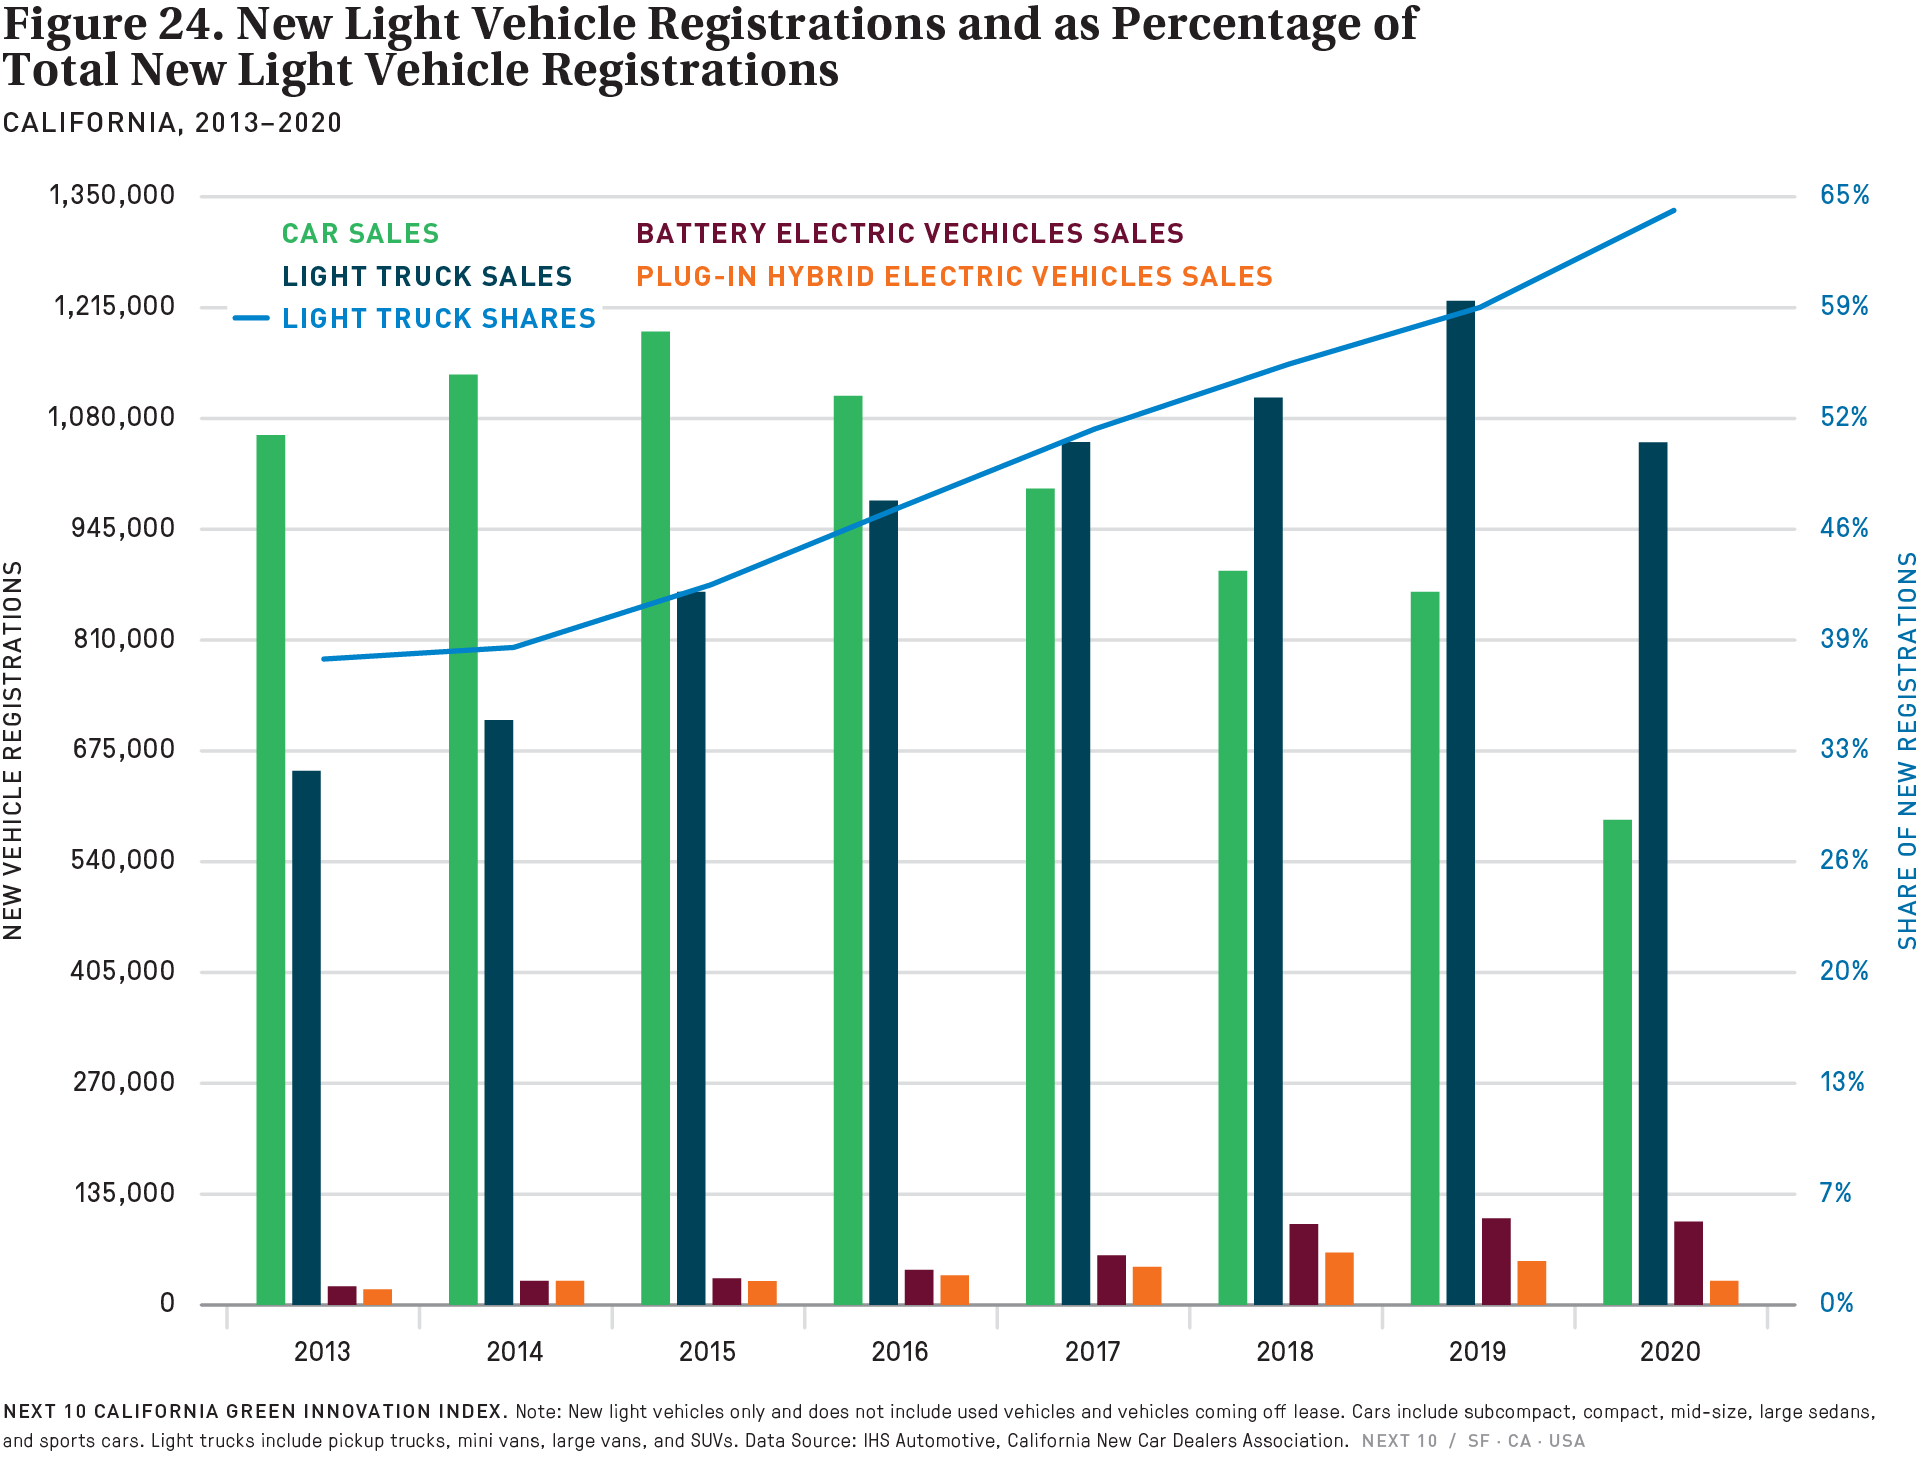
- In 2020, battery electric, plug-in hybrid, and hydrogen vehicles accounted for 2.2% of all registered on-road vehicles in California—up from 1.9% in 2019 and 1.5% in 2018.
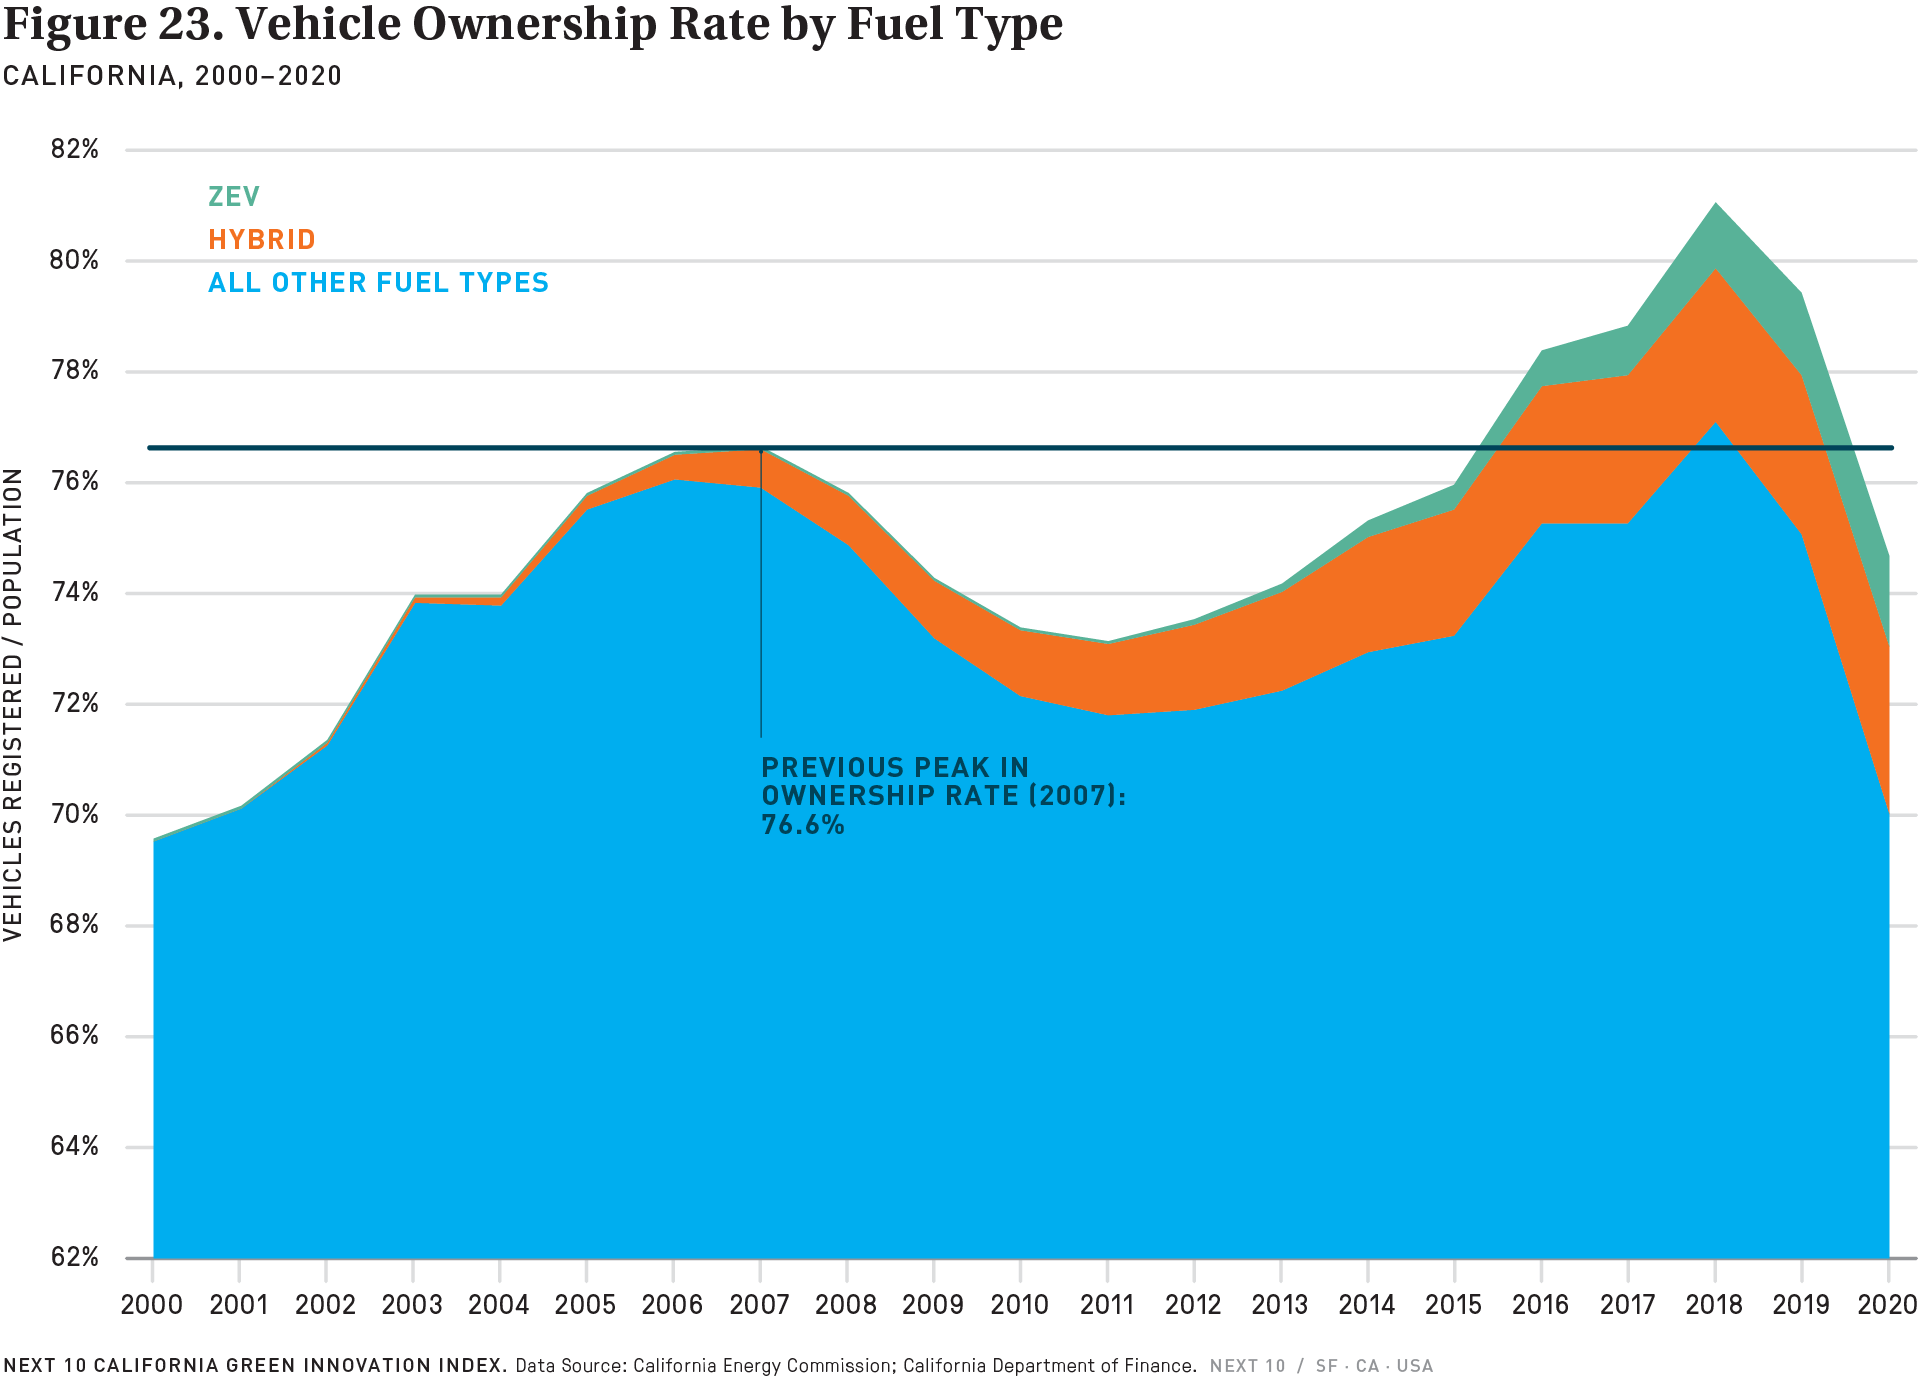
- In 2020, the vehicle ownership rate dropped to 74.7 per 100 persons, down from 79.4 in 2019—a decline that was likely pandemic-induced, and that could reverse itself as the economy recovers, and as supply chain issues are resolved.
Other Key Findings Include:
- In comparison to renewable power sources, California’s fossil-fuel portfolio provides a much smaller source of jobs. Only 22,901 jobs were involved in fossil fuel (including coal, natural gas, and oil) power production in 2019. The state’s solar power jobs alone exceed 124,000.
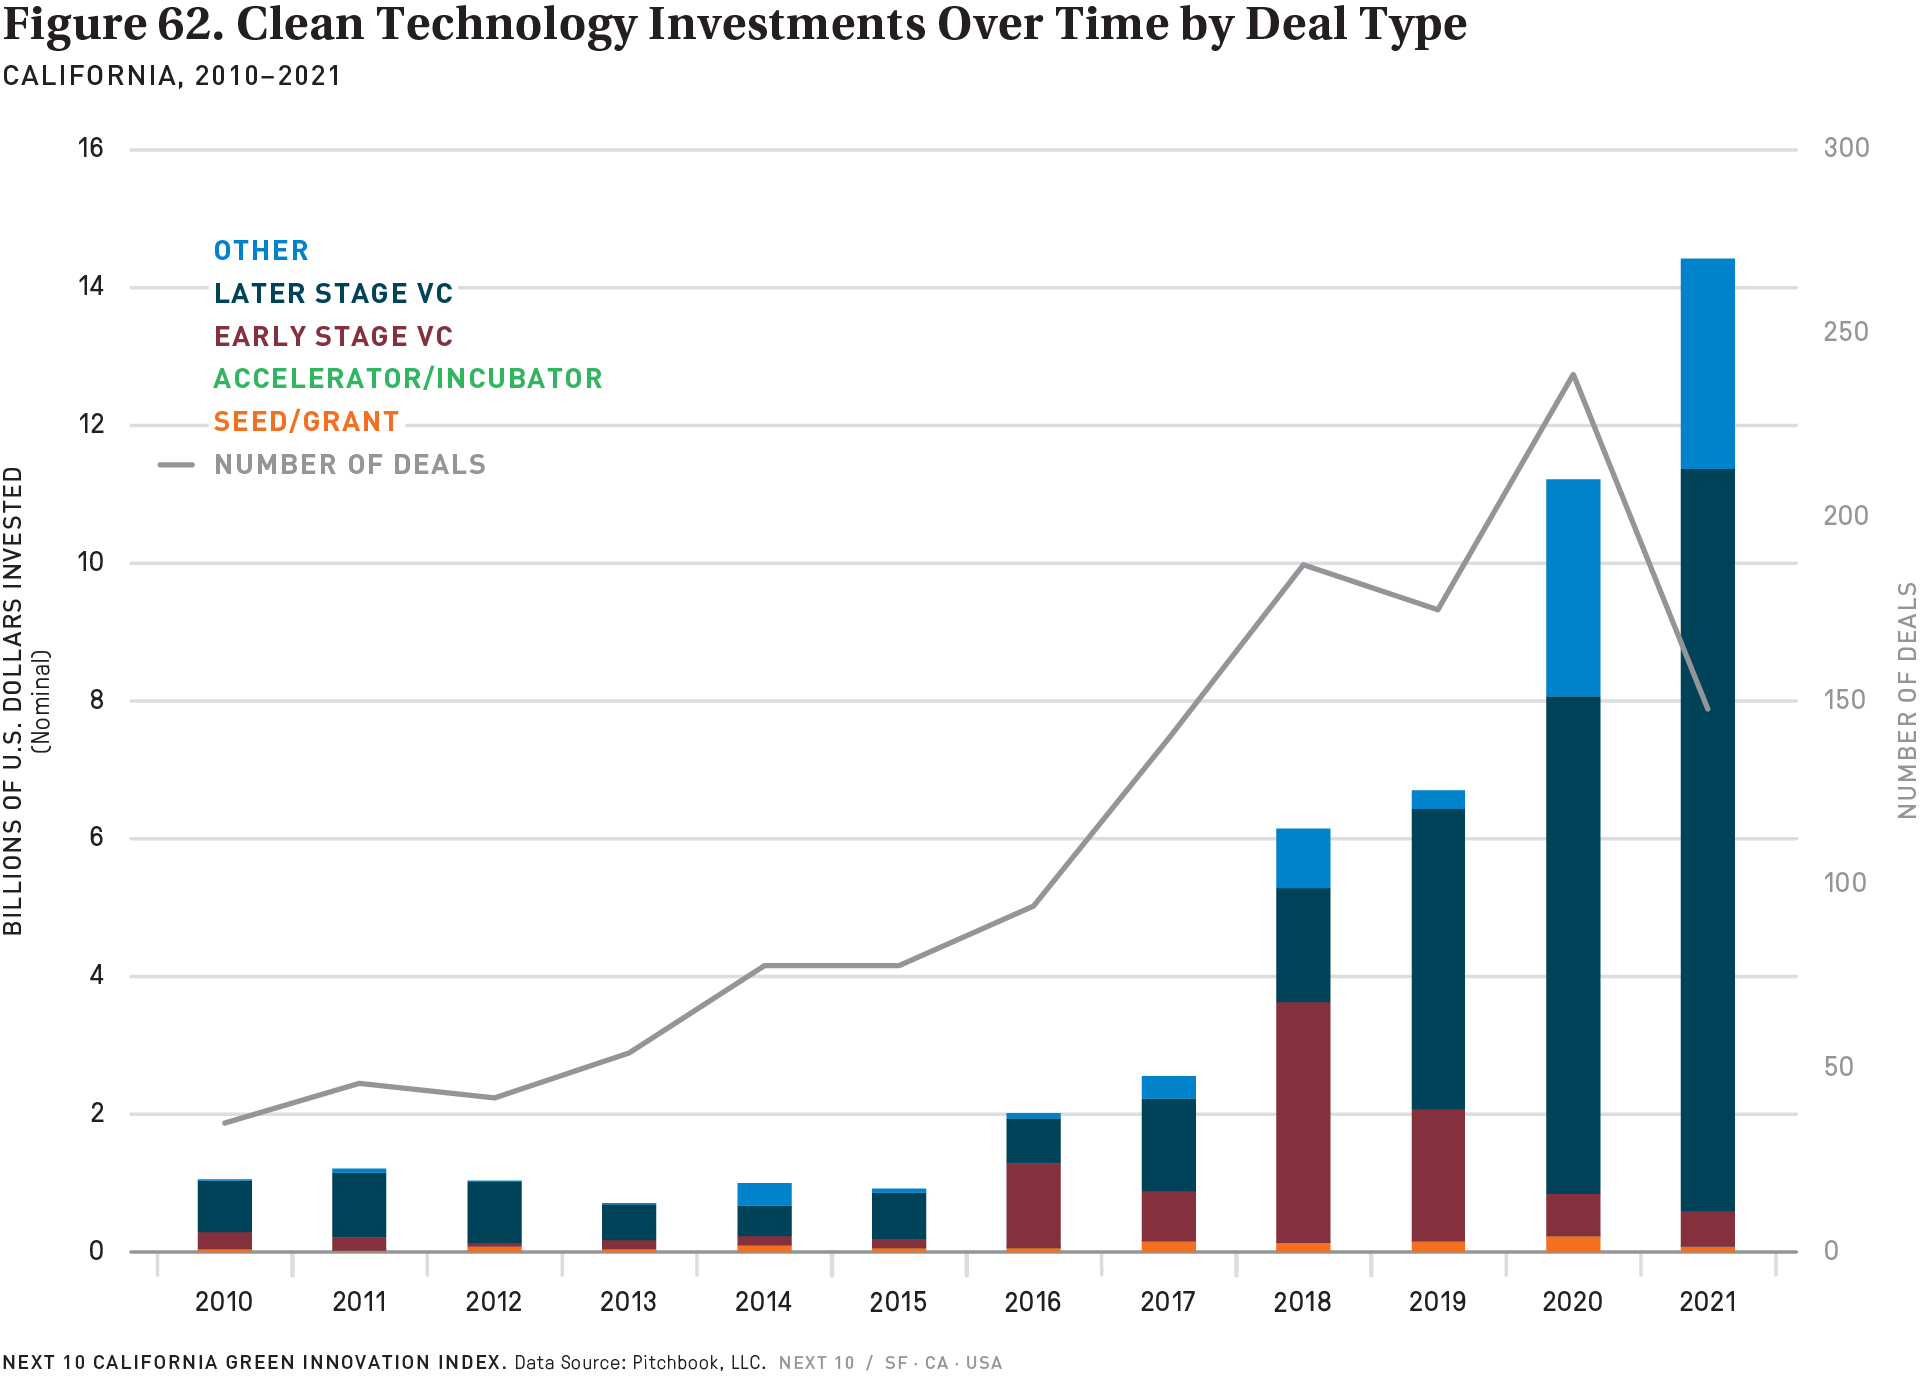
- In the past five years, clean energy jobs have grown 12.4% in California–substantial gains for a state that is already a national leader.
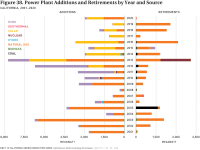
- The Biden administration this year identified two project sites in California for offshore wind development that could provide up to 4.6G W by 2030. Development of just one of the sites that California has identified for offshore wind development–Morro Bay—is projected to bring 617 permanent jobs to San Luis Obispo County and 481 to the rest of the state. The construction of that project is expected to create $3.7 billion in economic value for the state, the equivalent of 11,368 jobs, according to an analysis by the REACH lab at California Polytechnic University.
Next 10 owns the copyright to all graphics in this section, and they are available for download and limited use, subject to our Terms of Use. Please contact Next 10 at info@next10.org with any questions.