Publications
2020 California Green Innovation Index
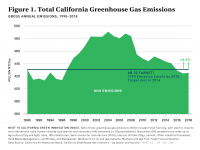
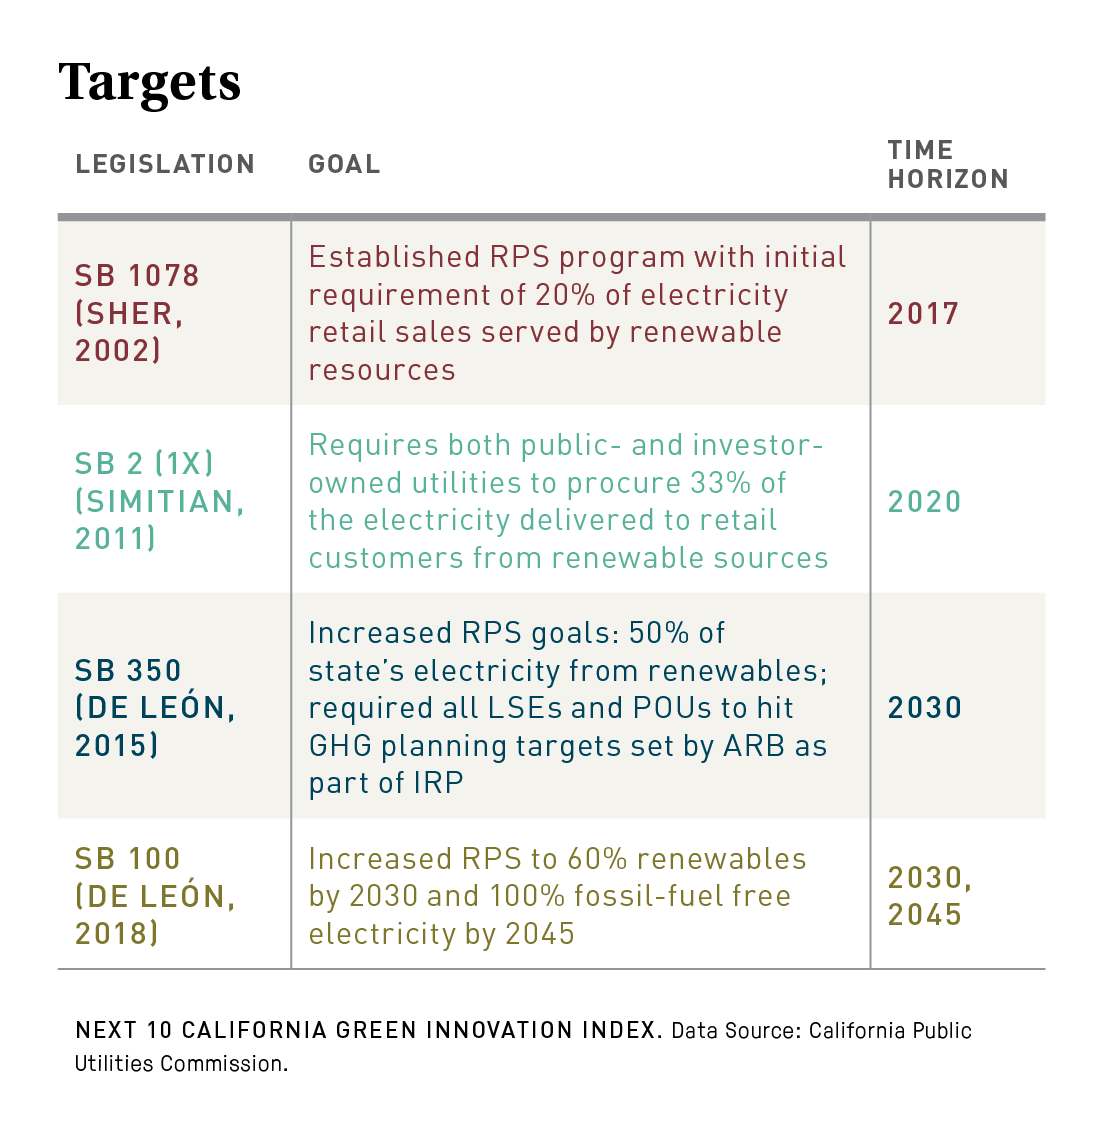
The 12th annual California Green Innovation Index finds that California's 2018 greenhouse gas emissions—the latest year for which data are available—rose overall for the first time since 2012, driven by increases in the power and commercial sectors. However, the report finds that California must now reduce its emissions by an average of 4.9 percent each year from 2020 to 2030 to cut emissions to 40 percent below 1990 levels by 2030, as mandated under SB 32. The largest one-year emissions drop California has ever achieved was at the height of the Great Recession in 2009, when climate pollution fell 6.1 percent. While 2020 may see a similar emissions drop, the state has never cut emissions more than 2.6 percent in a year while not experiencing an economic downturn since California passed AB 32 in 2006.
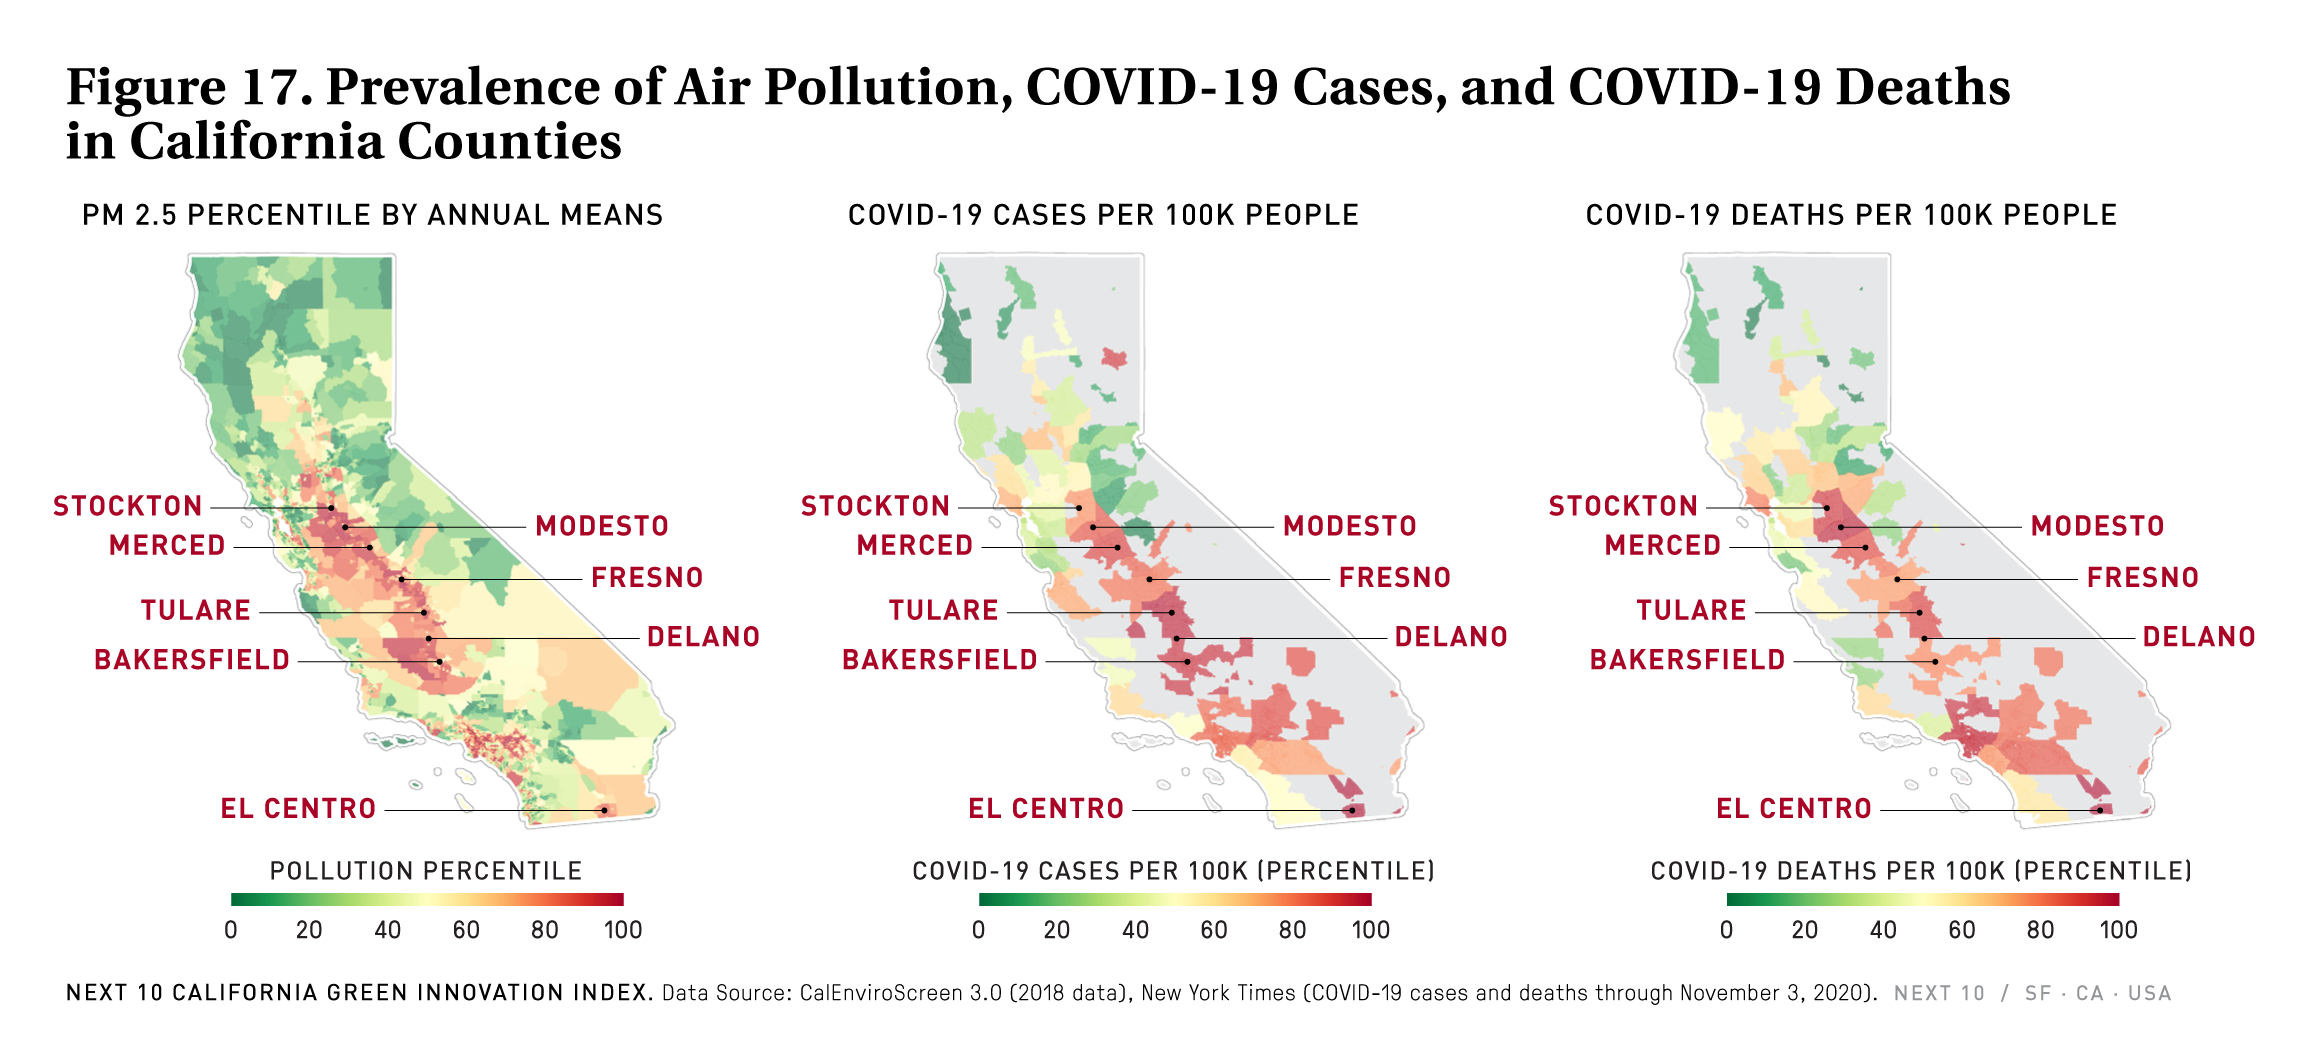
The report emphasizes how a steady rise in commercial emissions, a surprise uptick in power sector emissions, and—for the first time in three years—a dip in transportation pollution, illustrate some of the challenges and opportunities facing policymakers. California’s record-breaking wildfire season also adds to the complicated picture. As of September 13, 2020, emissions from wildfires reached 83 MMTCO2e—82.4 percent above the 45.5 MMTCO2e recorded for wildfire emissions in 2018. While the state’s forests also serve as a carbon sink, the increasing threat of wildfires and the kind of mega-fires experienced in 2020 pose a significant emissions challenge—not to mention the impacts of particulate matter pollution, which further worsen air quality throughout the state.
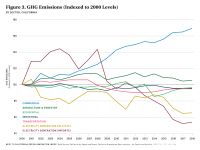
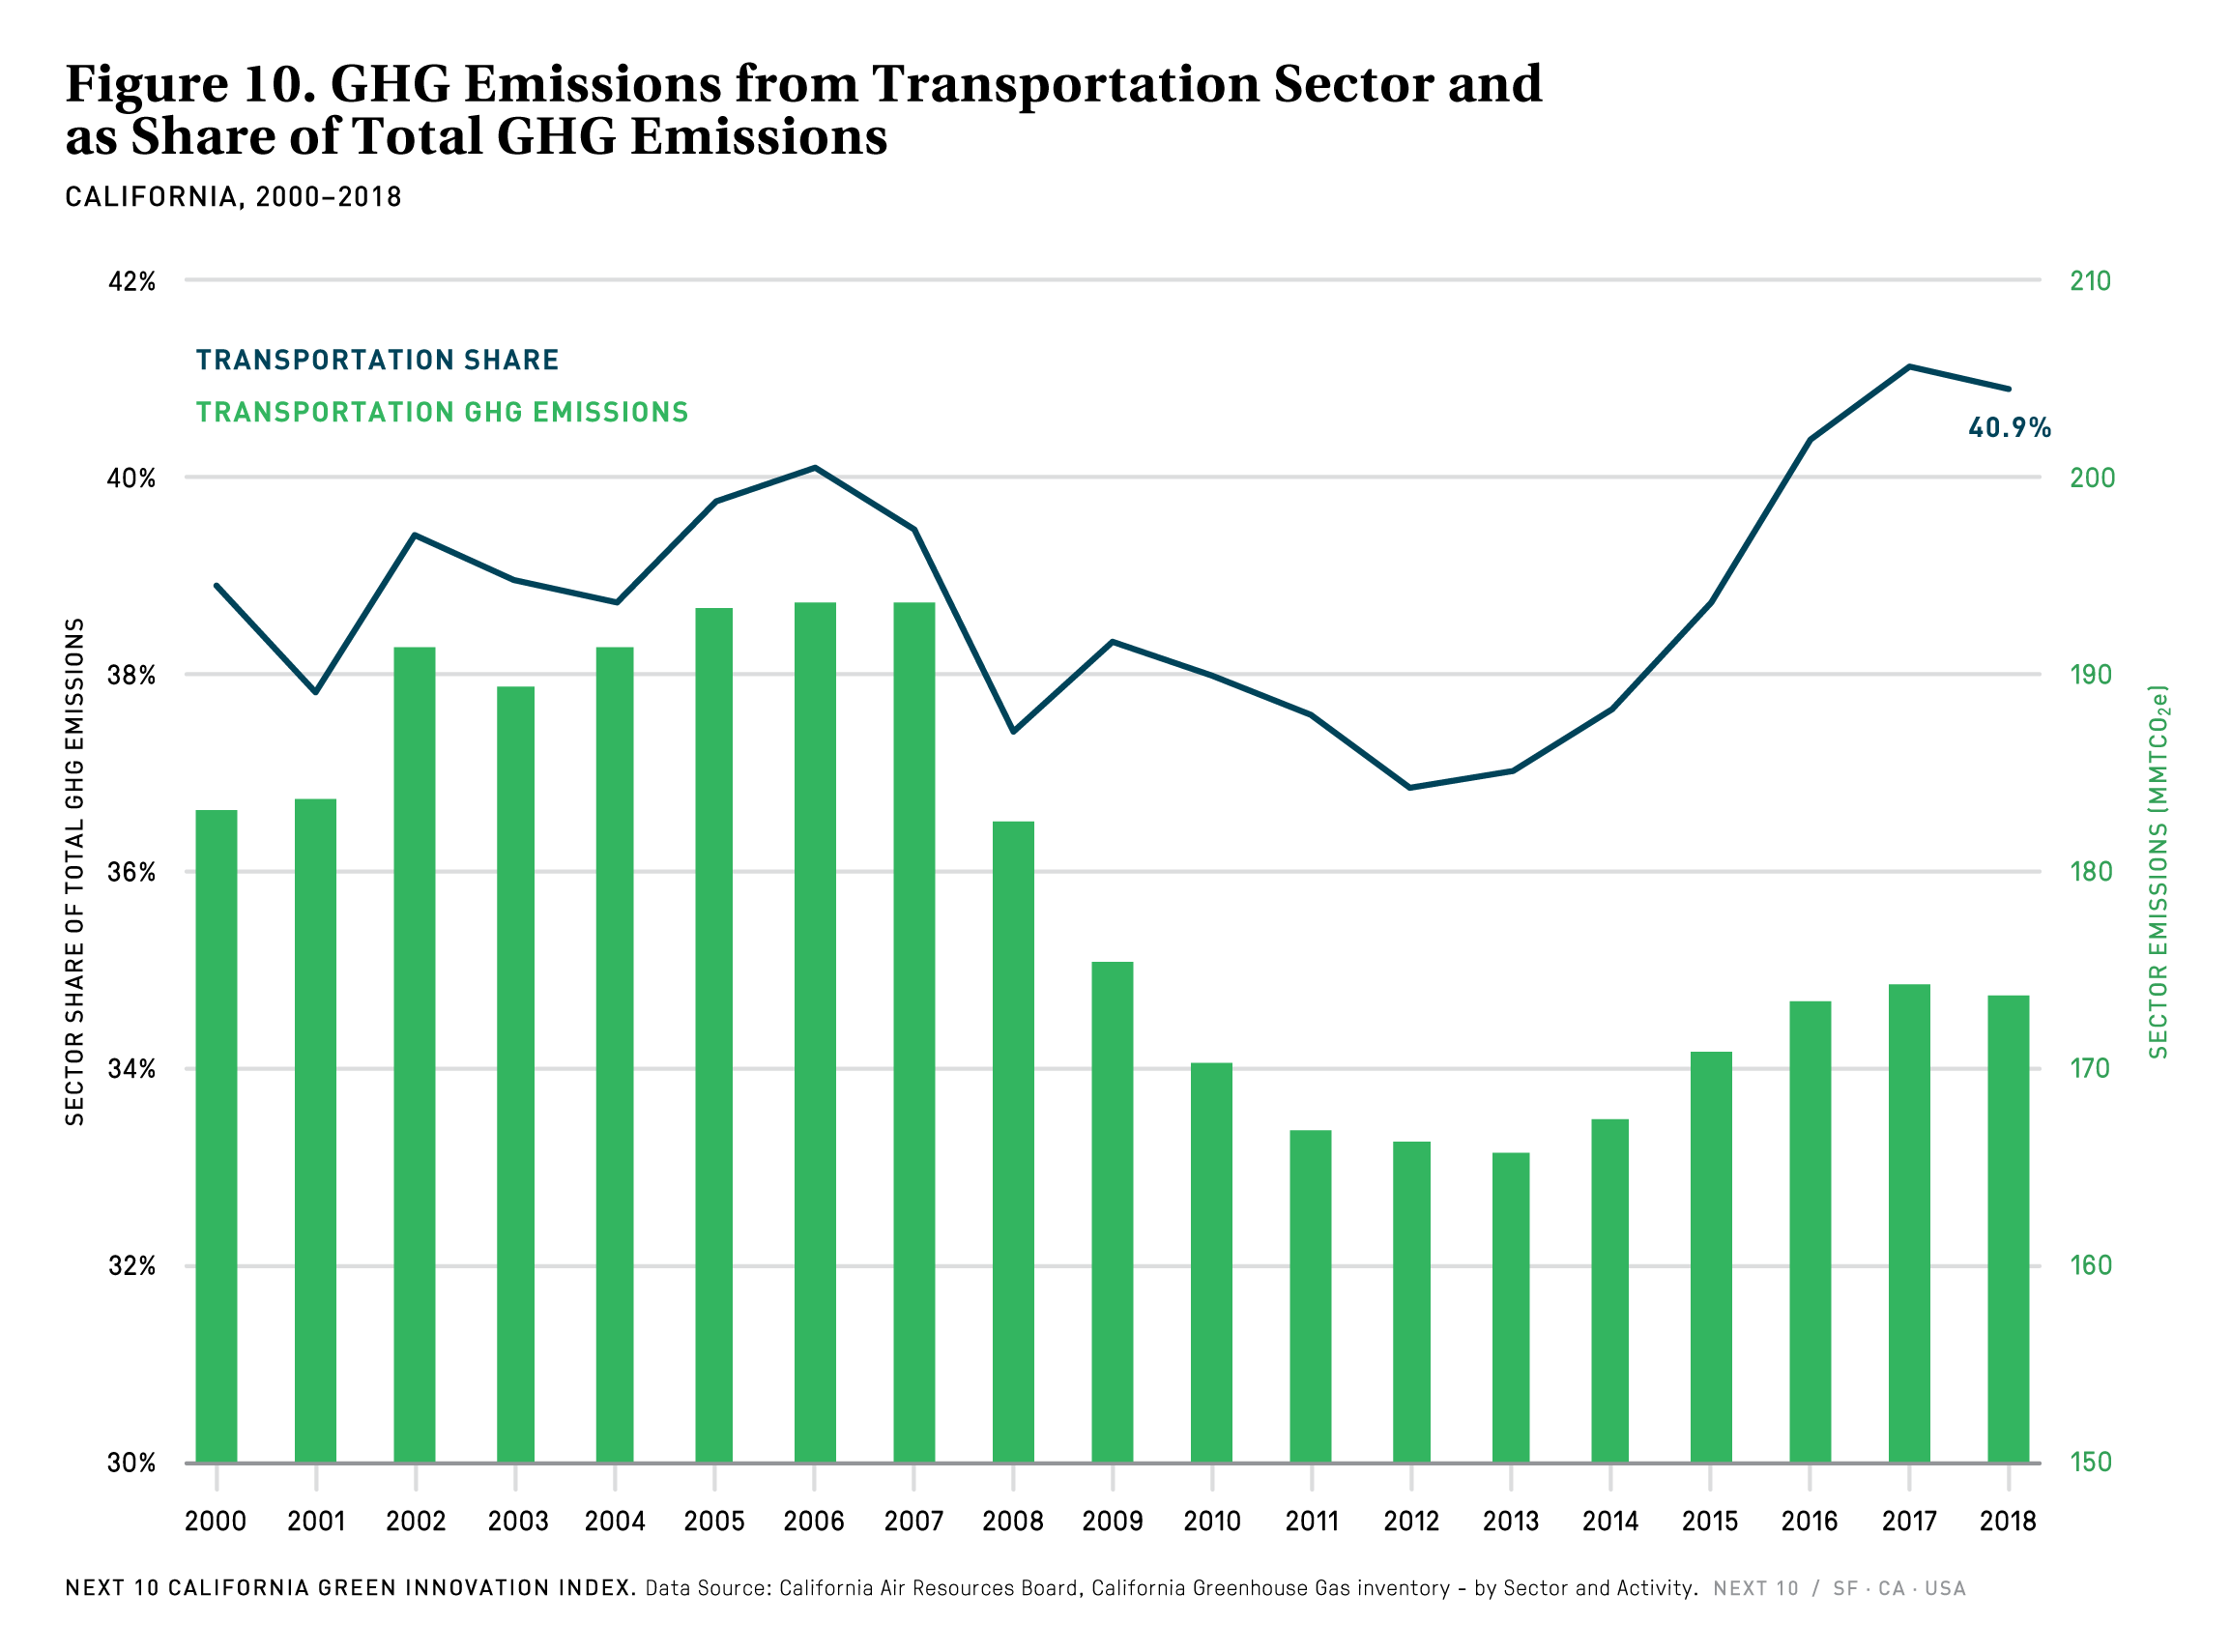
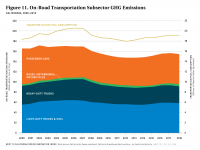
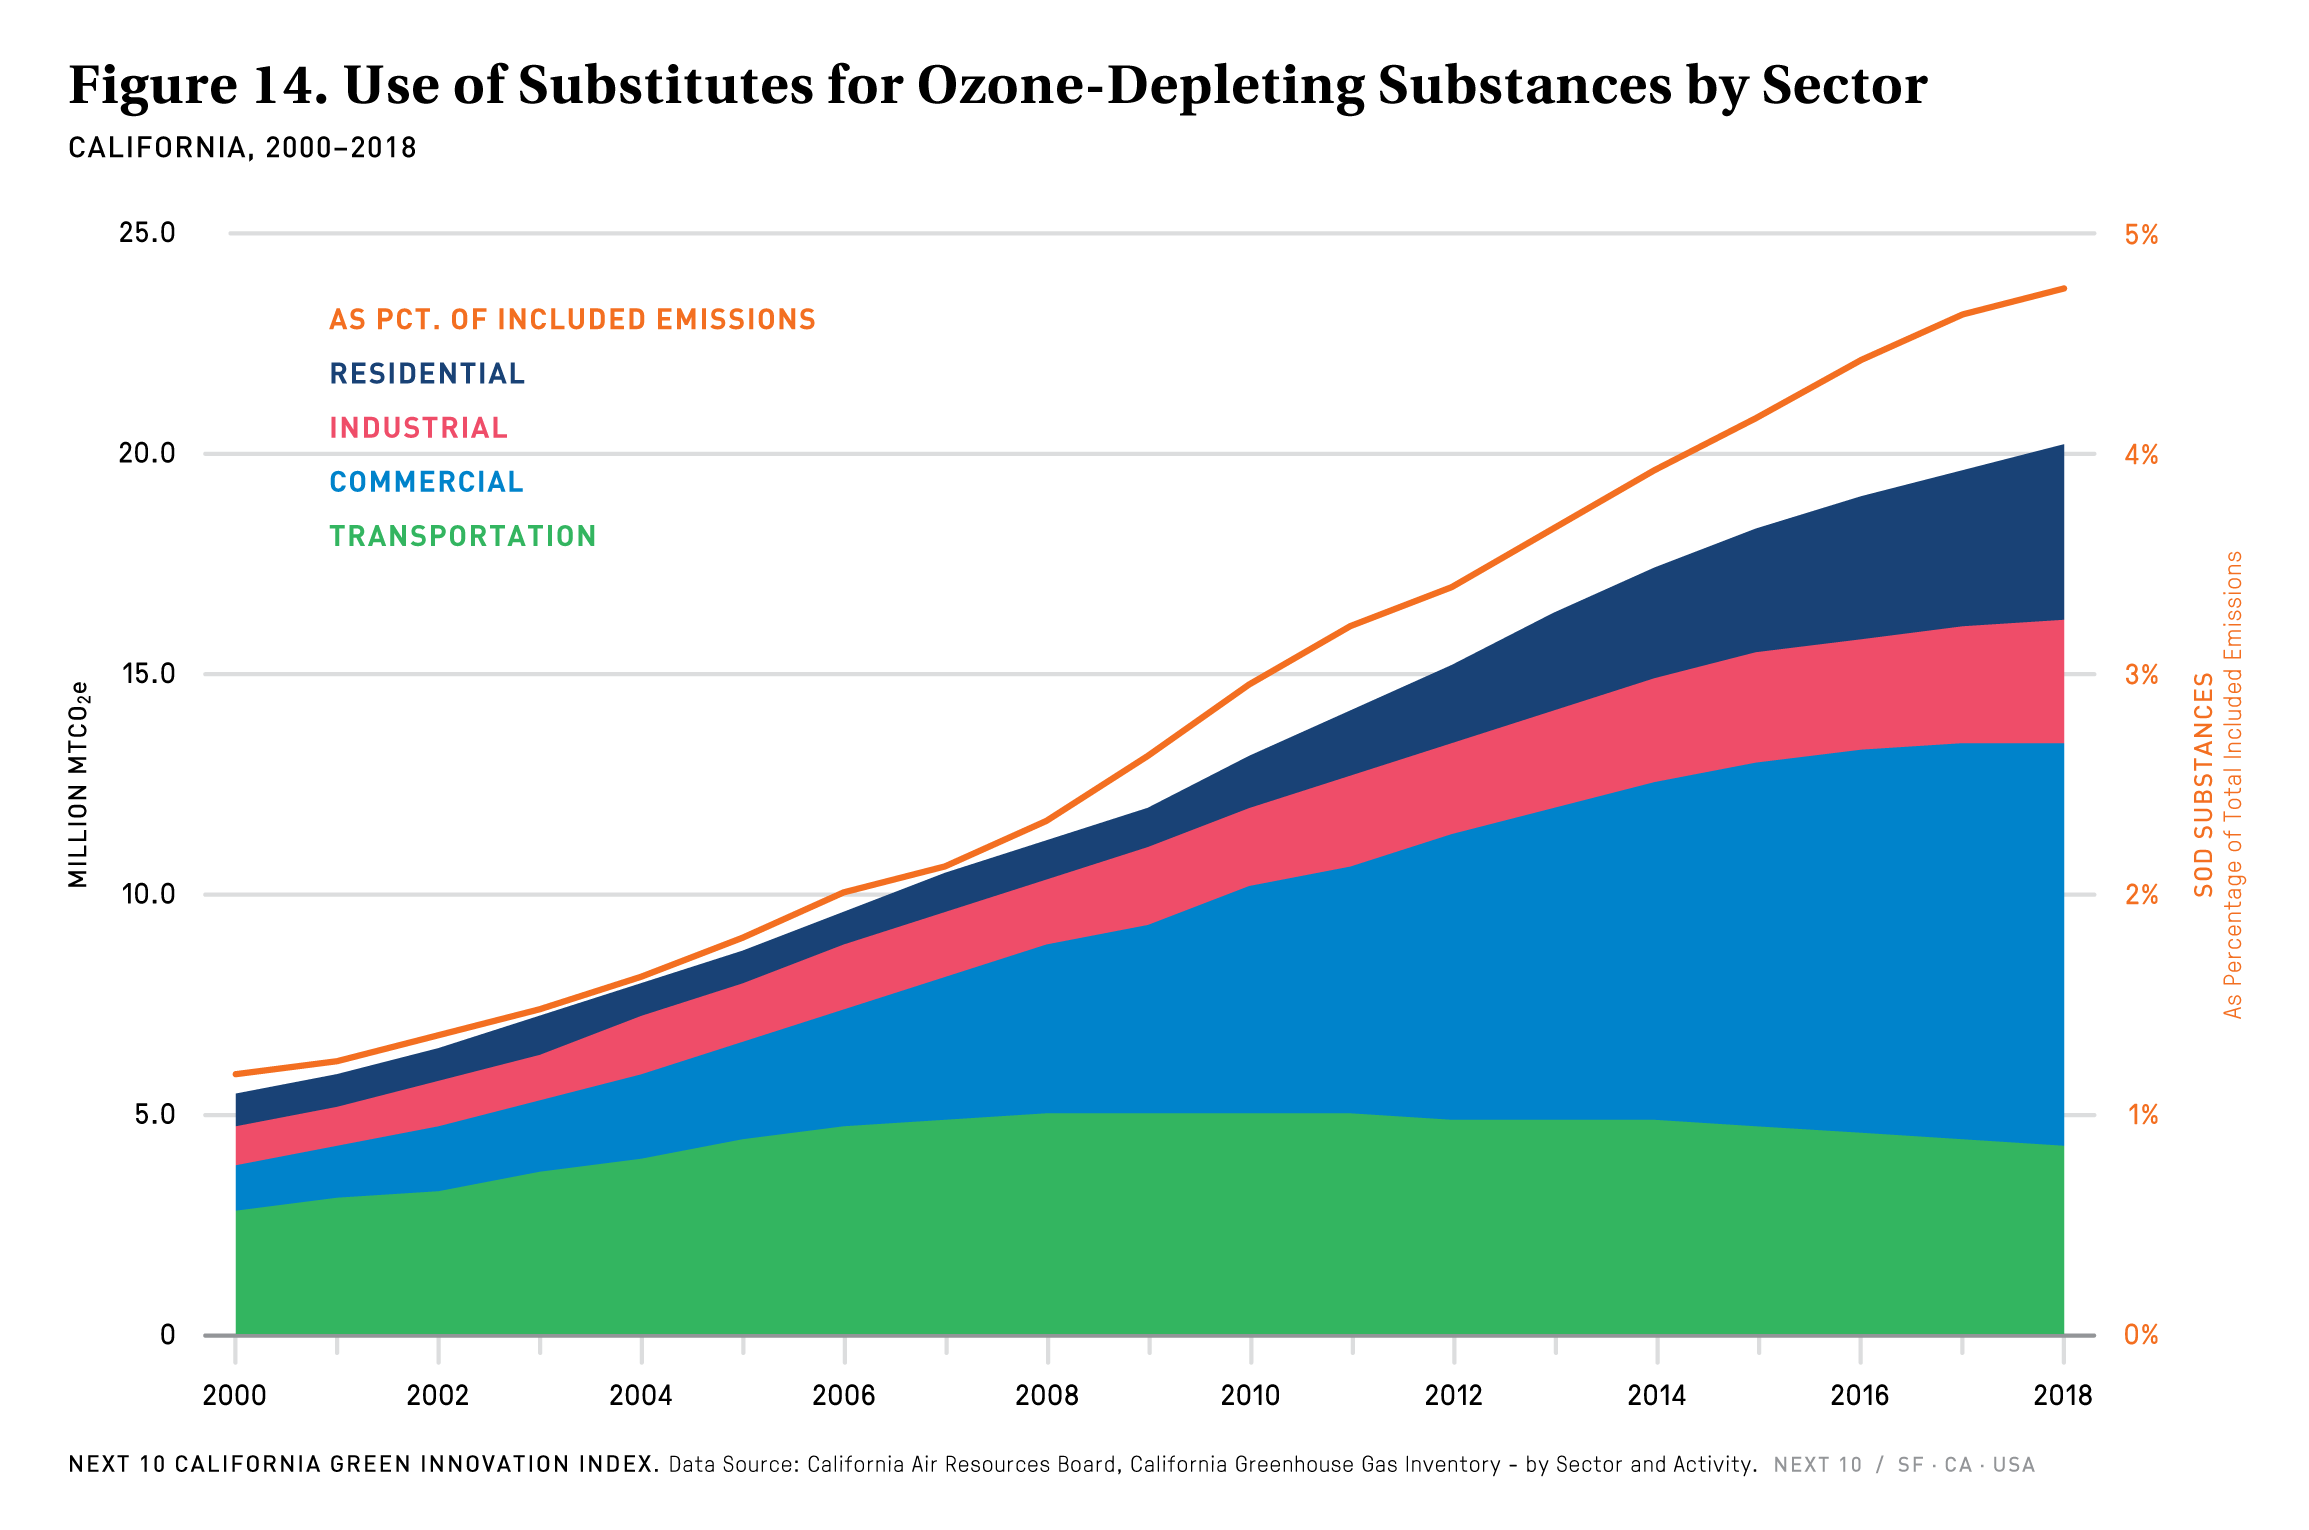
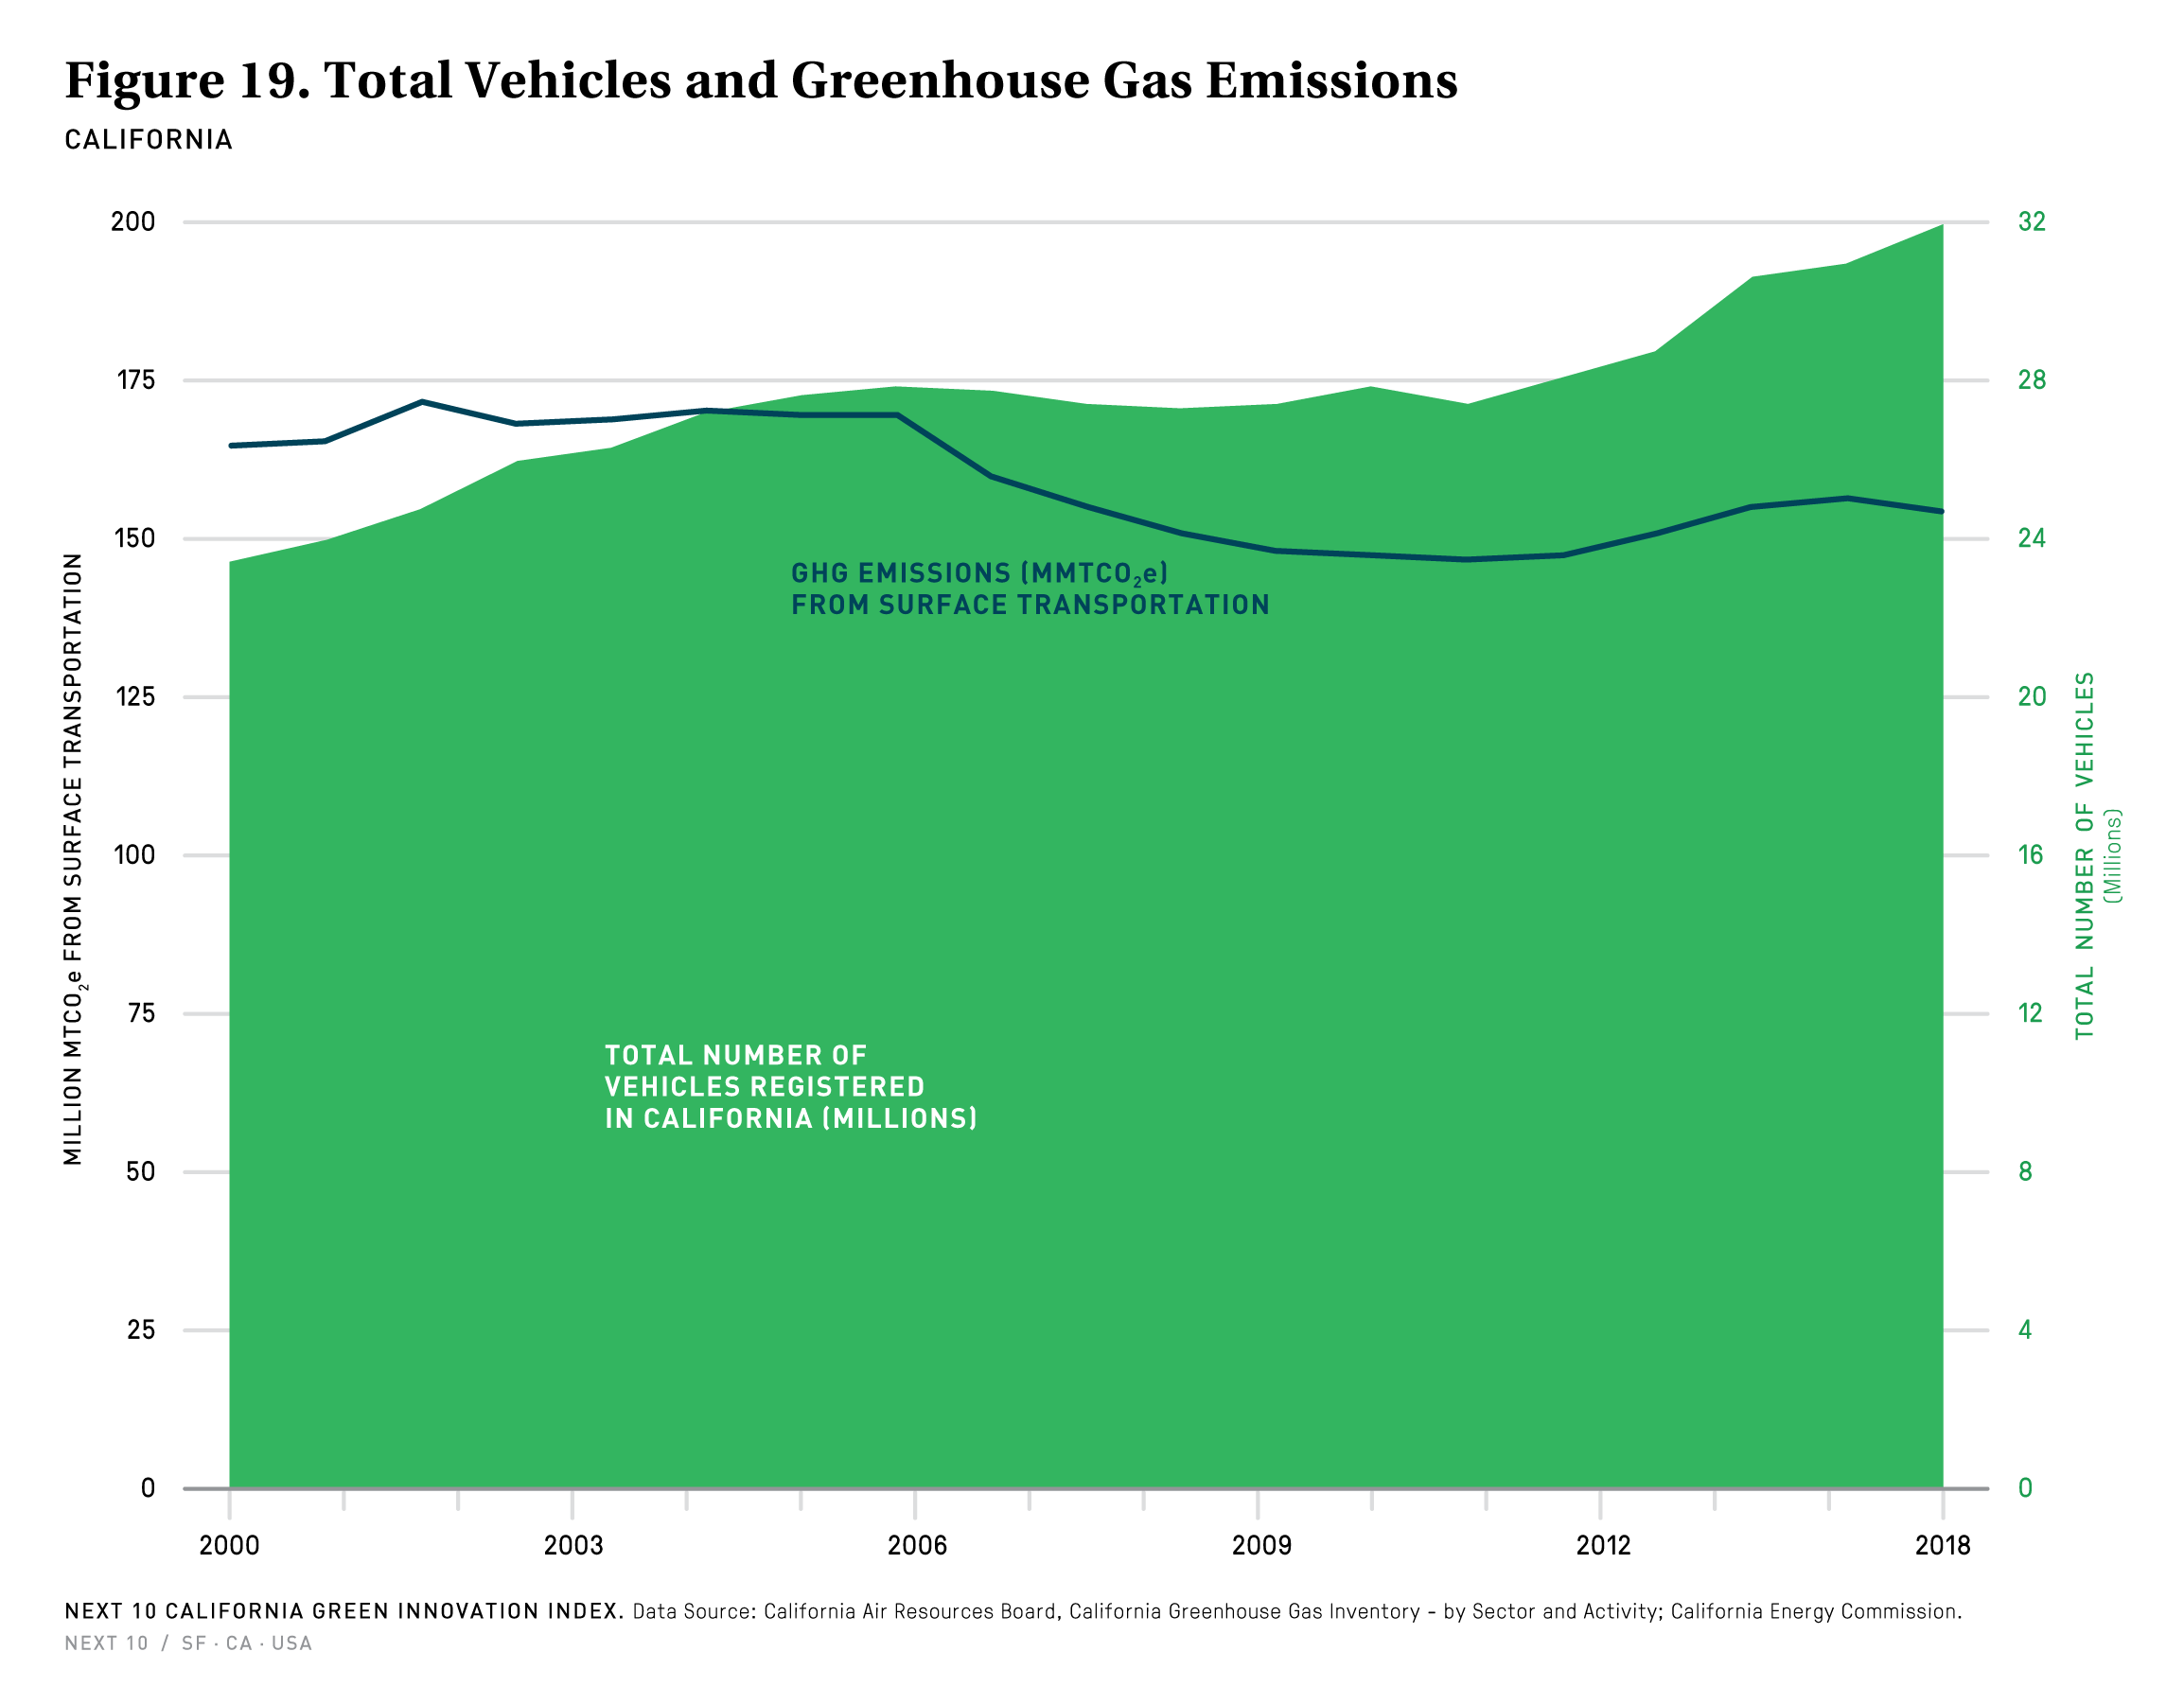
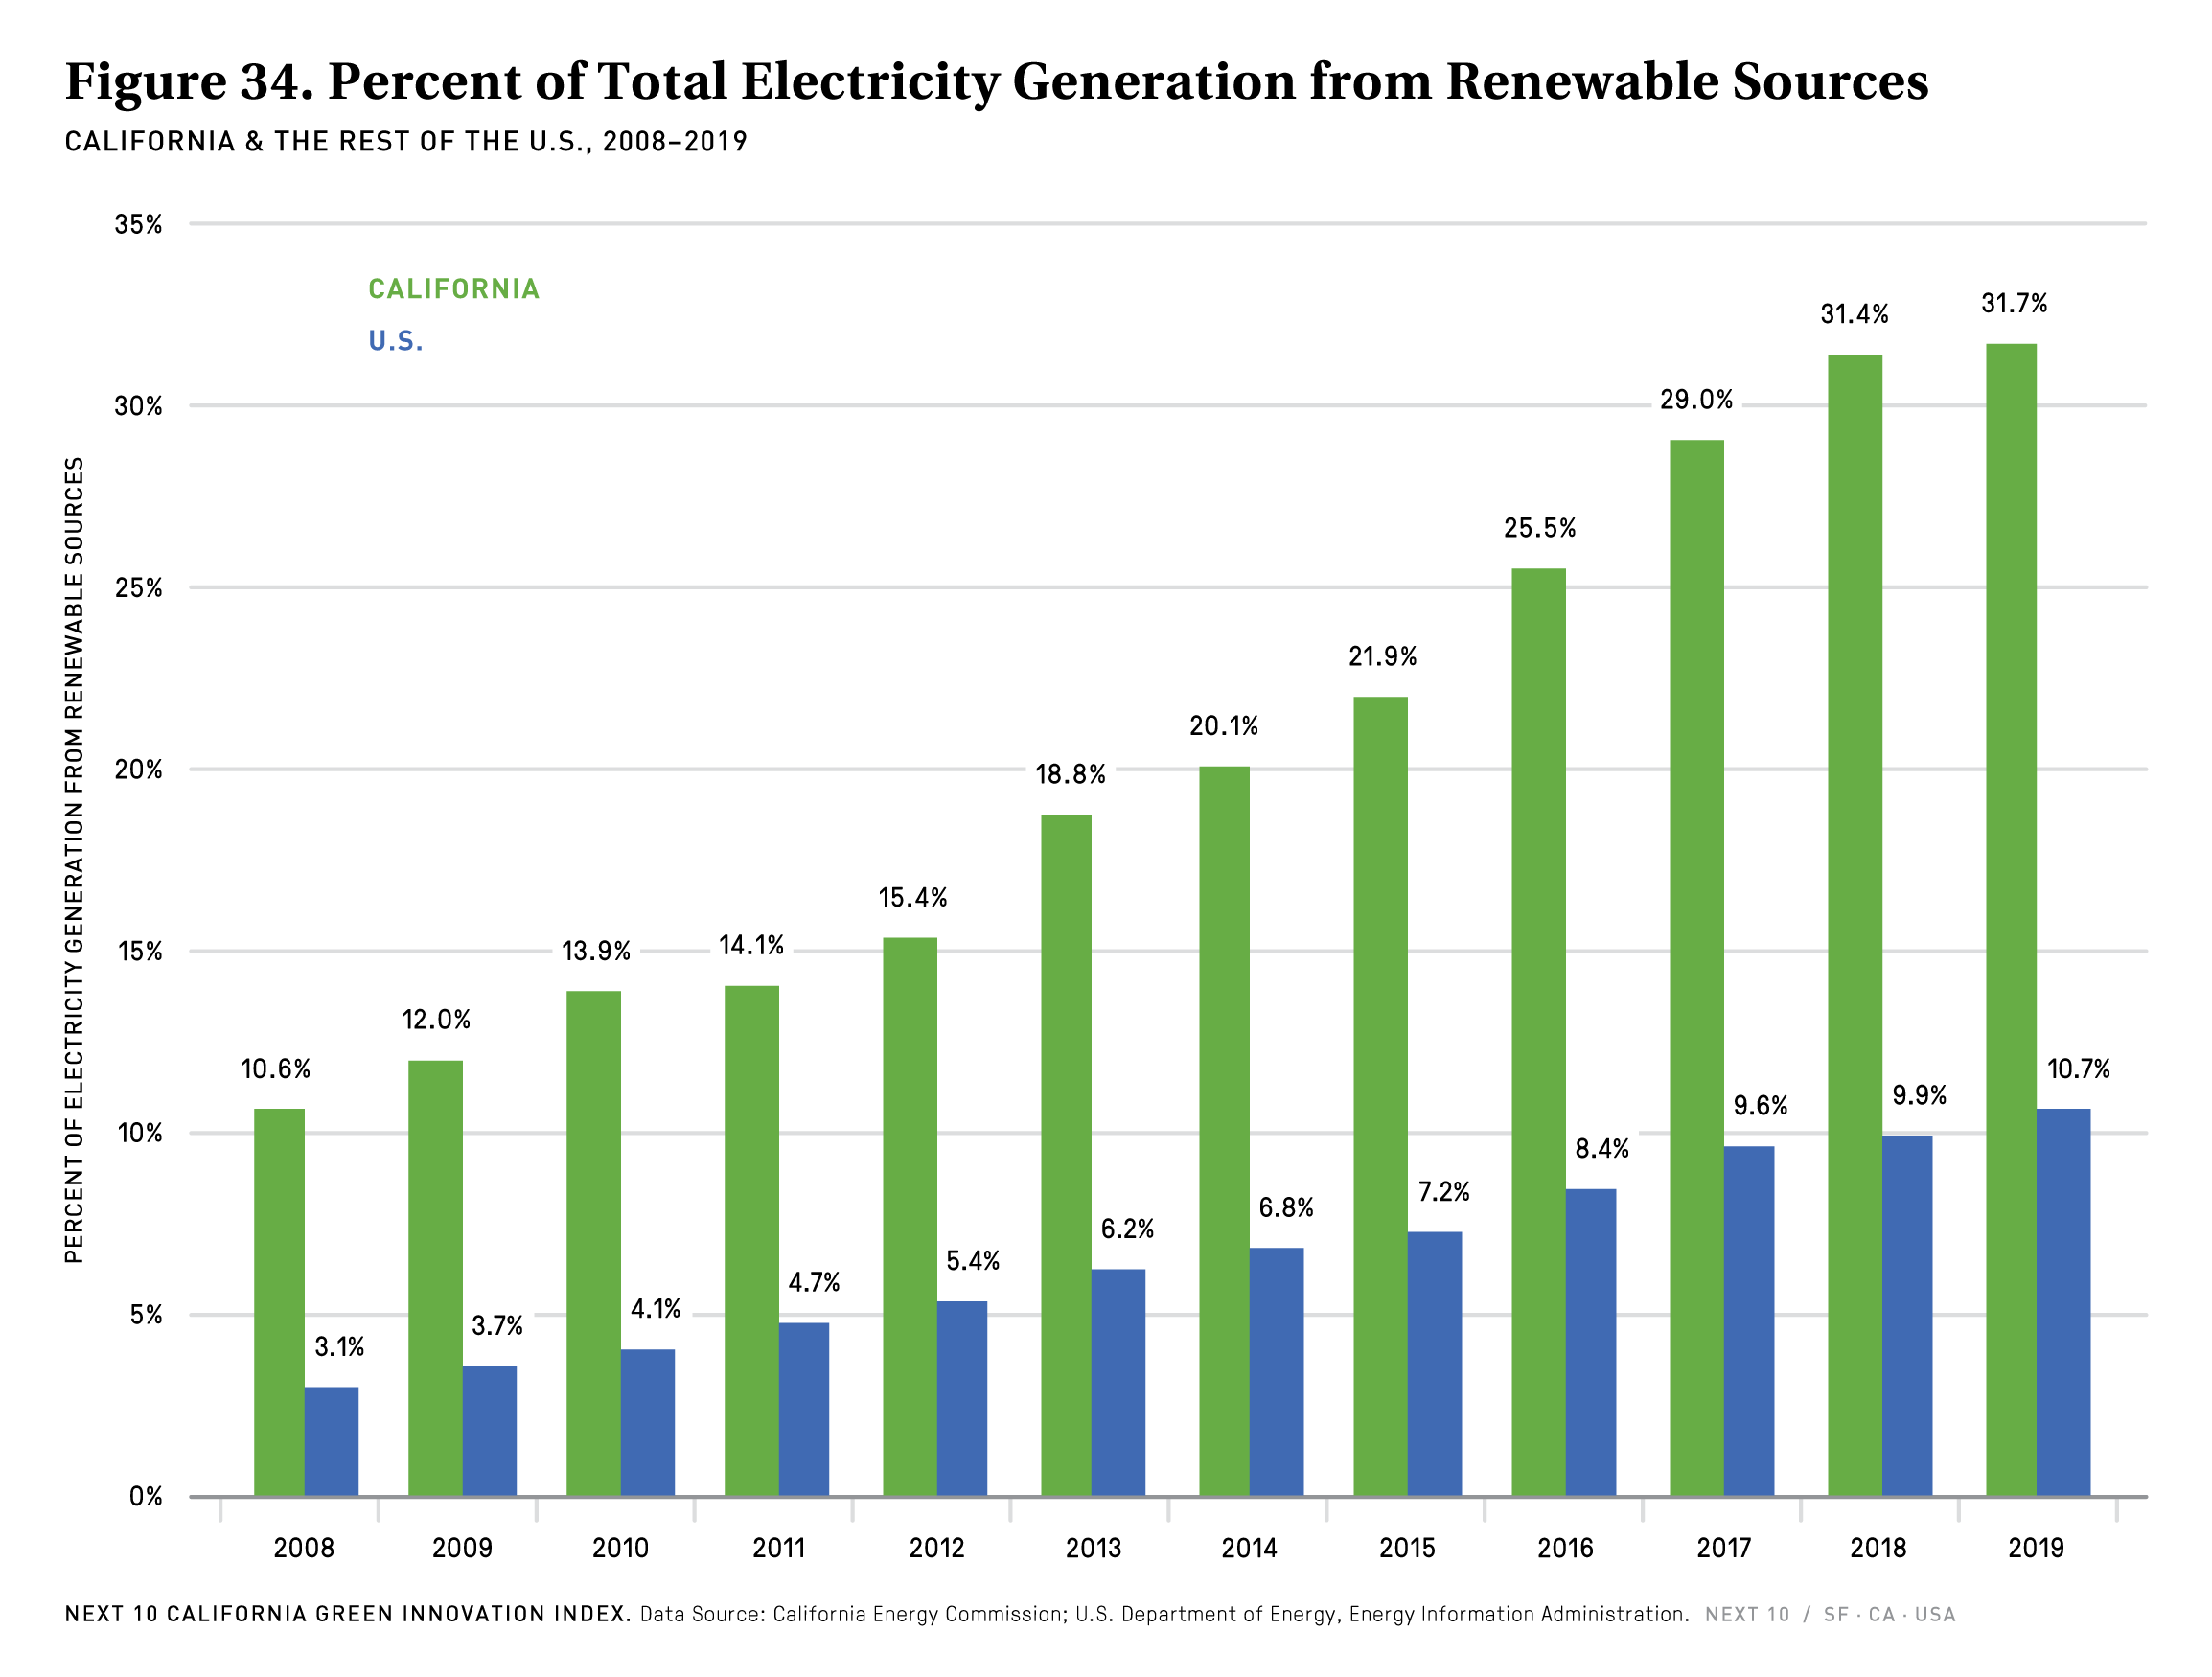
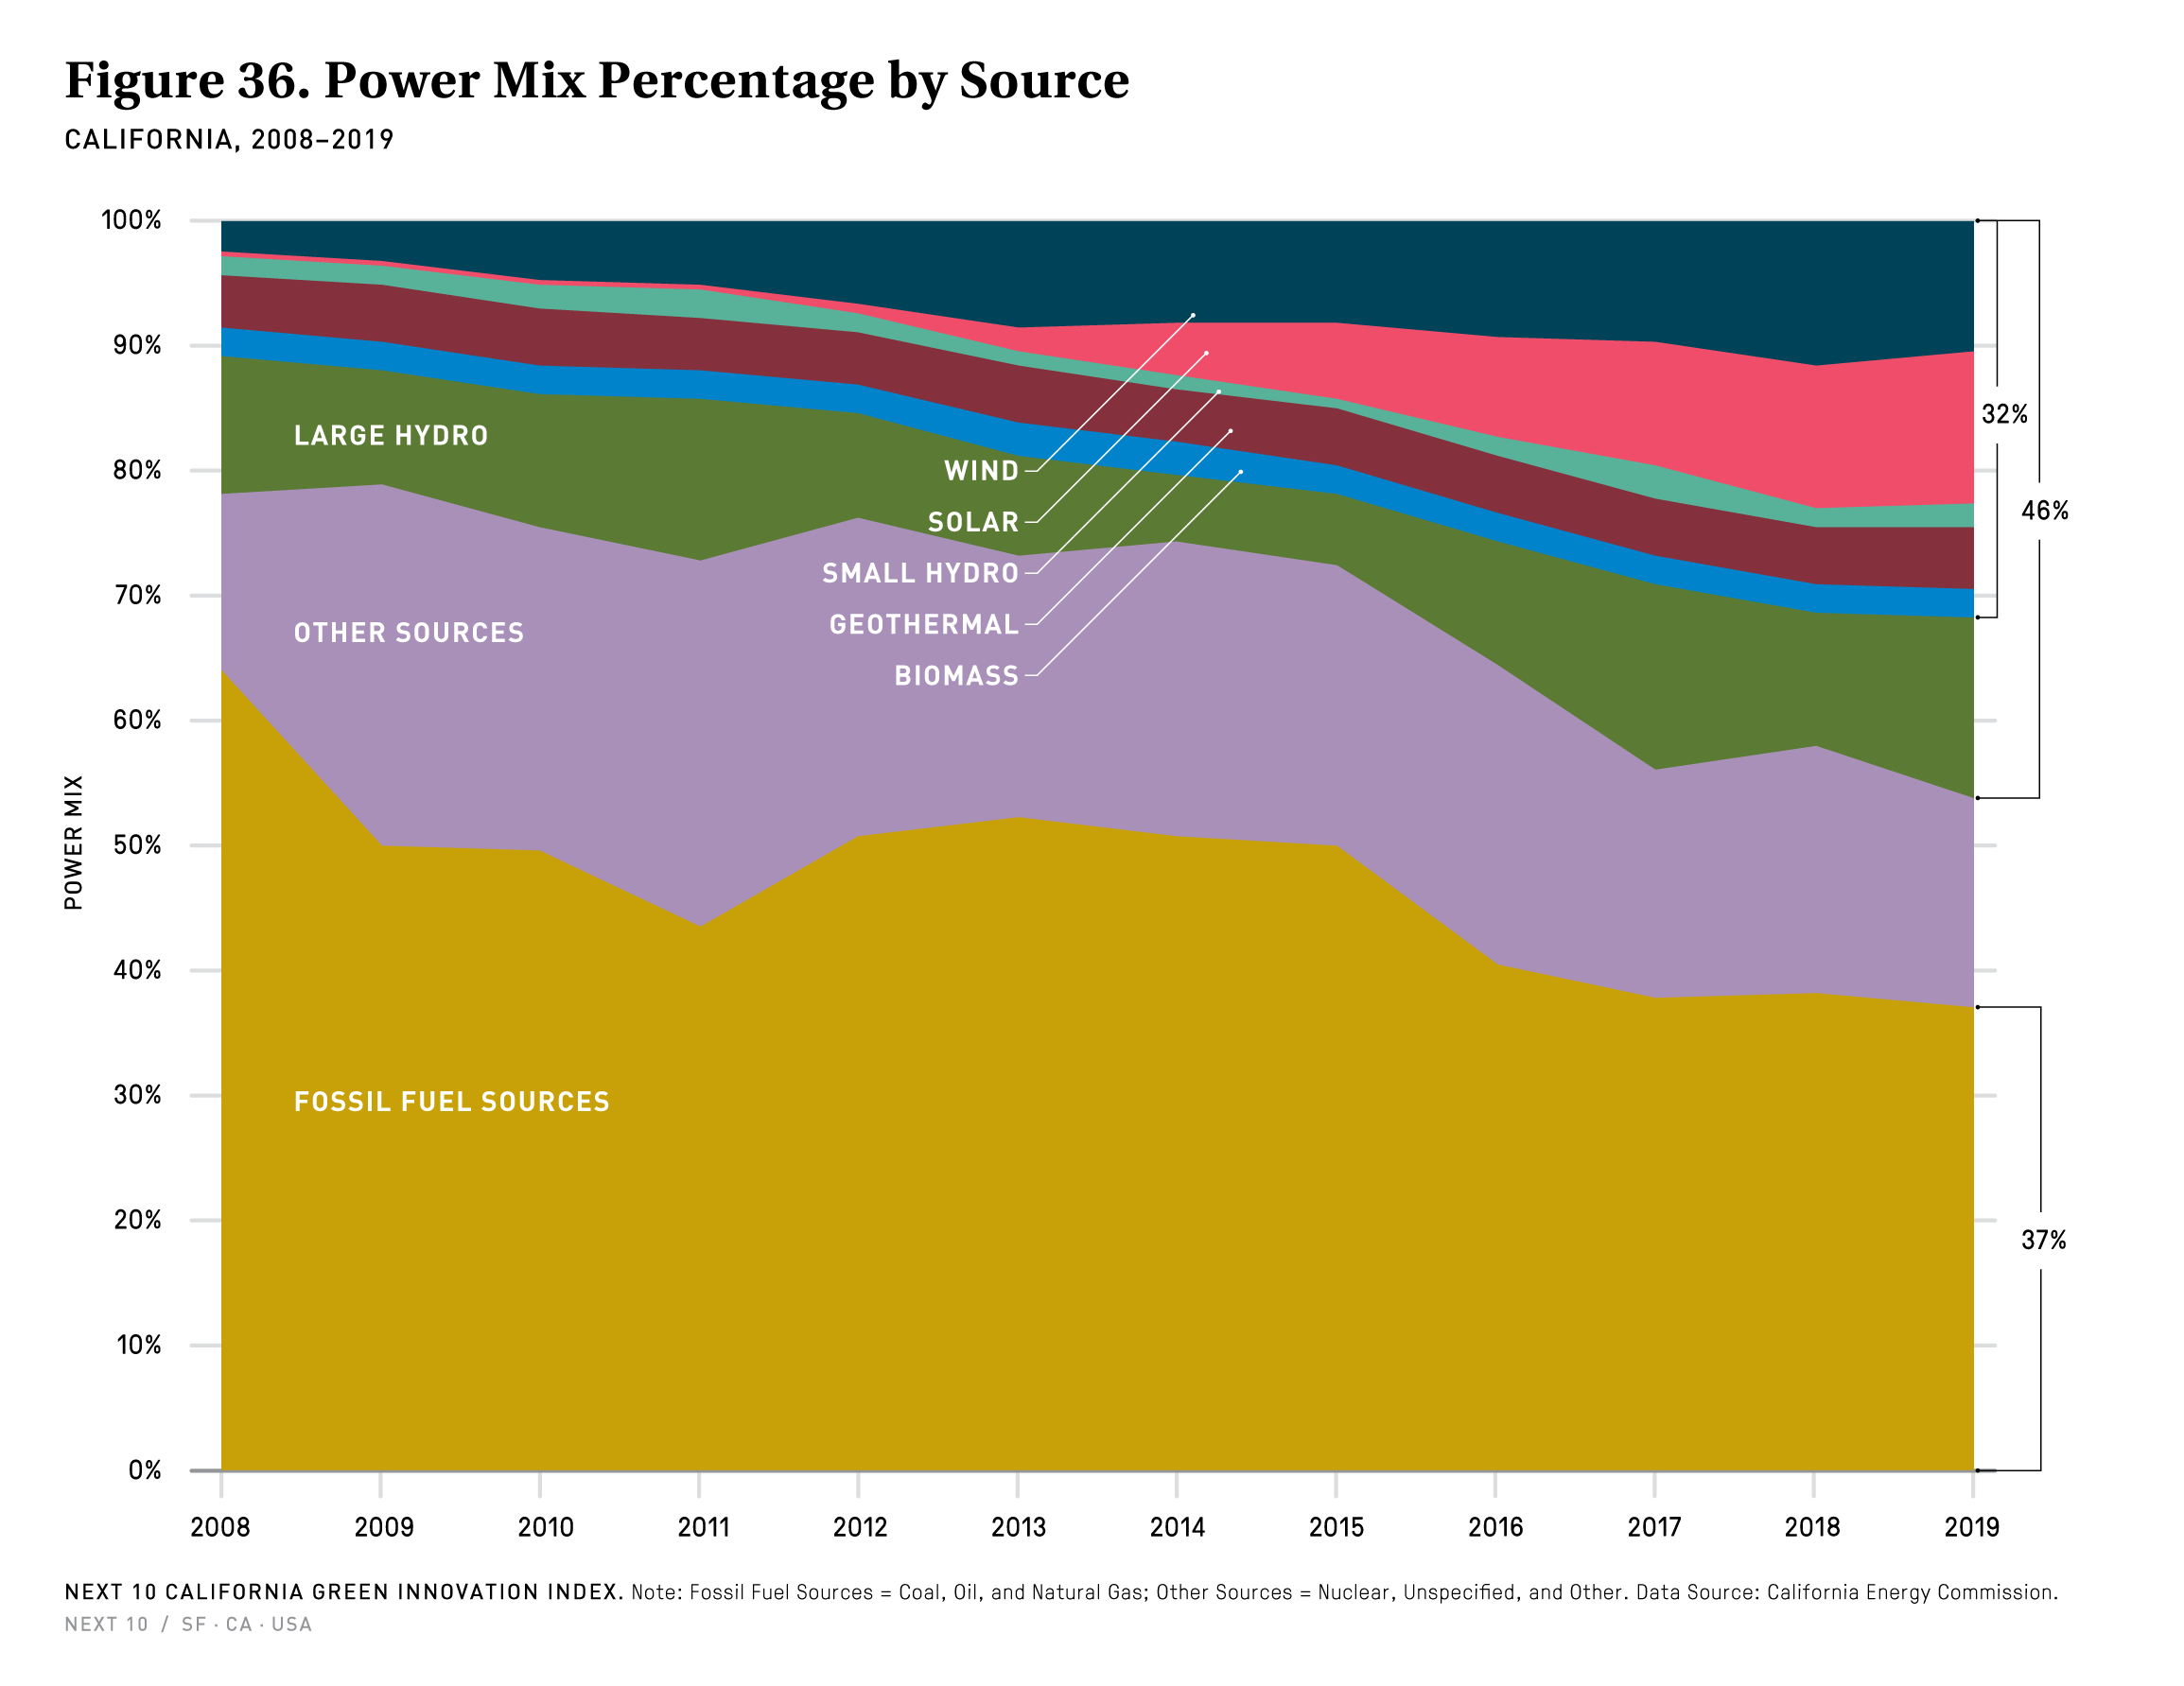
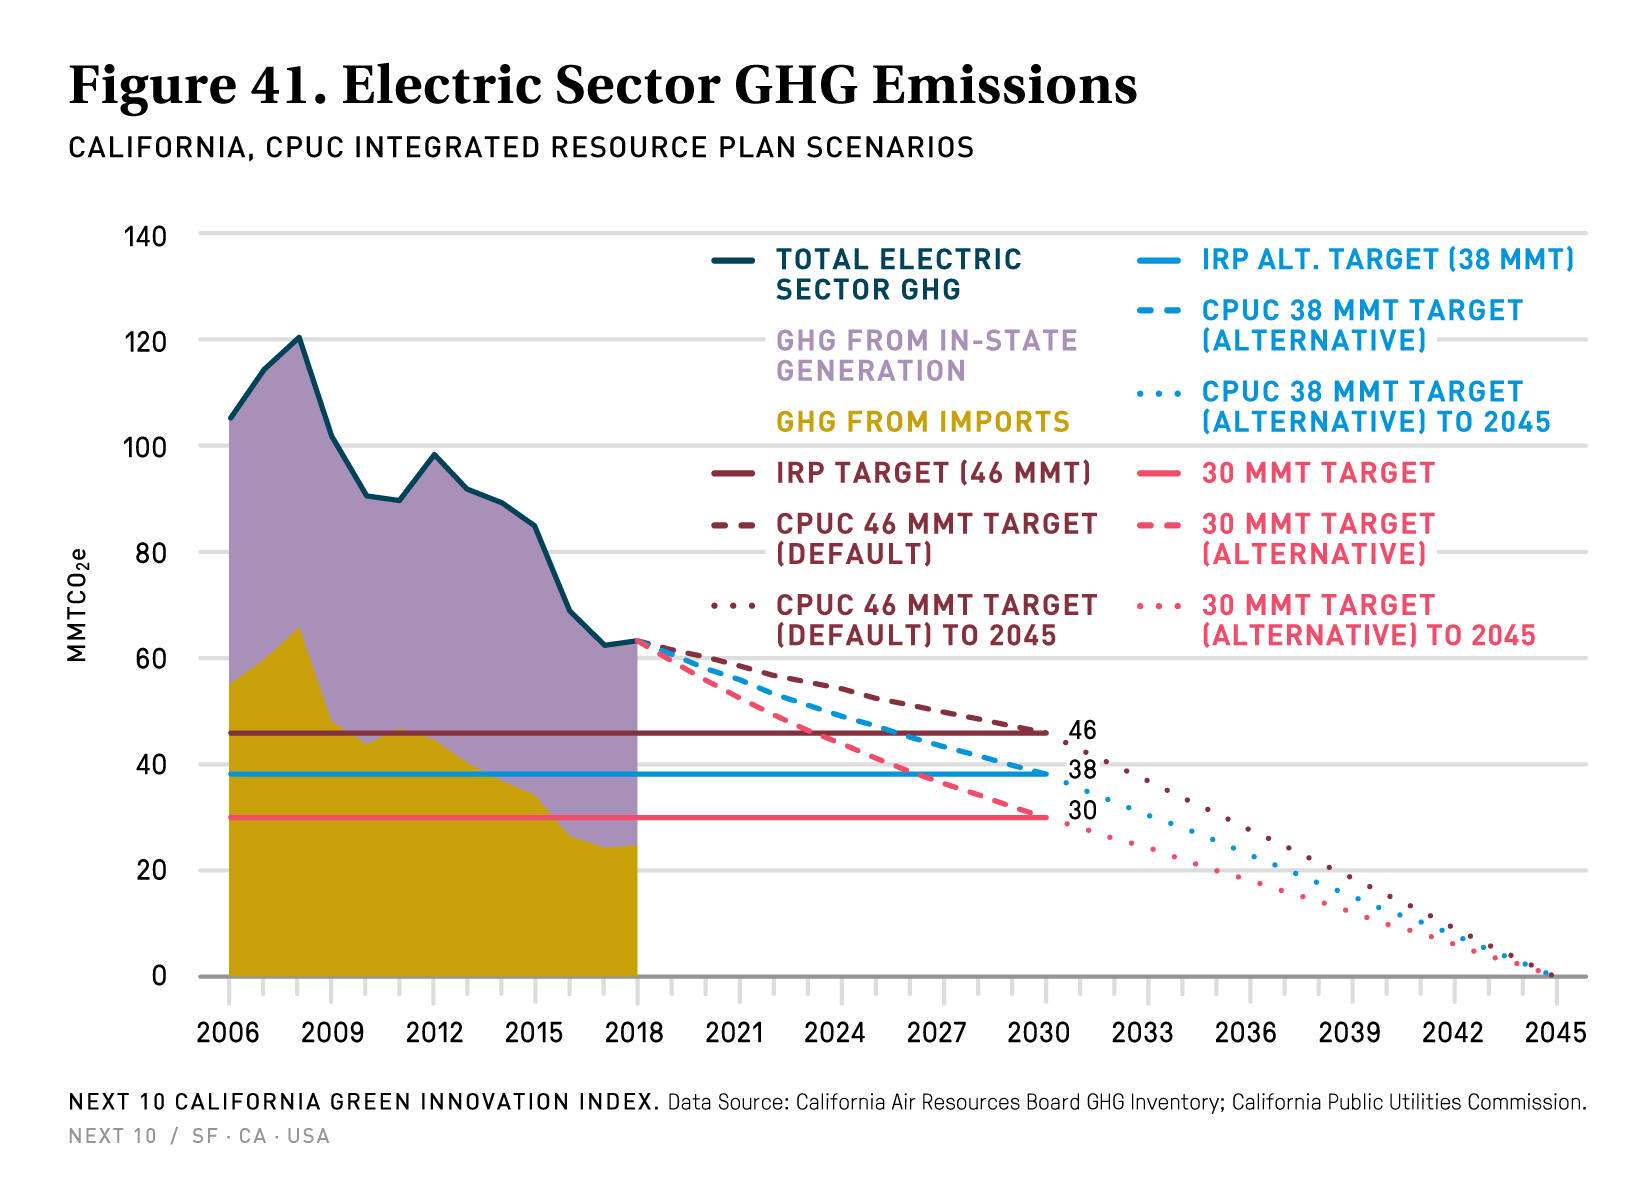
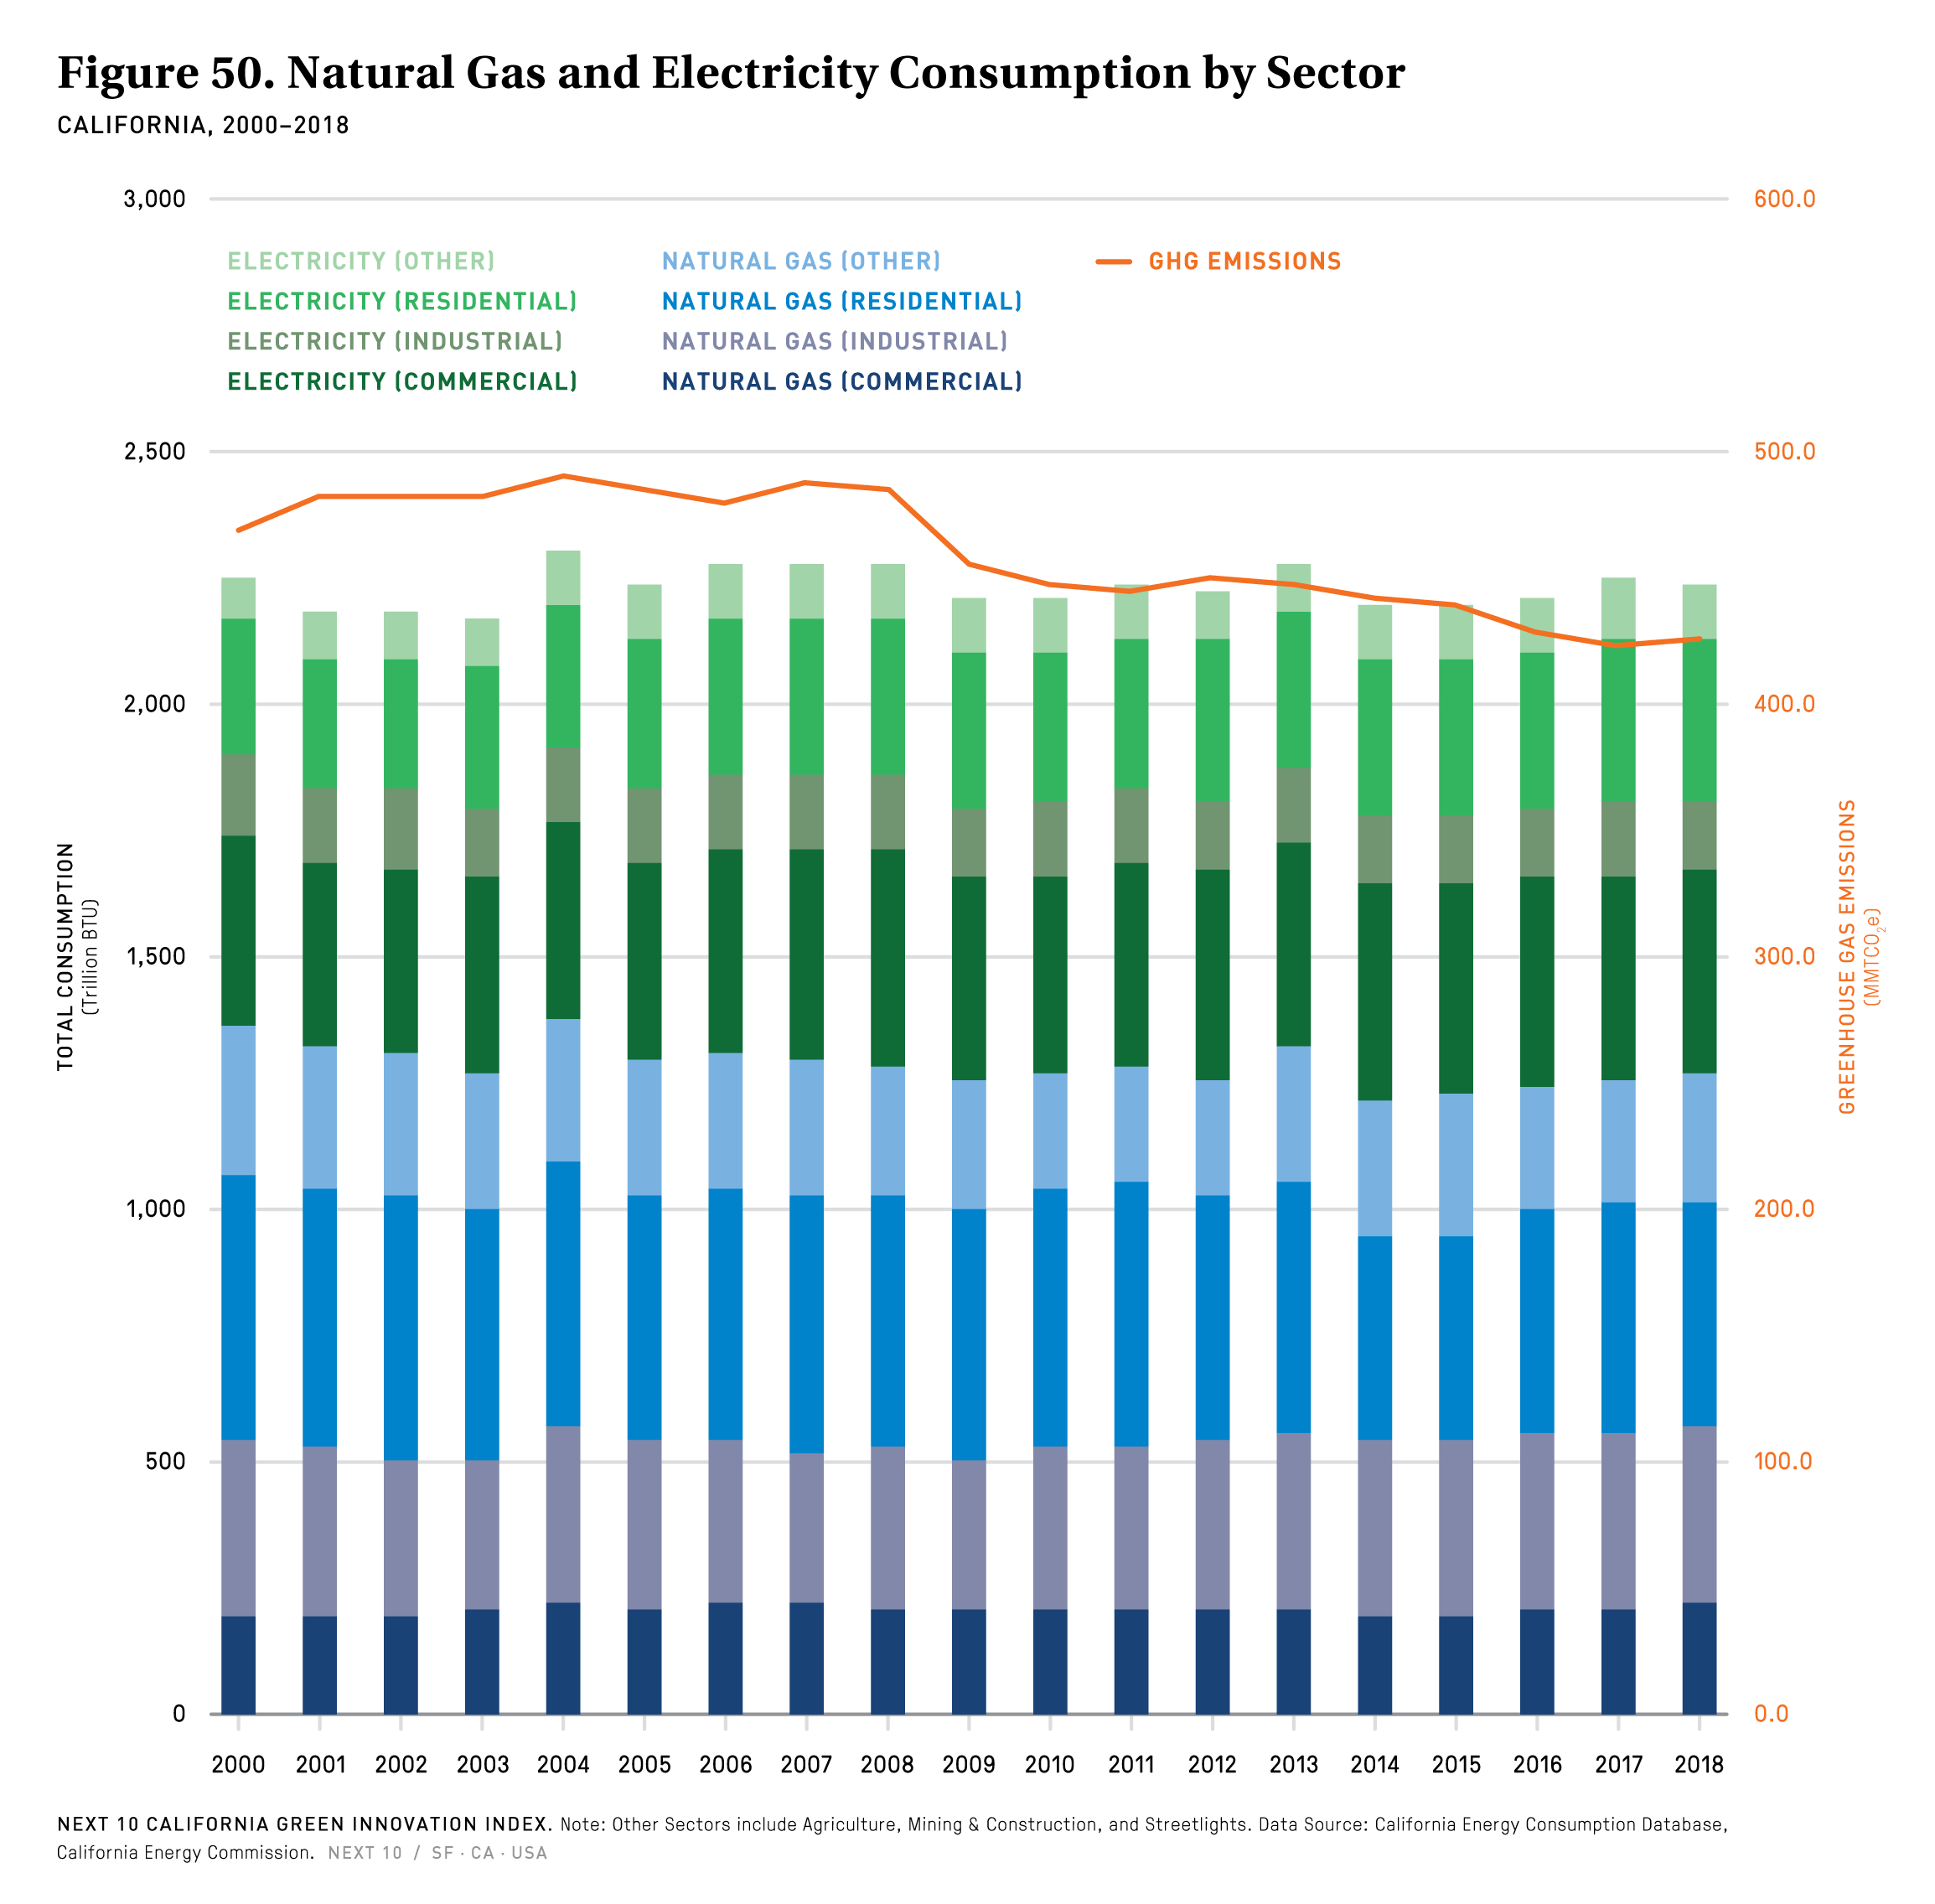
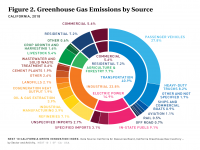
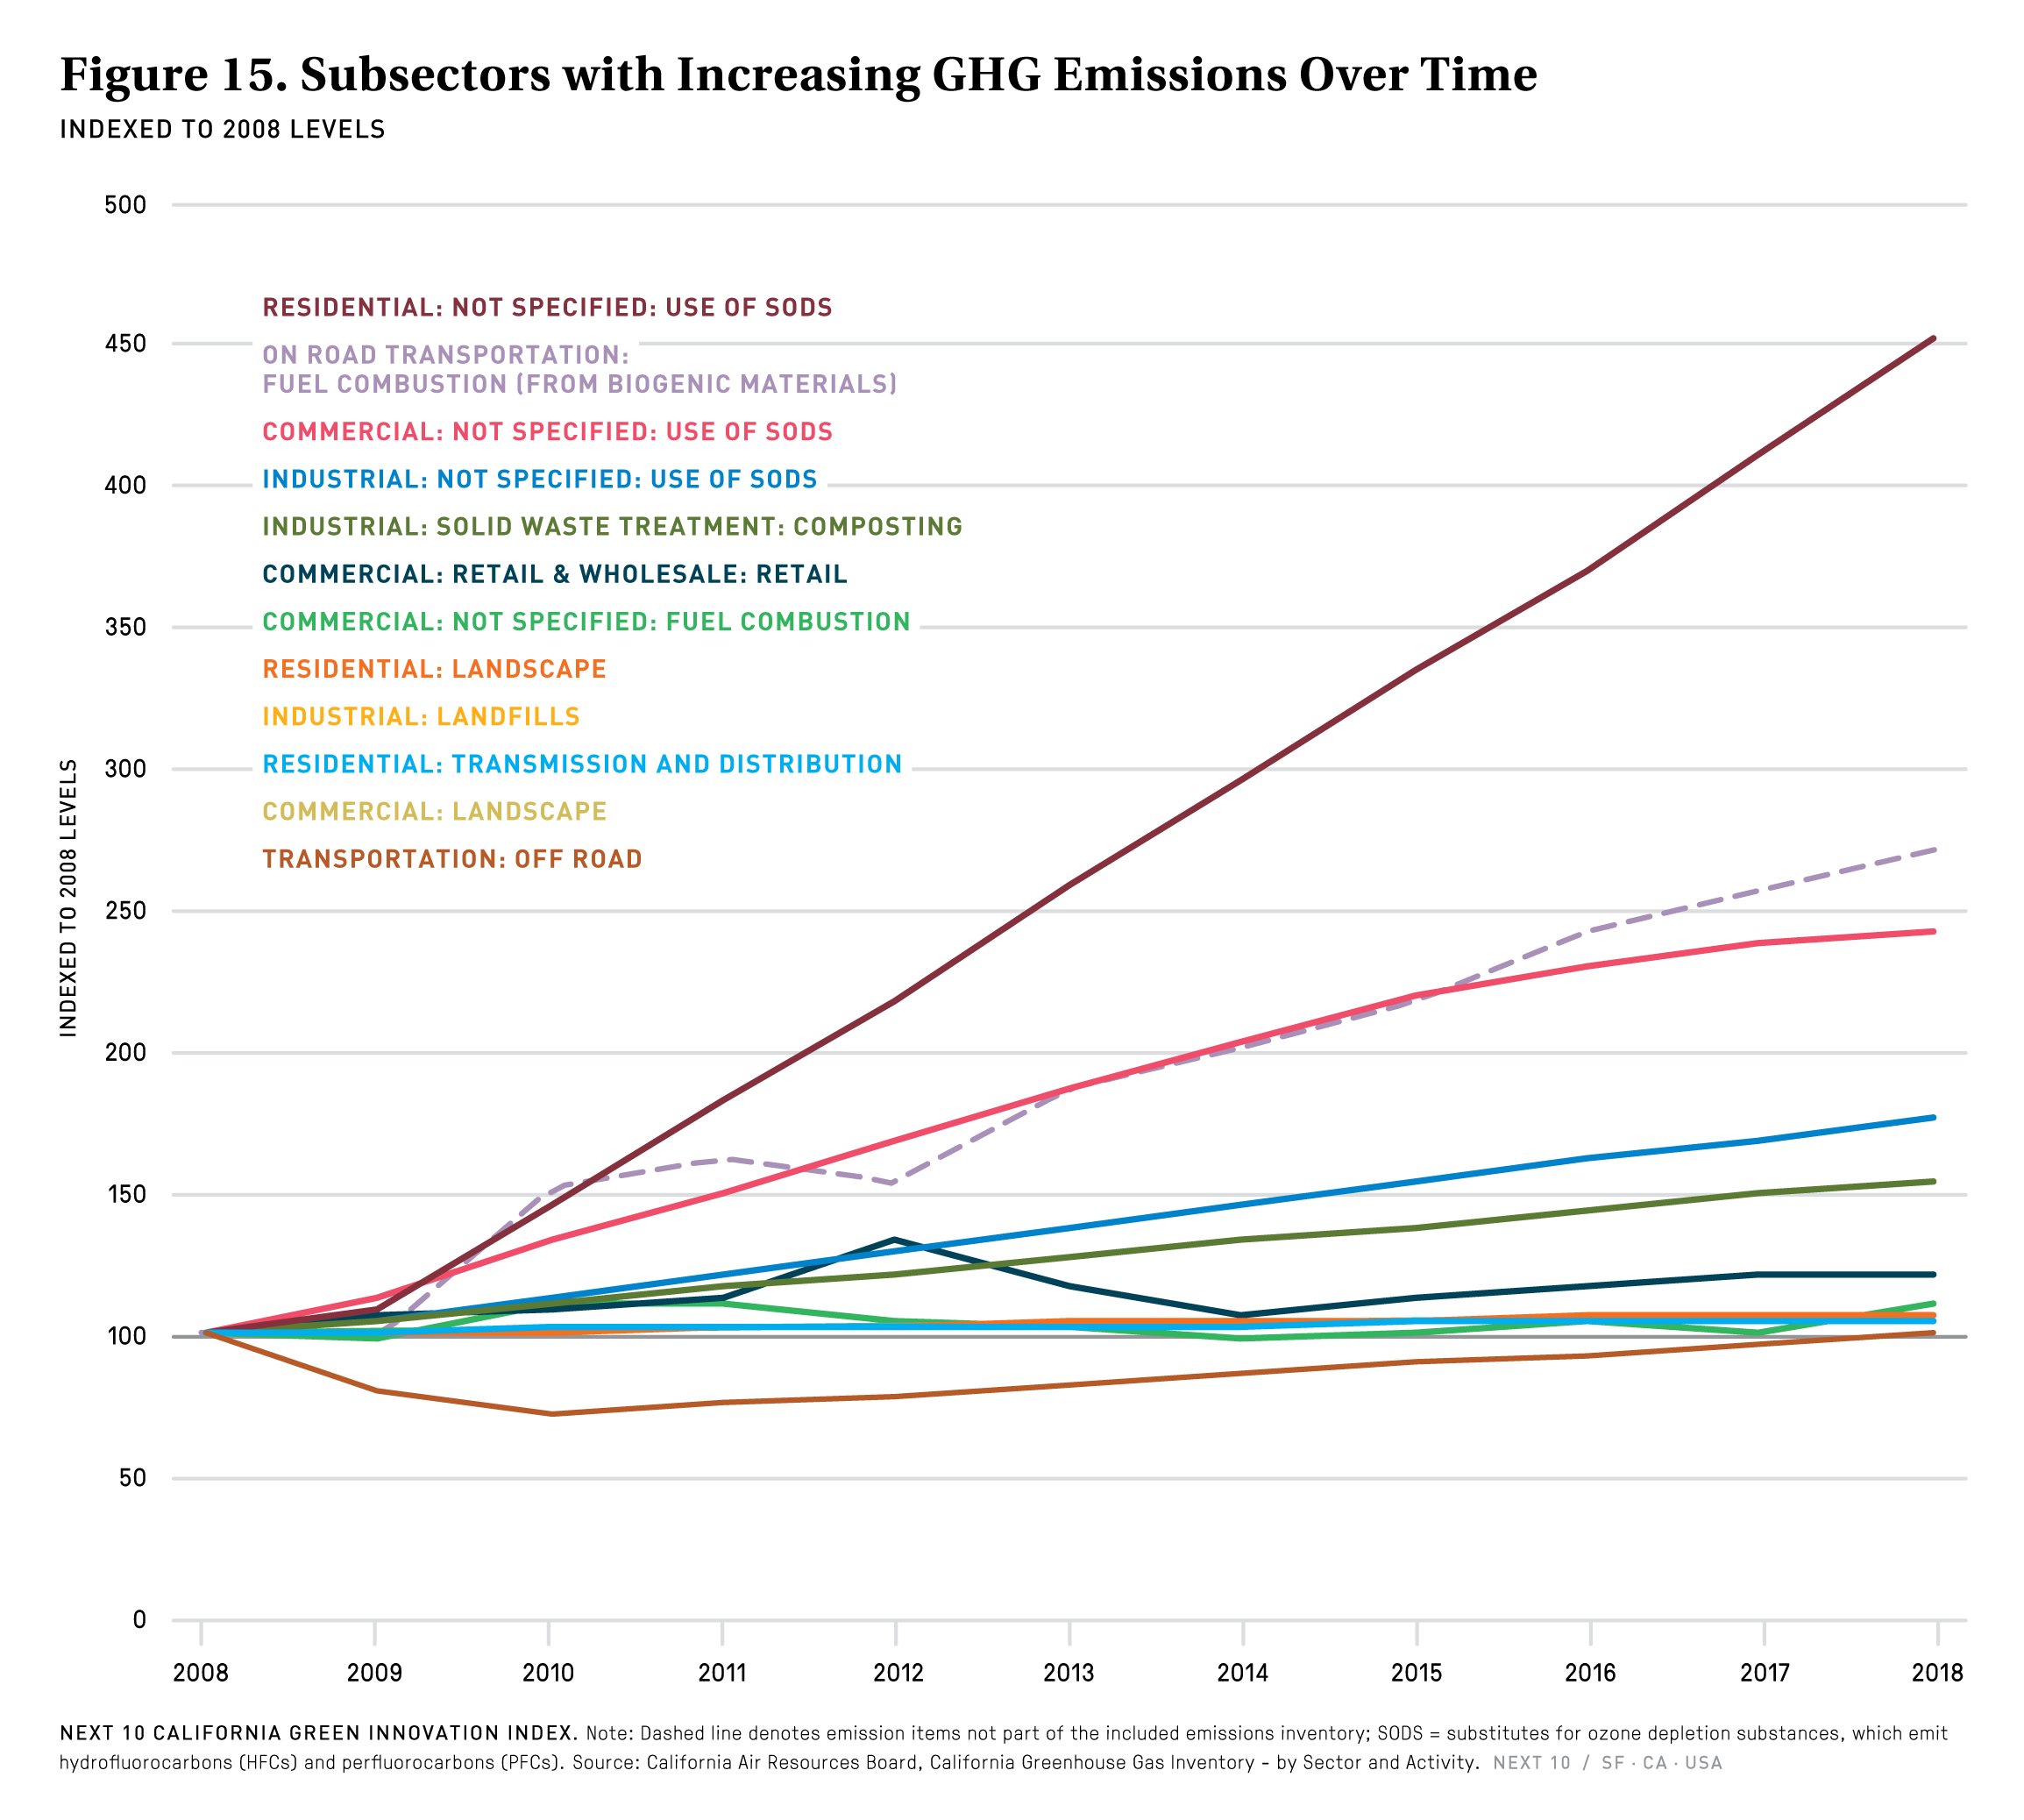
Compared to 2017, the commercial sector experienced the largest one-year emissions increase (+2.7%) of any sector, and emissions in this sector have shot up 69.3 percent since 2000, with no sign of slowing down. The continuous uptick is primarily due to adoption of carbon-intensive HVAC and refrigeration technologies that came to replace ozone-depleting substances (ODS) phased out decades ago via the Montreal Protocol. The electric power sectors (imports and in-state generation), which have reliably and significantly reduced emissions since 2008 (-47.4% from 2008 to 2018), actually increased slightly in 2018, driven by a decrease in electricity generated by large hydroelectric sources and an increase in generation from natural gas compared to 2017. Lastly, the transportation sector remains by far the largest emitting sector in California, but its share of emissions dropped from an all-time high of 41.3 percent in 2017 to 40.9 percent in 2018—driven by a large drop in heavy-duty vehicle pollution. All three subsectors of on-road heavy-duty vehicles had reductions in emissions: Heavy-duty Trucks (-4.0%), Buses (-4.6%), and Motorhomes (-3.6%), but emissions from off-road vehicles and light-duty vehicles remain a significant challenge.
While ensuring adequate annual emissions reductions to meet the SB 32 goal by 2030 poses a challenge for the state, the report also finds that green stimulus for pandemic recovery could be California's best bet to gain ground. The report assessed the employment, labor income, and economic outputs expected from several green stimulus projects and finds that the state would greatly benefit from long-term funding for programs that produce local emissions reductions while spurring jobs and economic growth, rather than relying solely on cap-and-trade revenue for these projects, given budget shortfalls of 2020. Private sector investment can also drive green stimulus, and California captured 51 percent of the U.S.’ total $6 billion in clean tech venture capital investment in 2019, as large gains were made at companies that focus on geothermal, smart grid, and hydroelectric technologies.
Next 10 owns the rights to this publication. Any usage of content from this publication is subject to our Terms of Use.


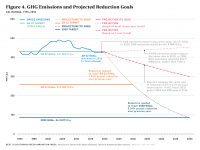
- Total emissions rose 0.83 million metric tons of carbon dioxide-equivalent (MMTCO2e) to 425.3 MMTCO2e (+0.2%) in 2018 compared to 2017. This level is still below the state’s first climate milestone (2020’s AB 32 goal, met four years early in 2016) of reducing to 431 MMTCO2e below 1990 levels.
- While the transportation sector saw a reduction in emissions from 2017 to 2018 (-0.9%), emissions rose in all other economic sectors in 2018: Agriculture & Forestry (+0.8%), Commercial (+2.1%), Electricity Power (+1.5%), Industrial (+0.7%), and Residential (+0.3%).
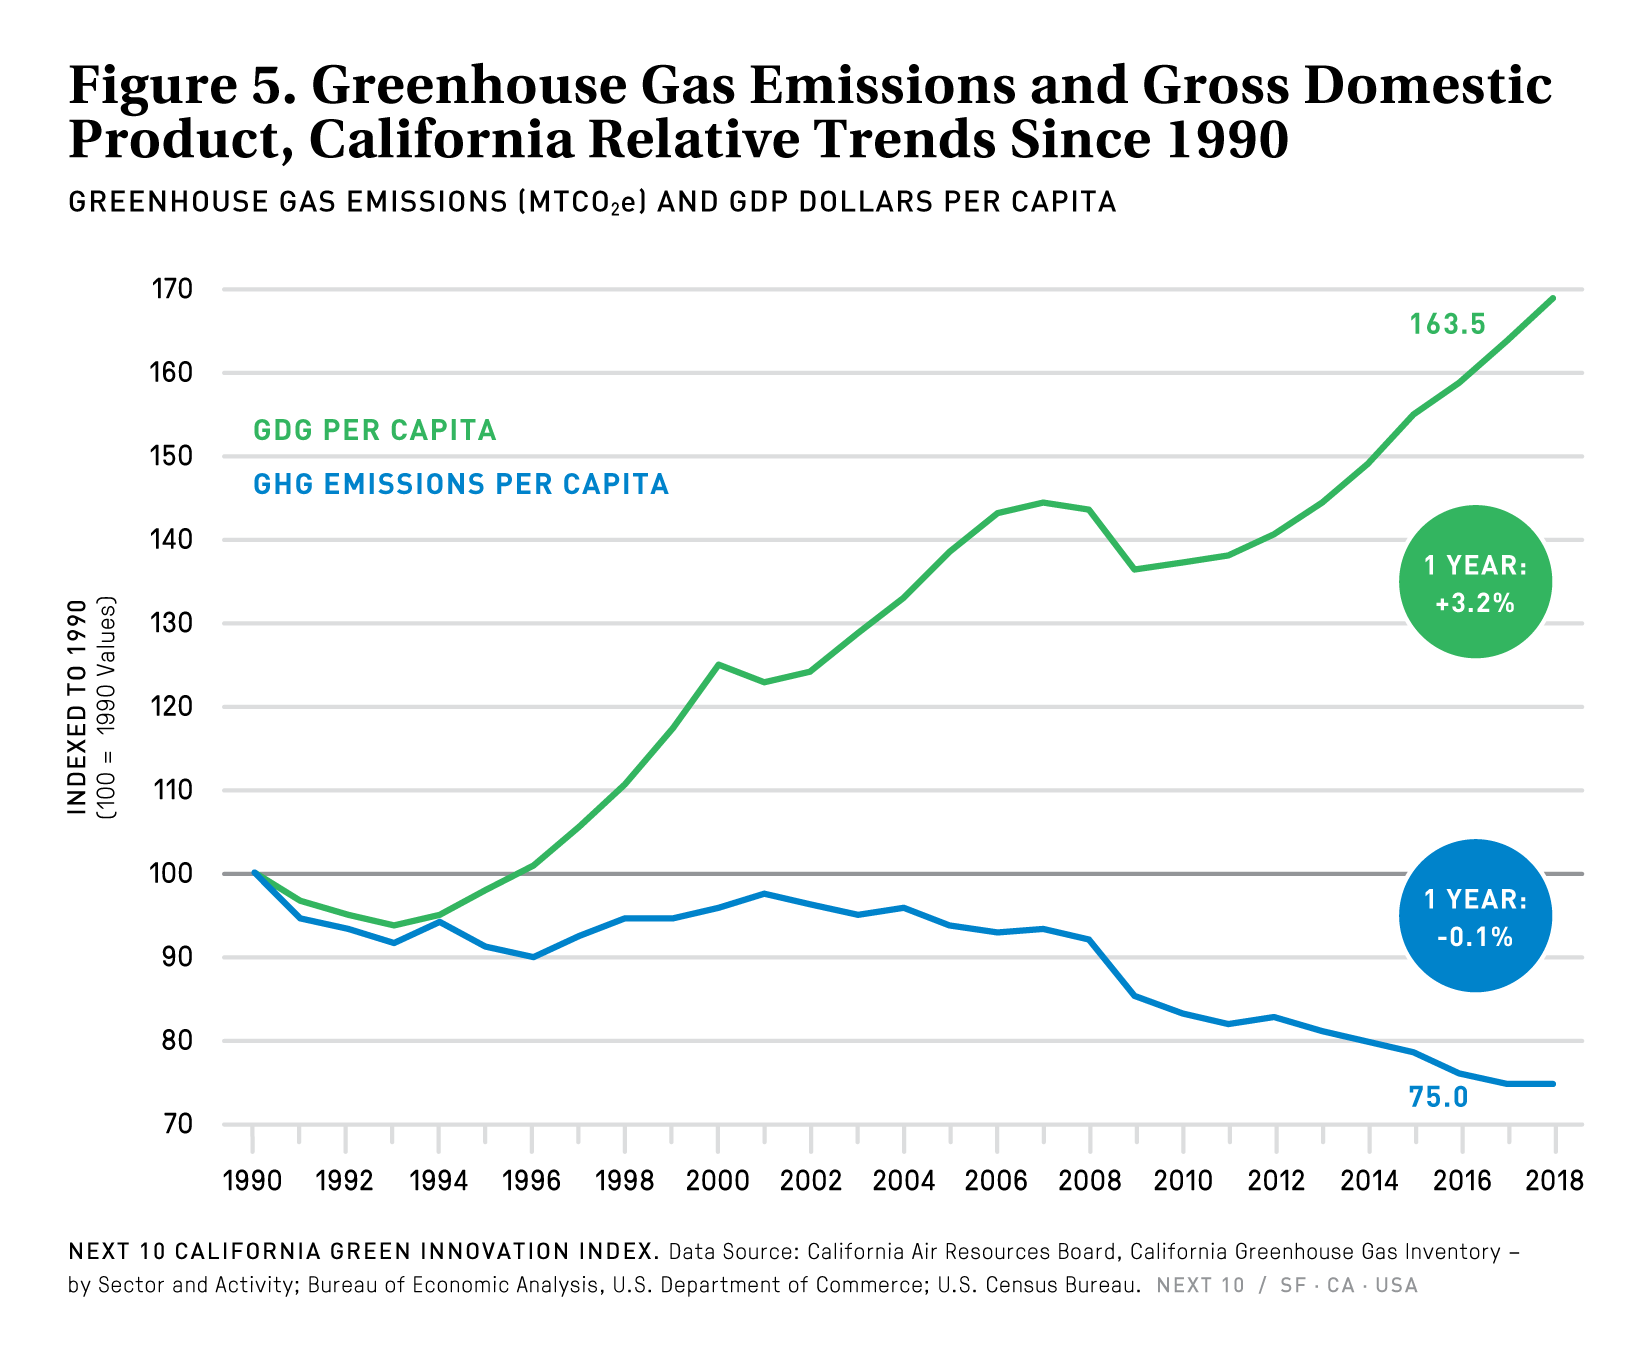
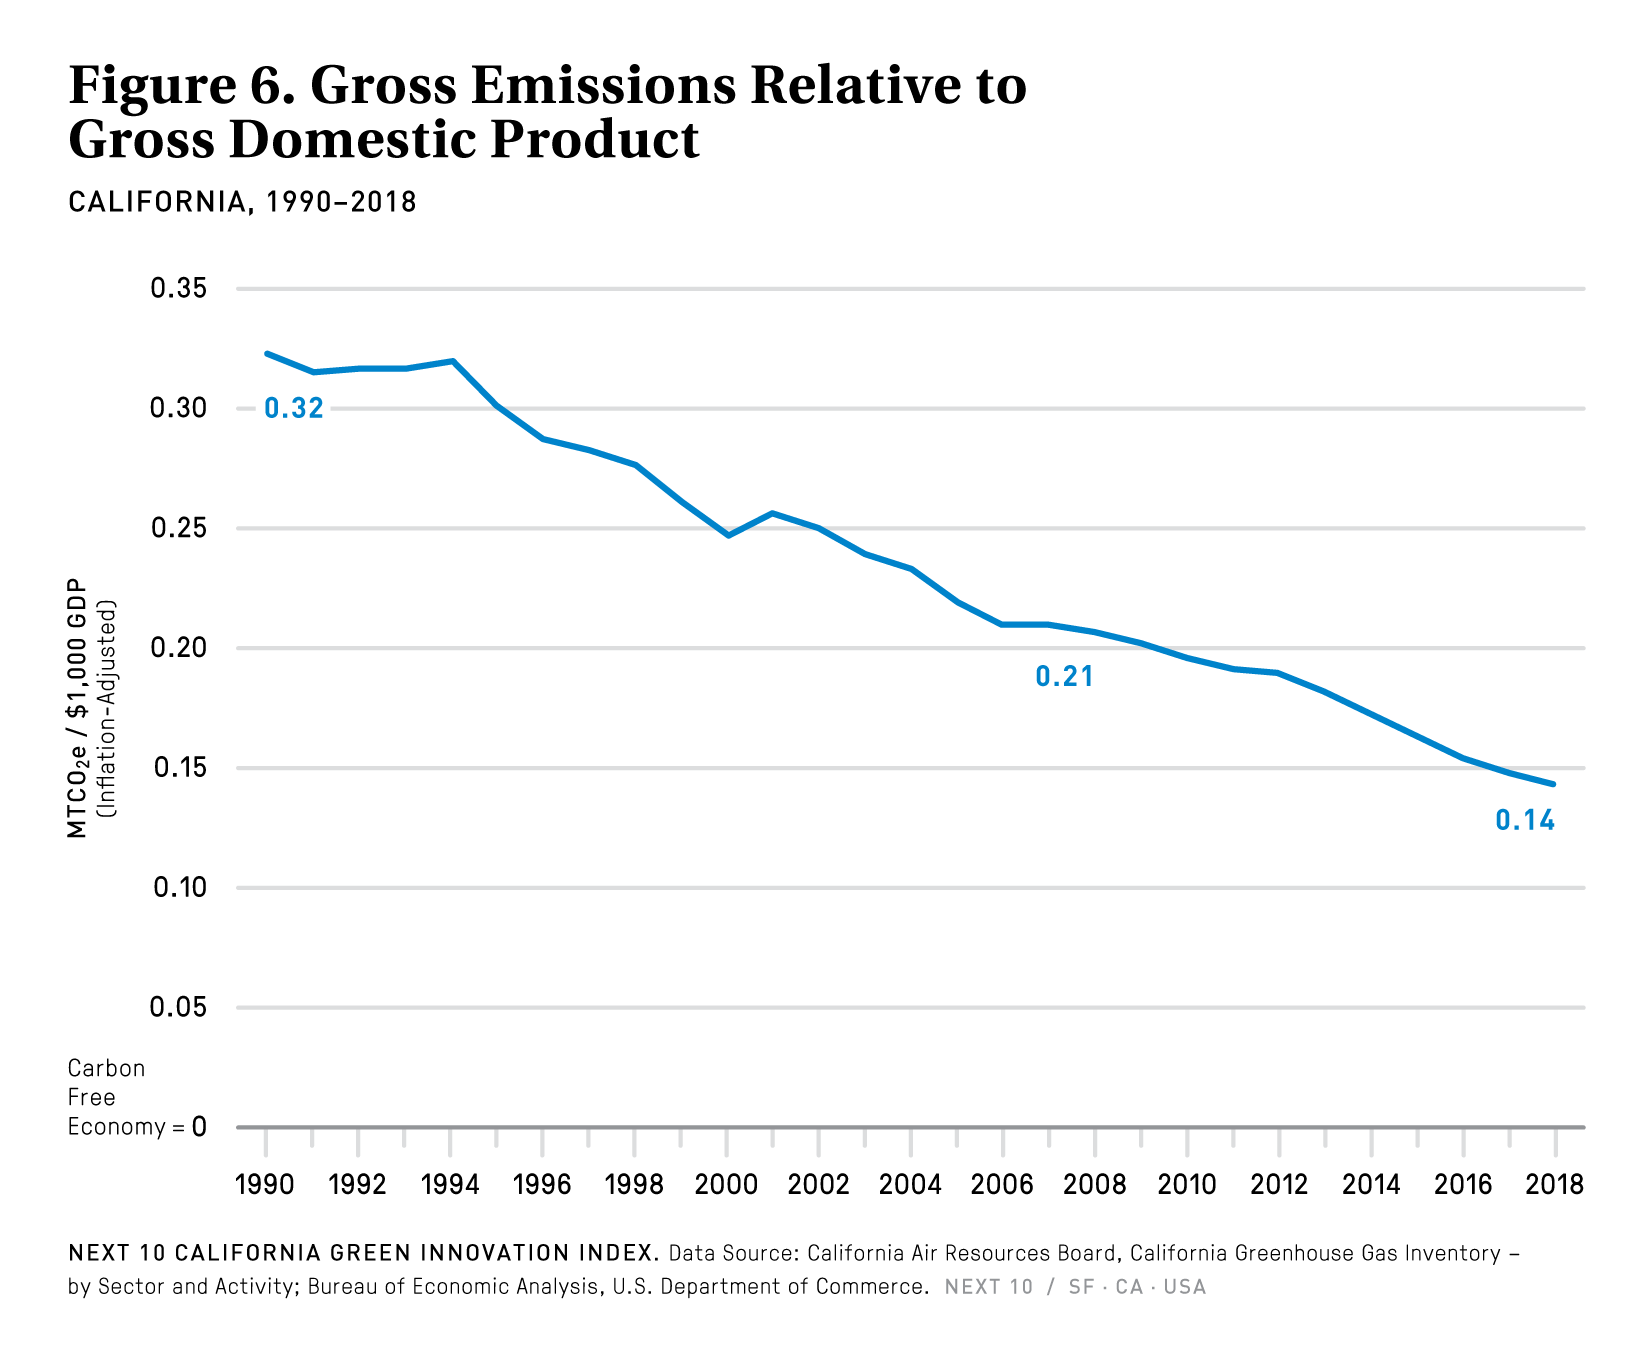
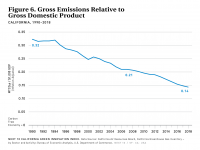
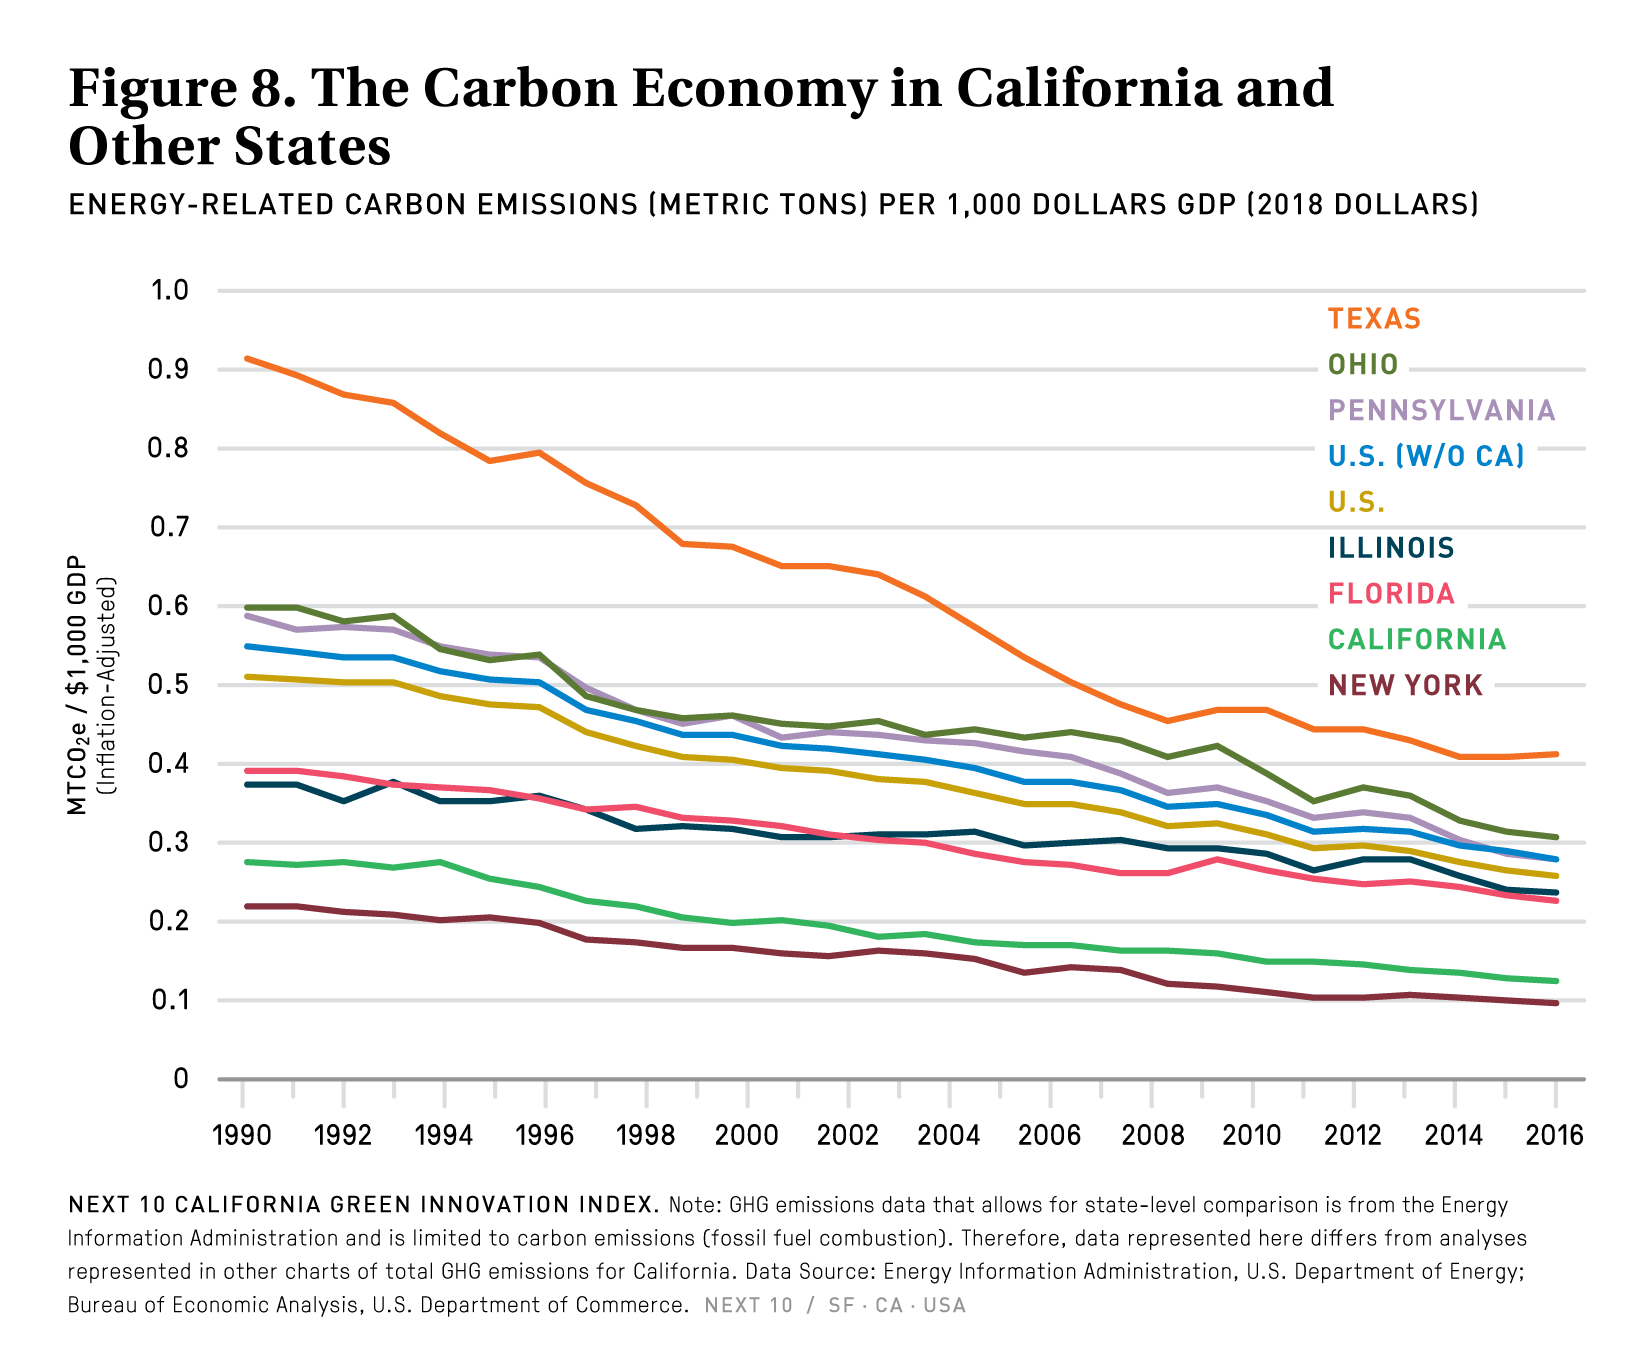
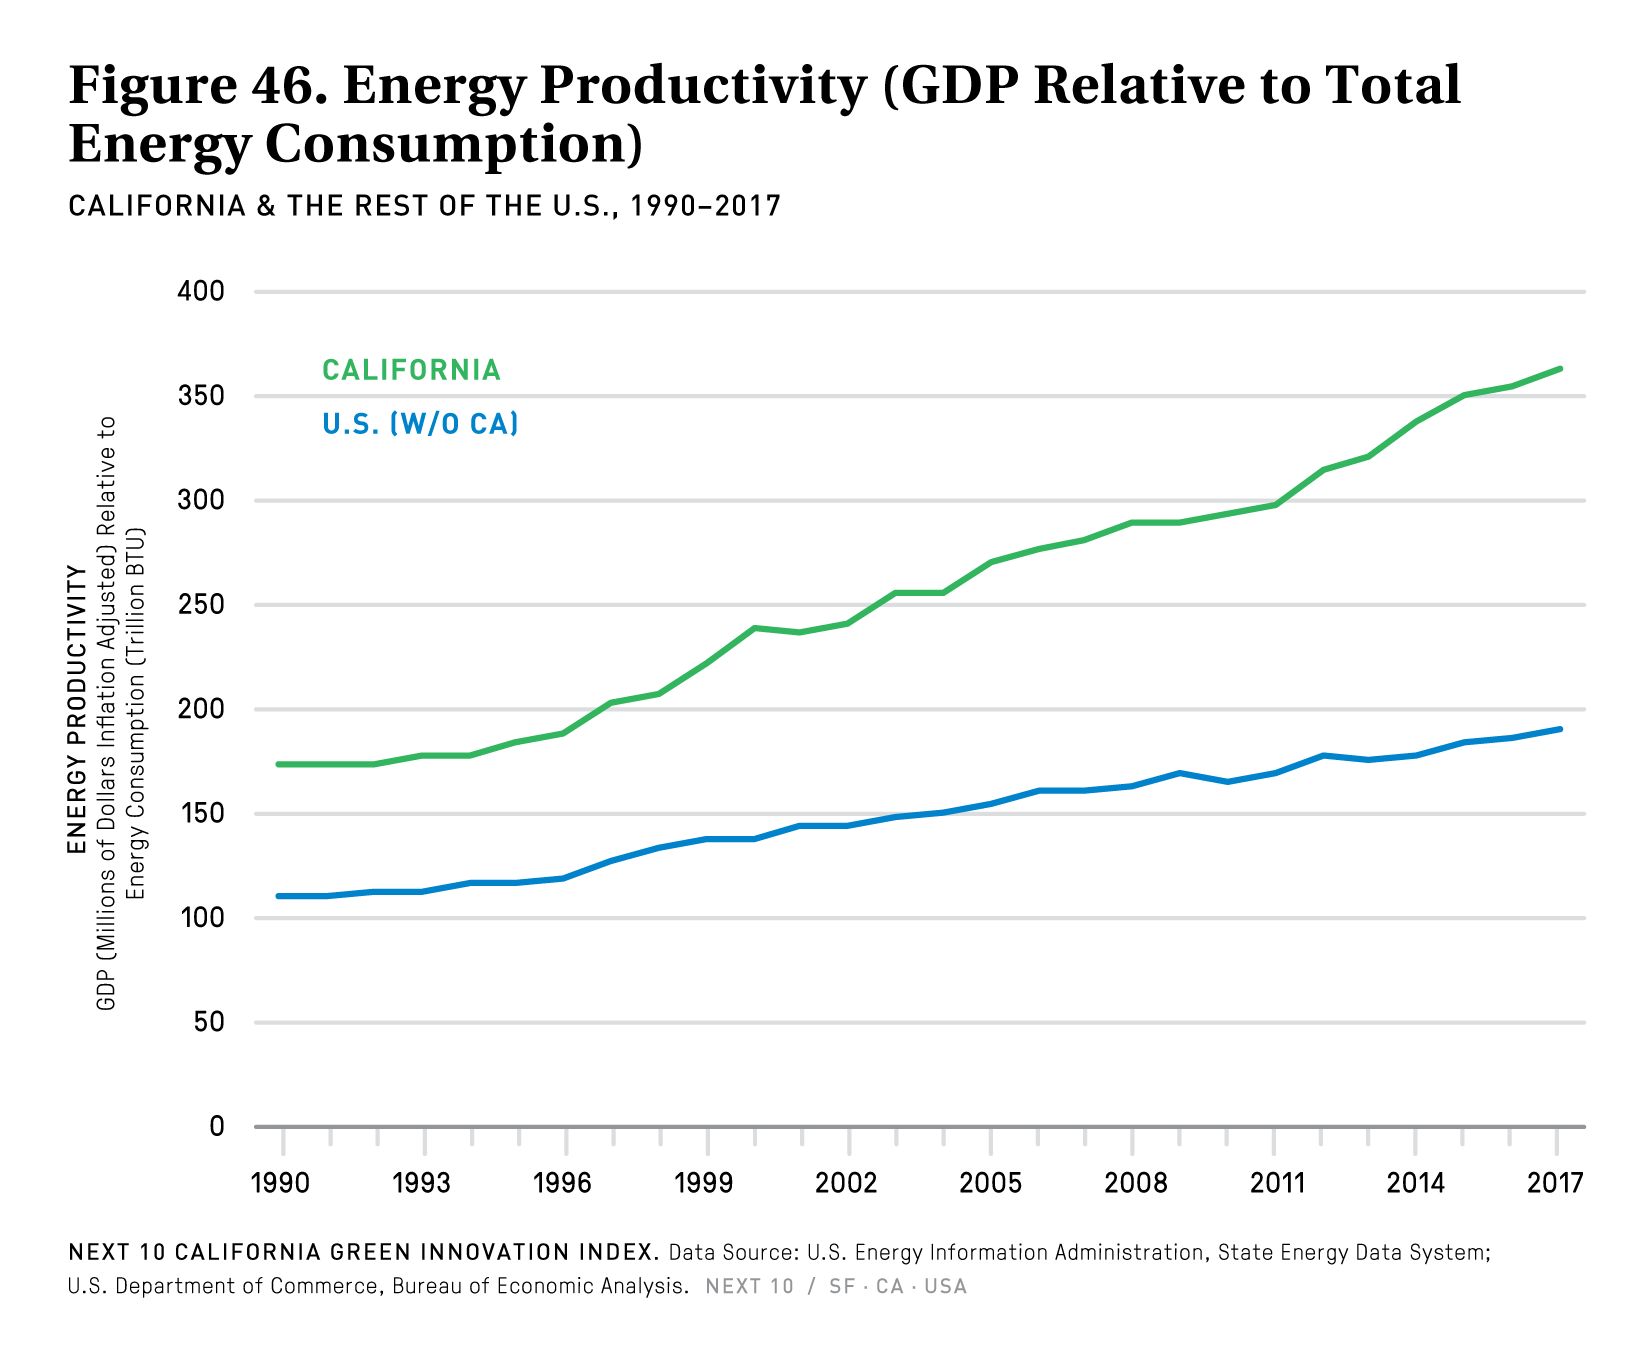
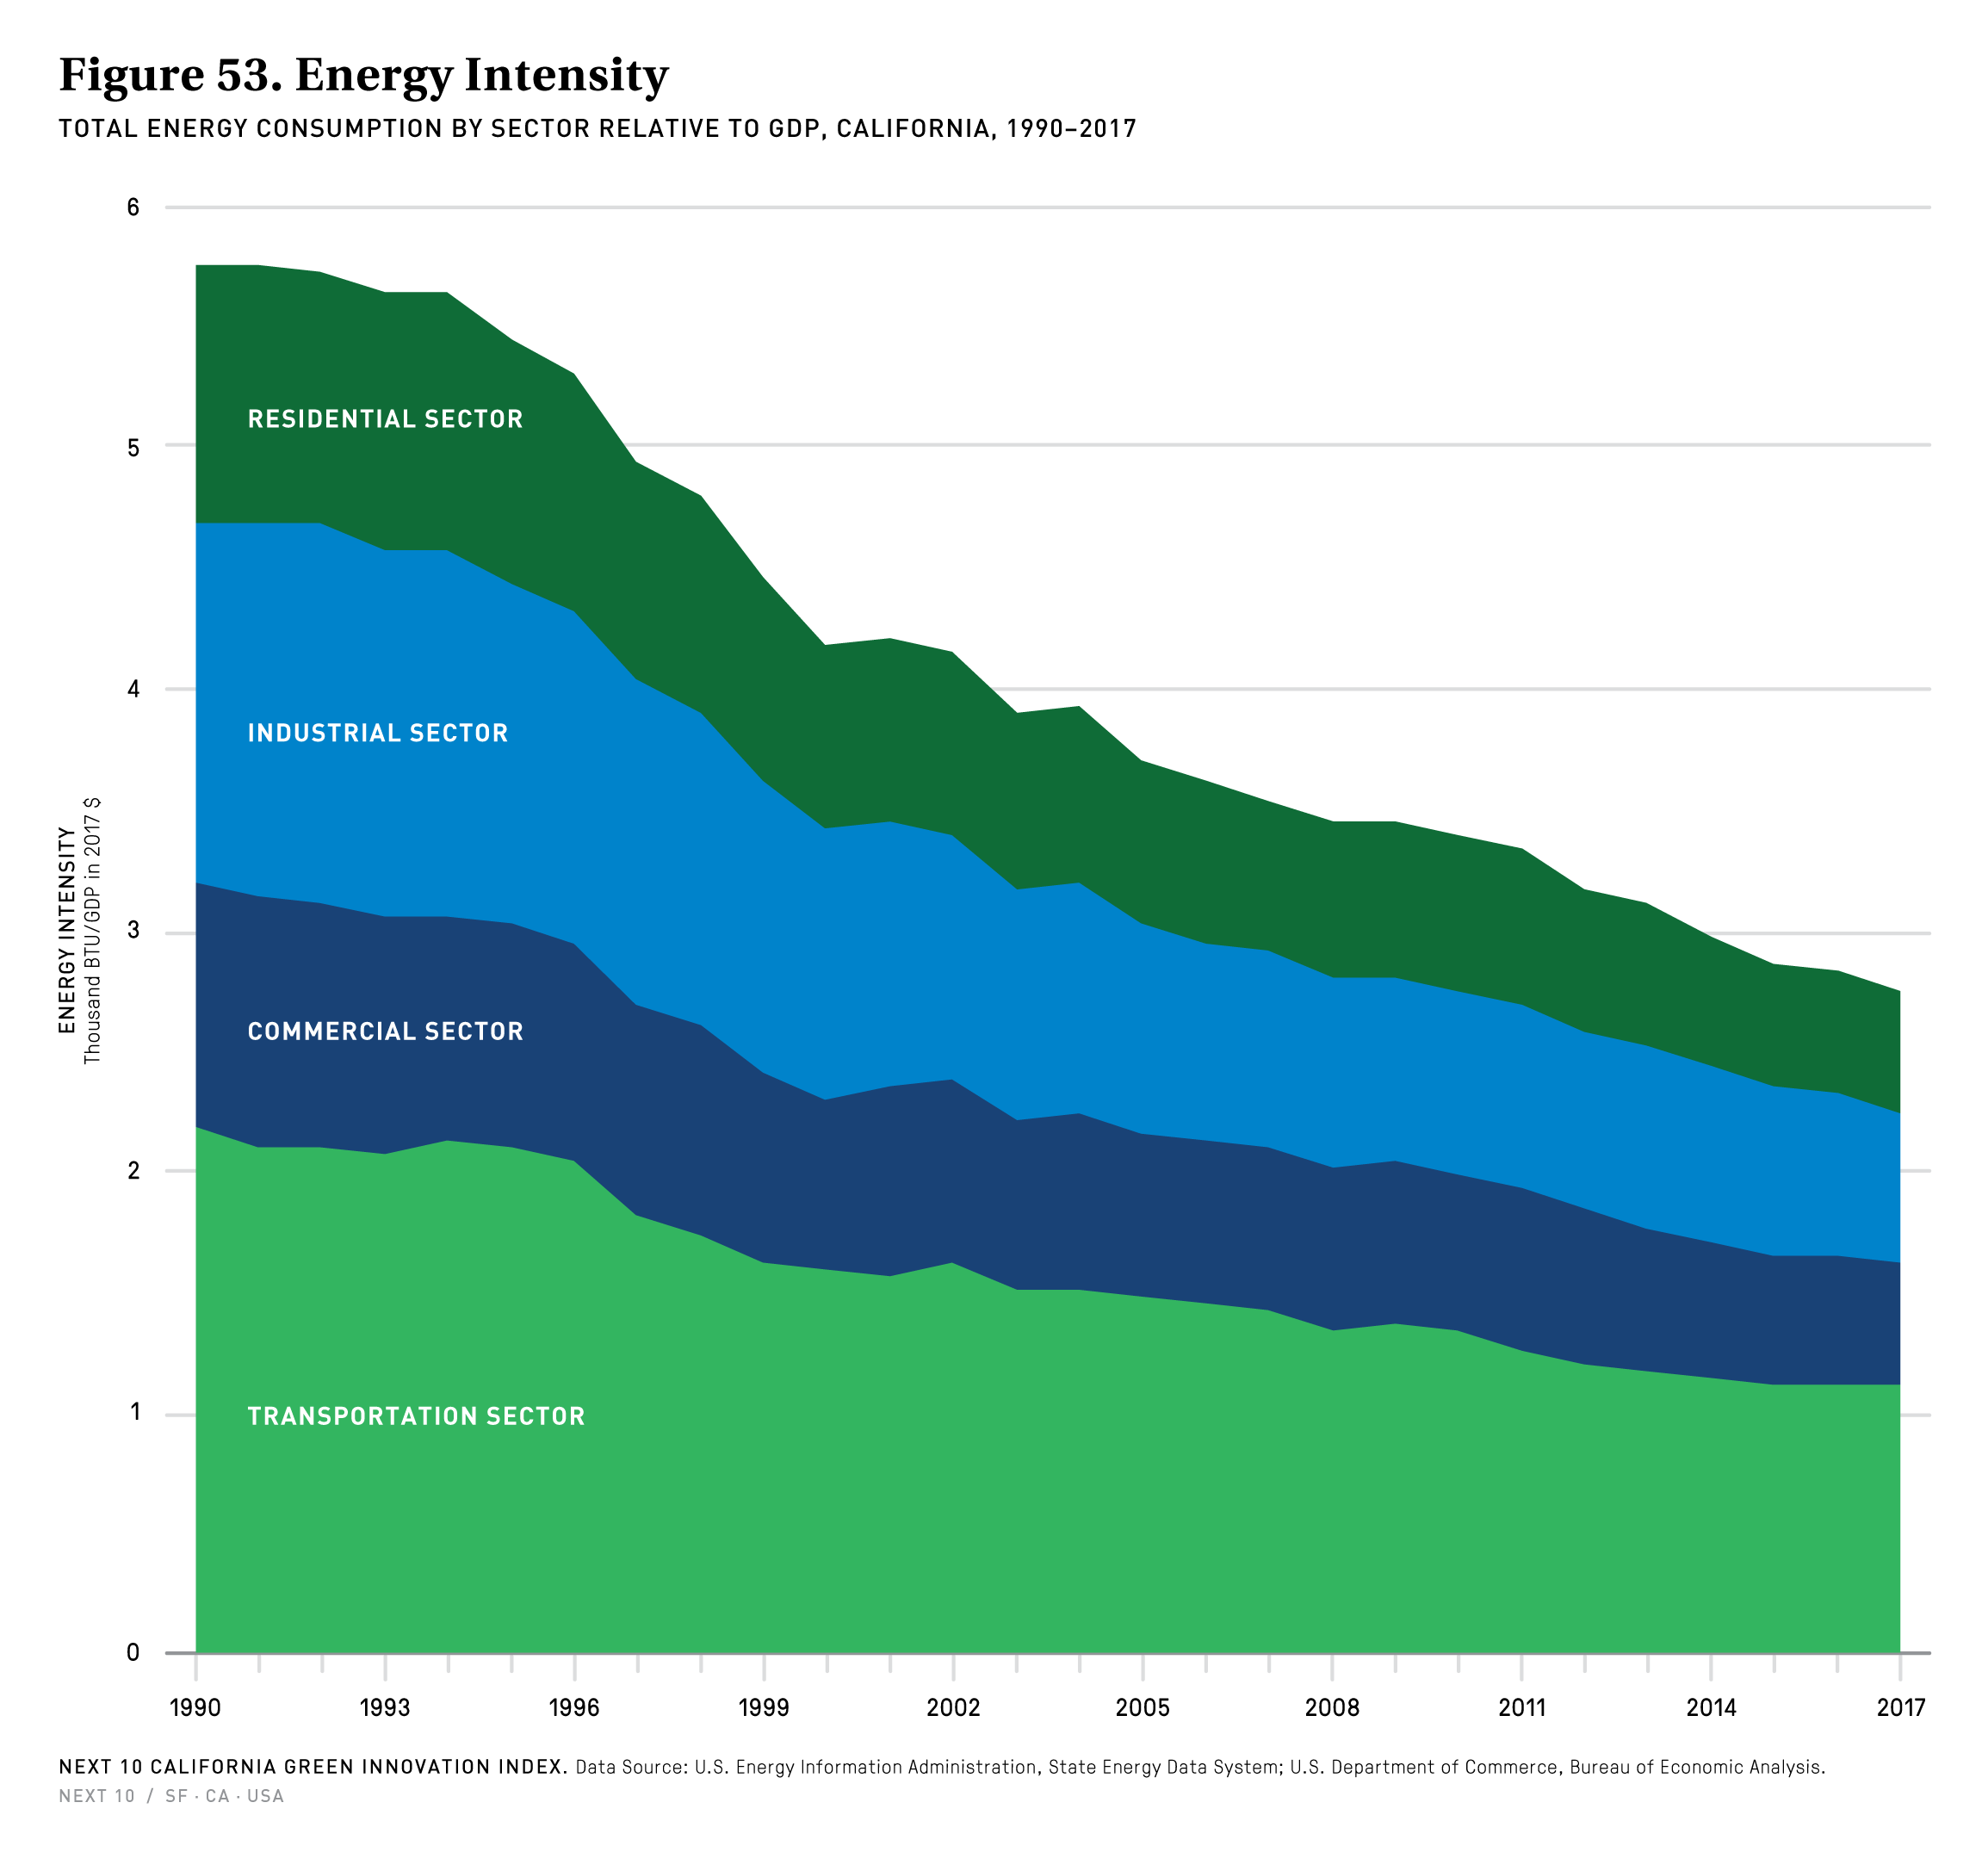
- Despite the slight increase in emissions of 0.2 percent, the state has managed to continue to reduce its carbon intensity—emissions relative to GDP—by 3.2 percent from 2017 to 2018 thanks to a strong growth in real GDP.
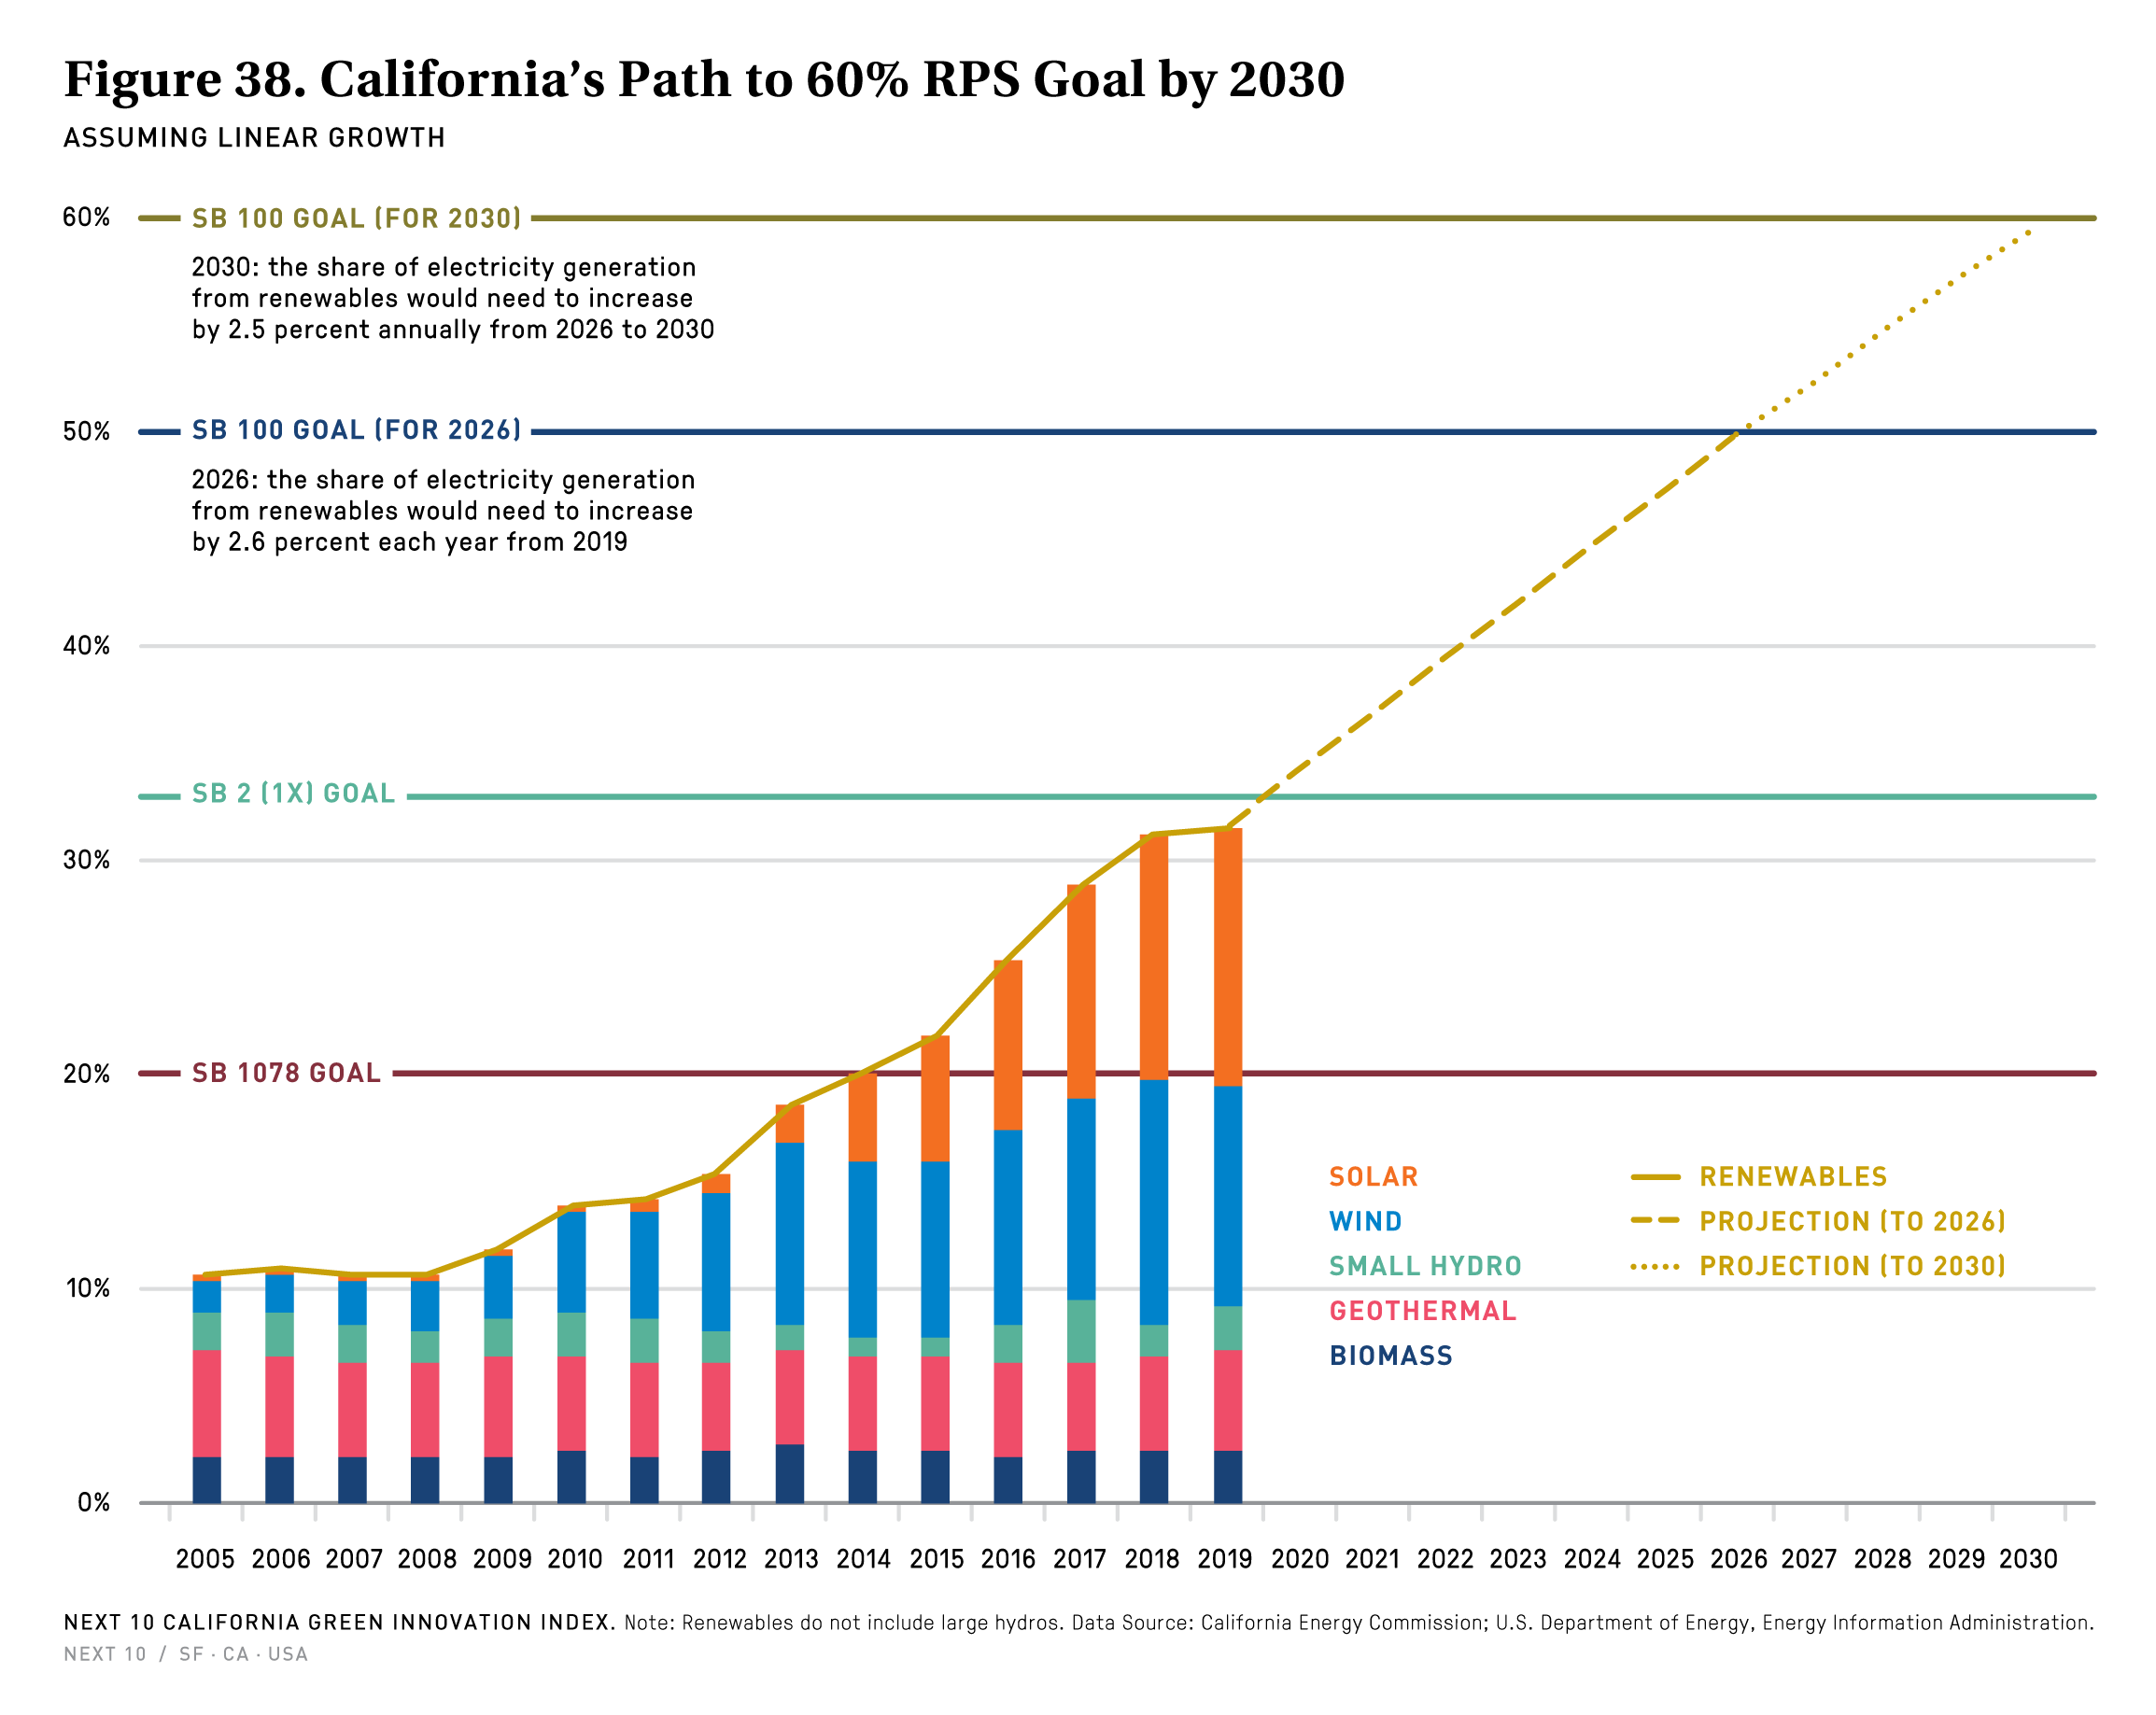
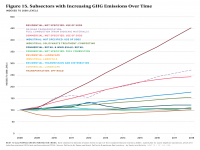
- At the current trajectory, the state will take significantly more time to reach the 2030 and 2050 emissions goals than it did to reach the 2020 goal. Assuming the same three-year average rate of reduction from 2015 to 2018 (-1.18%), California needs to quadruple the rate of reduction to achieve the 2030 goal and ramp up that rate of reduction even more to achieve the 2050 goal.
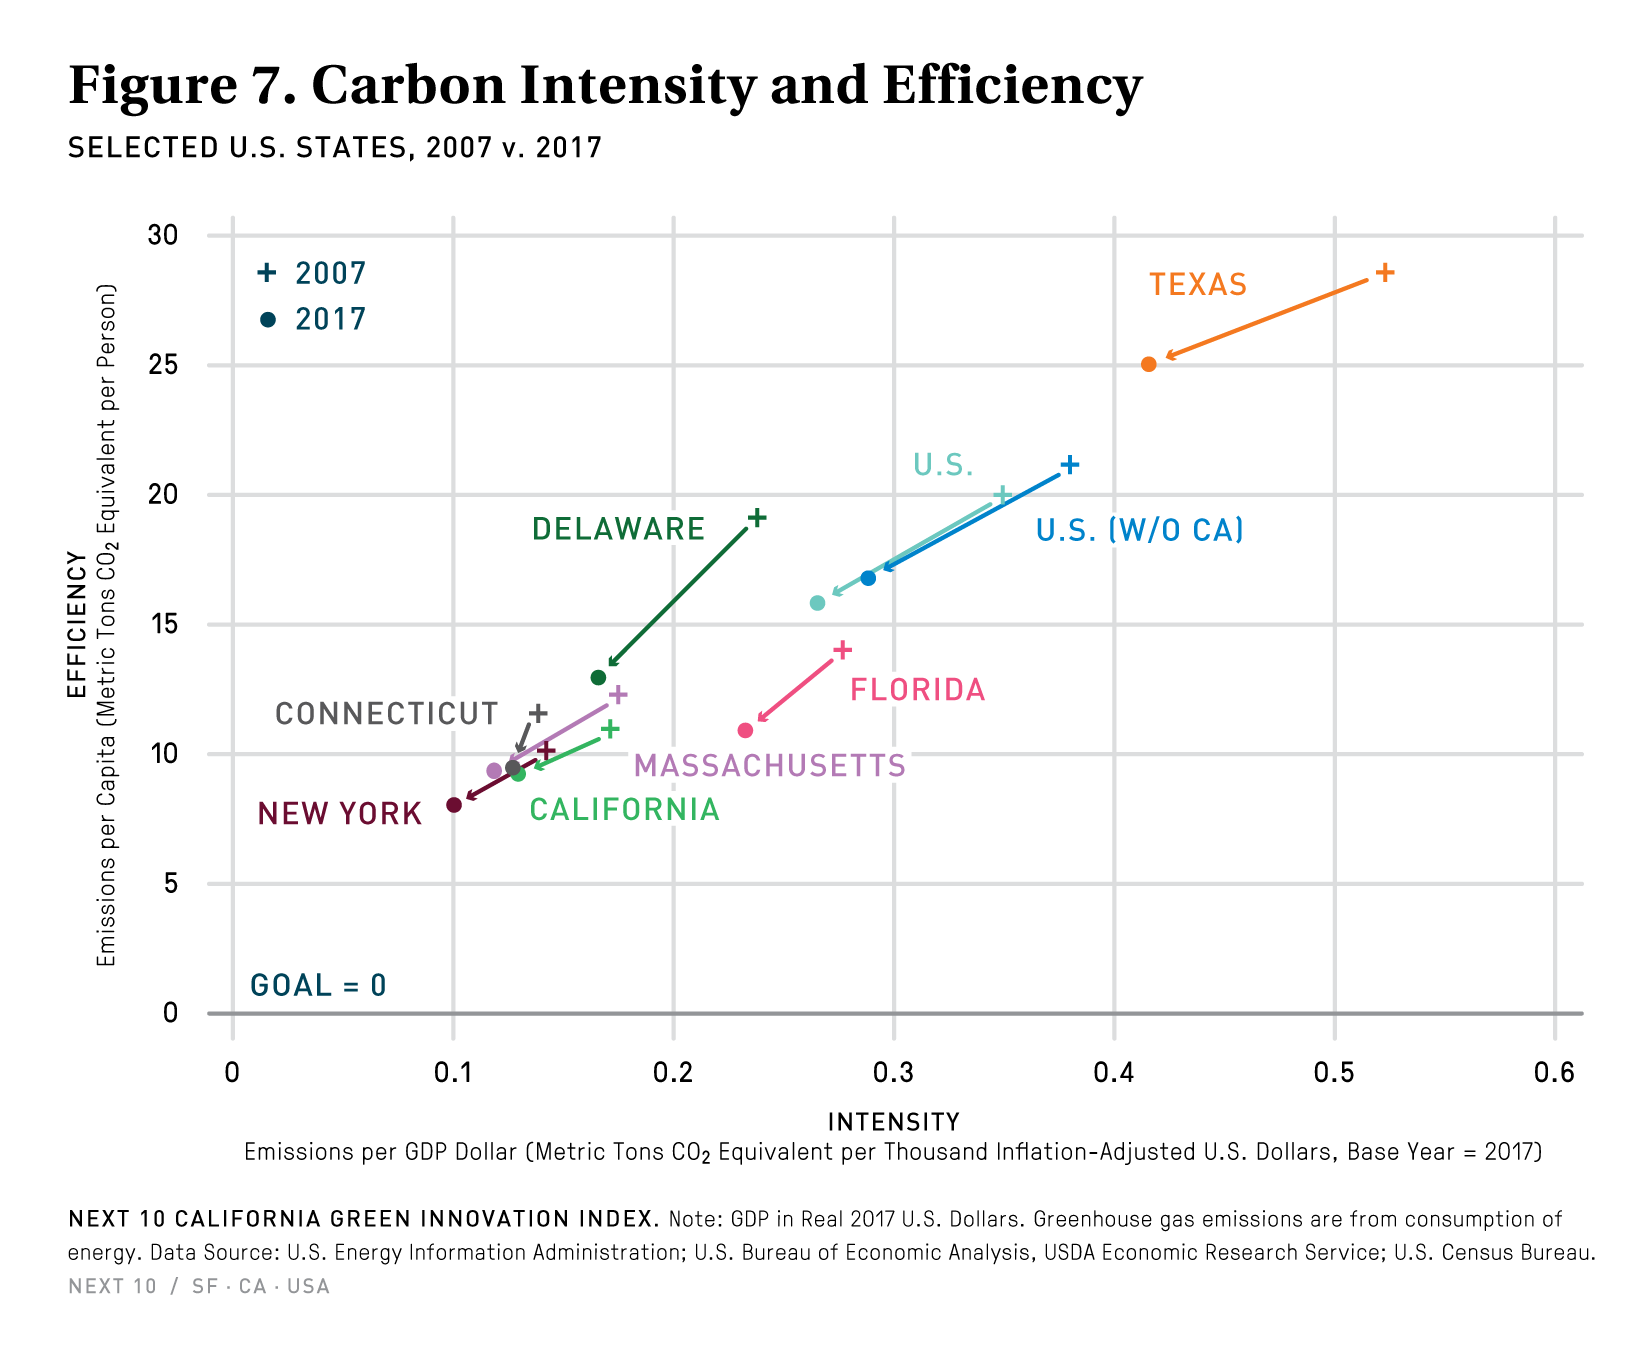
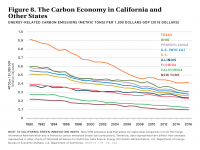
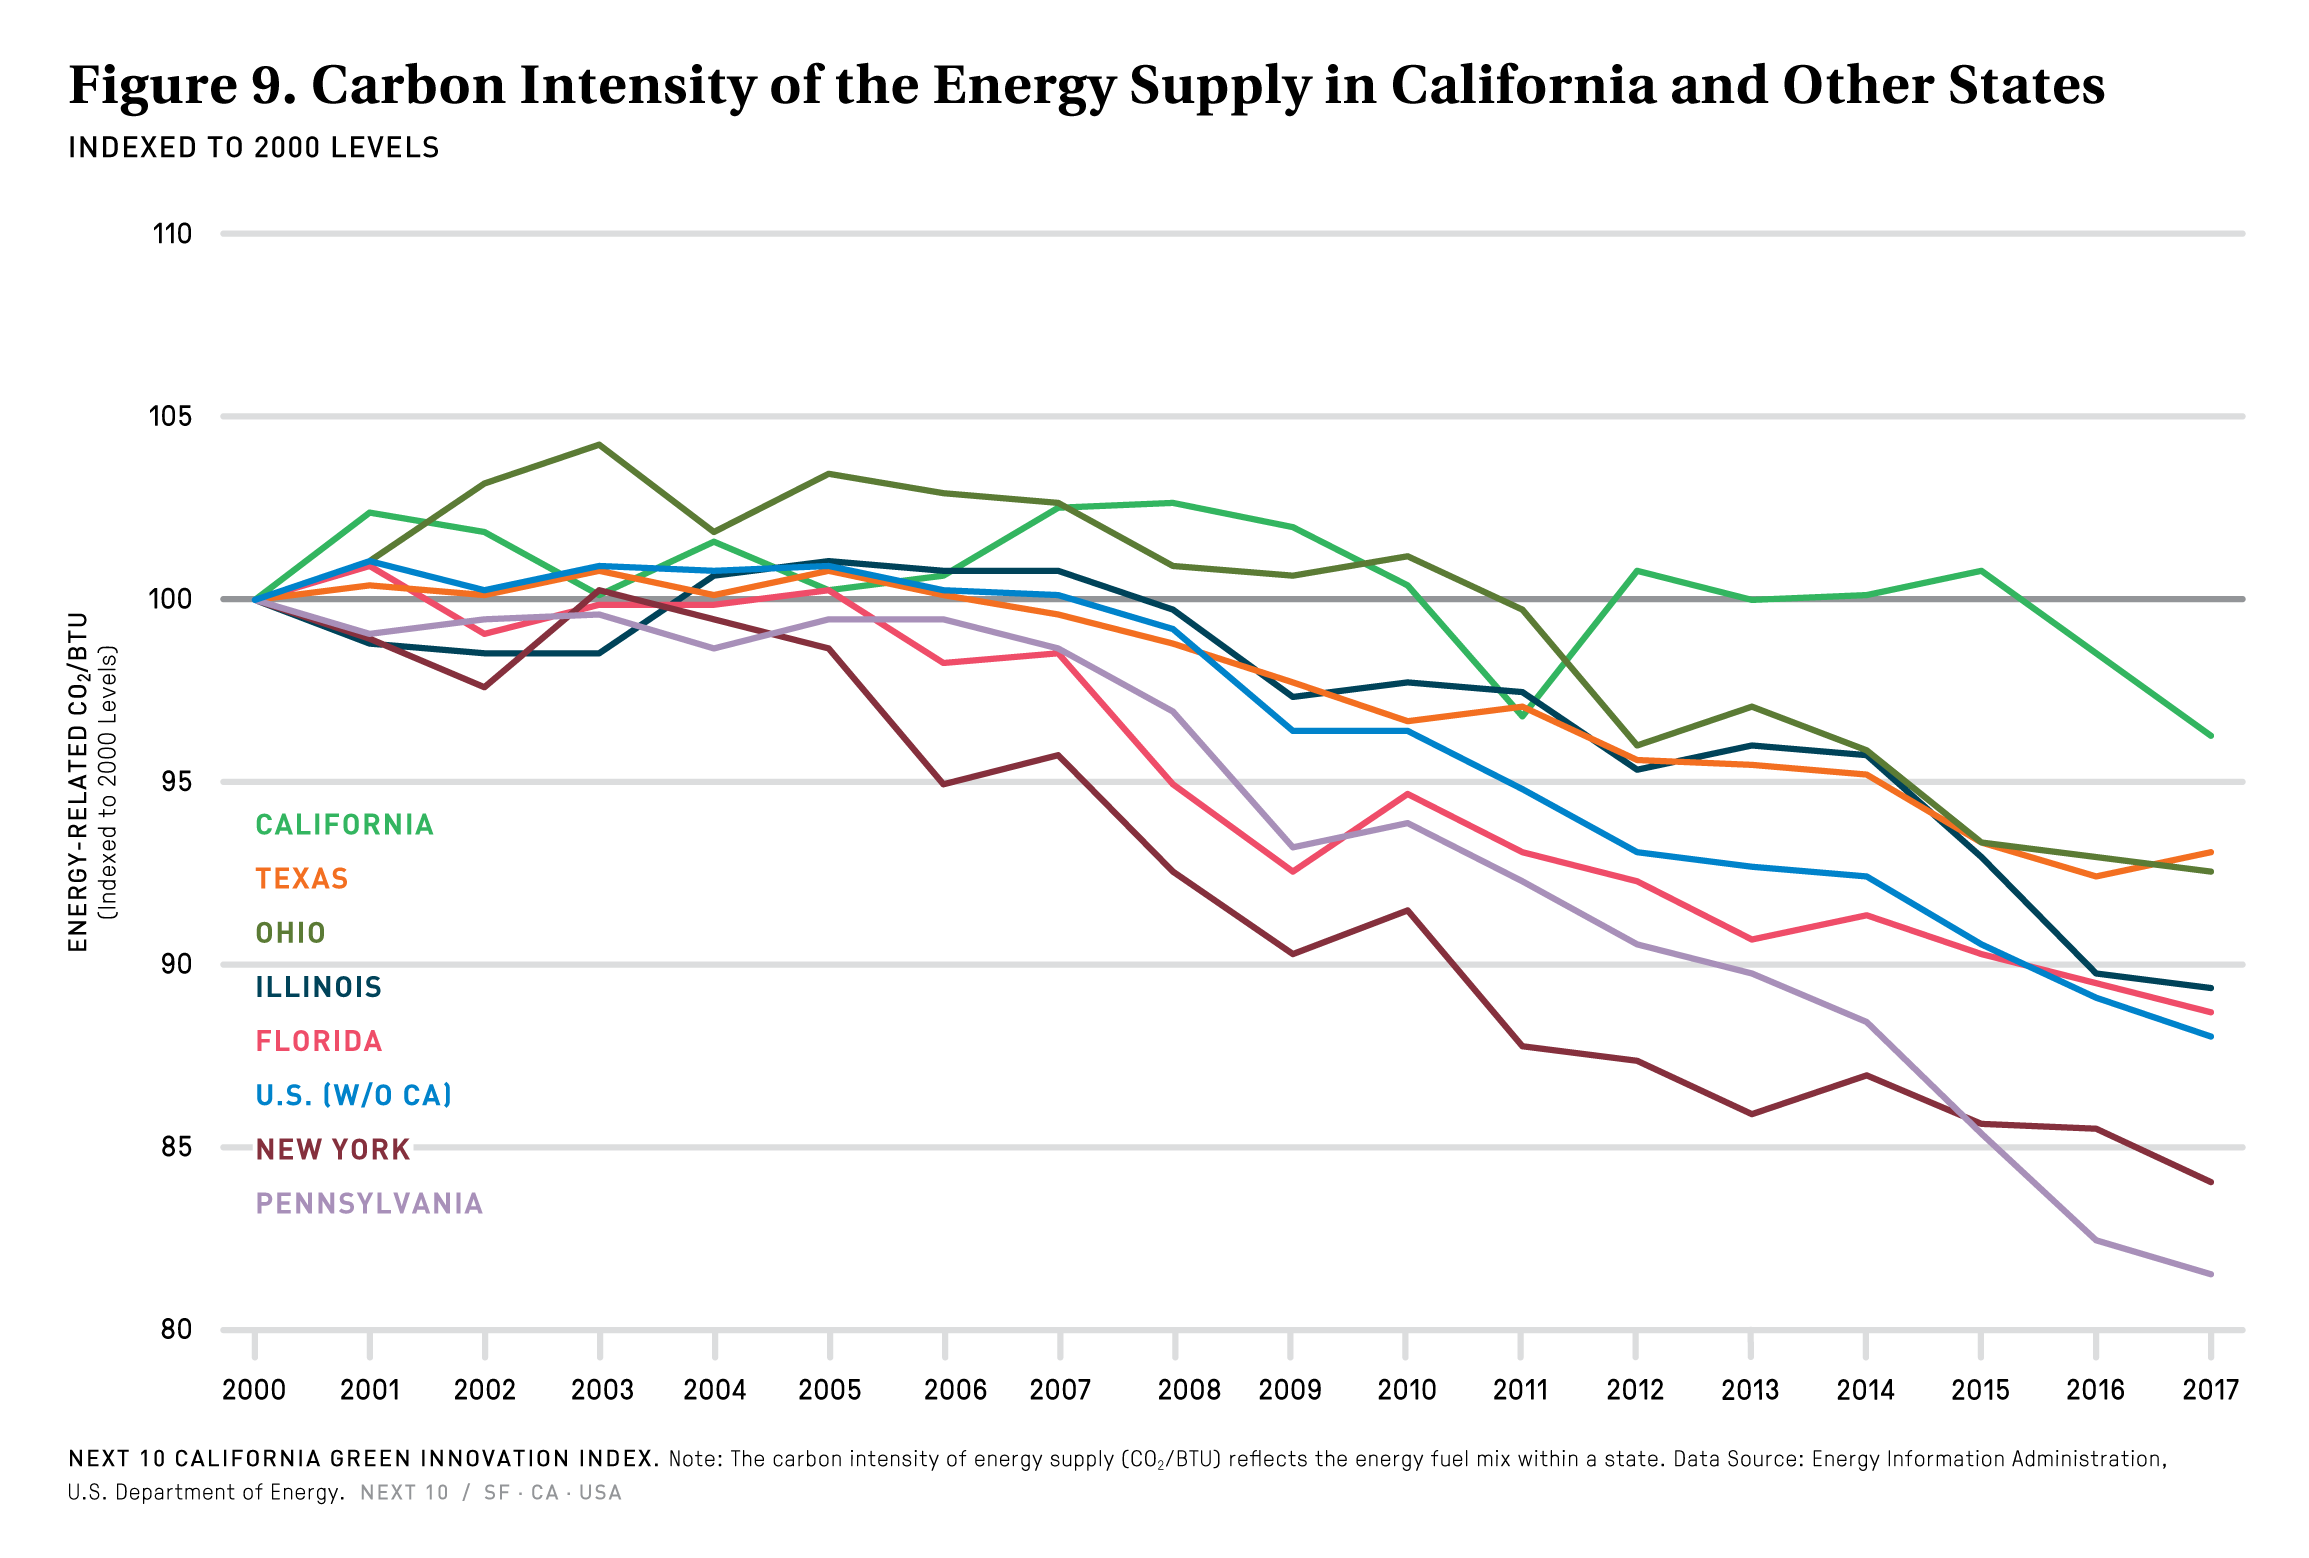
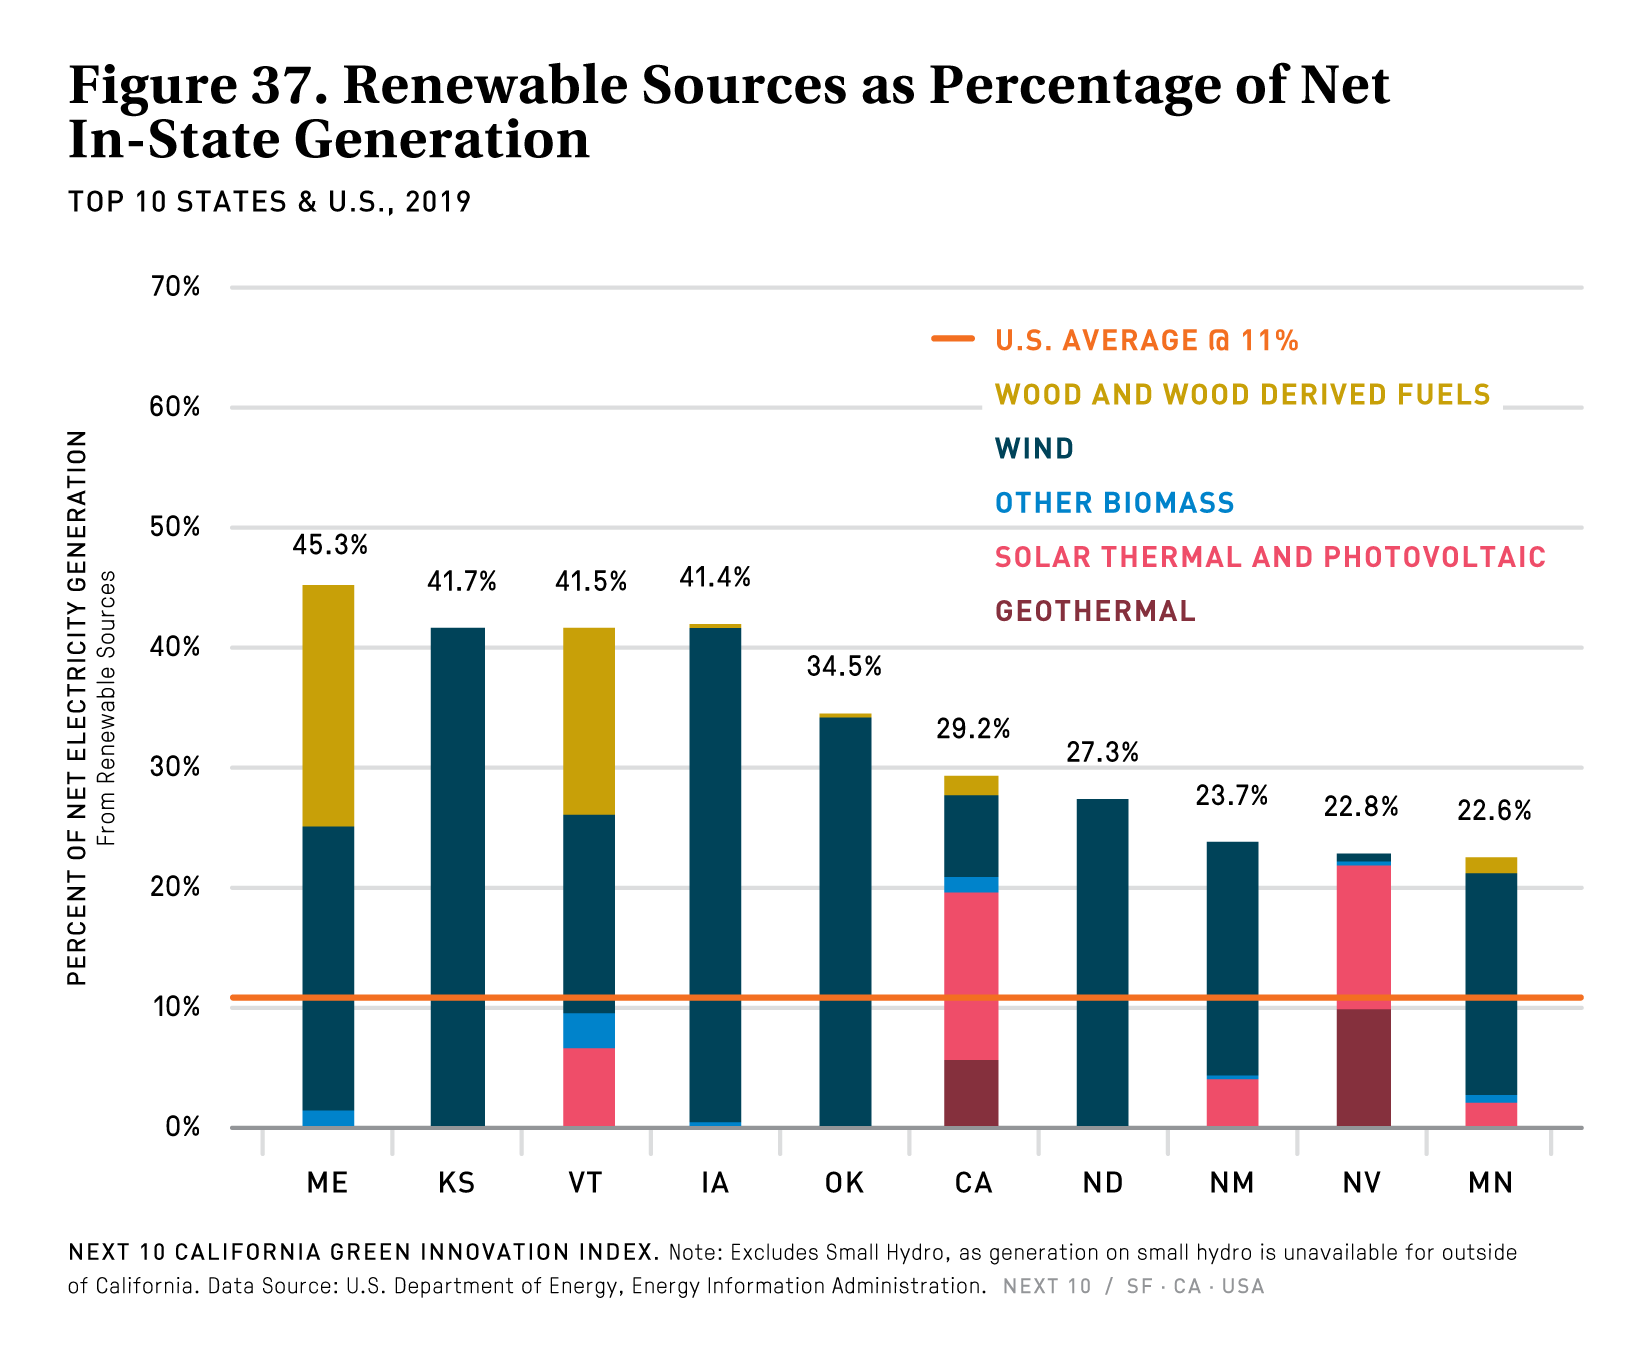
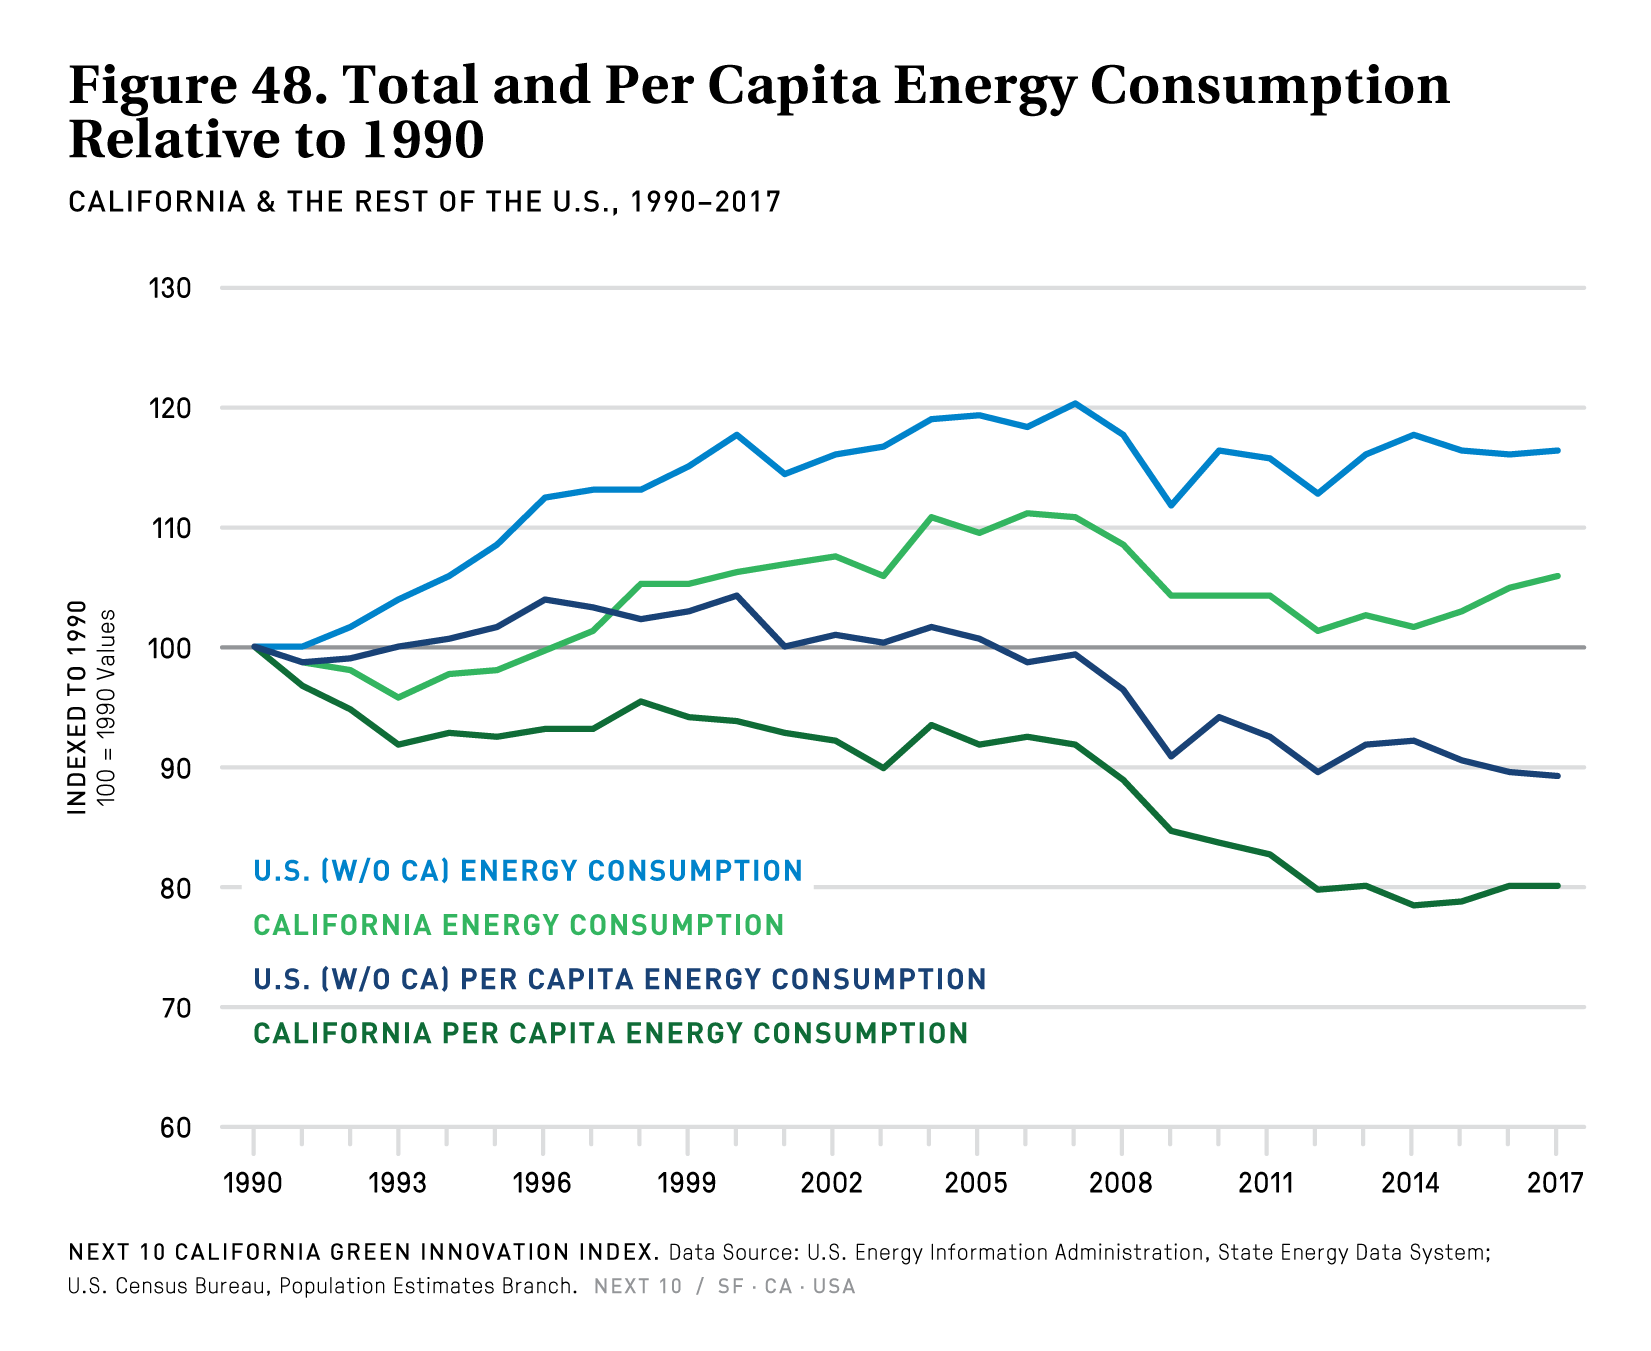
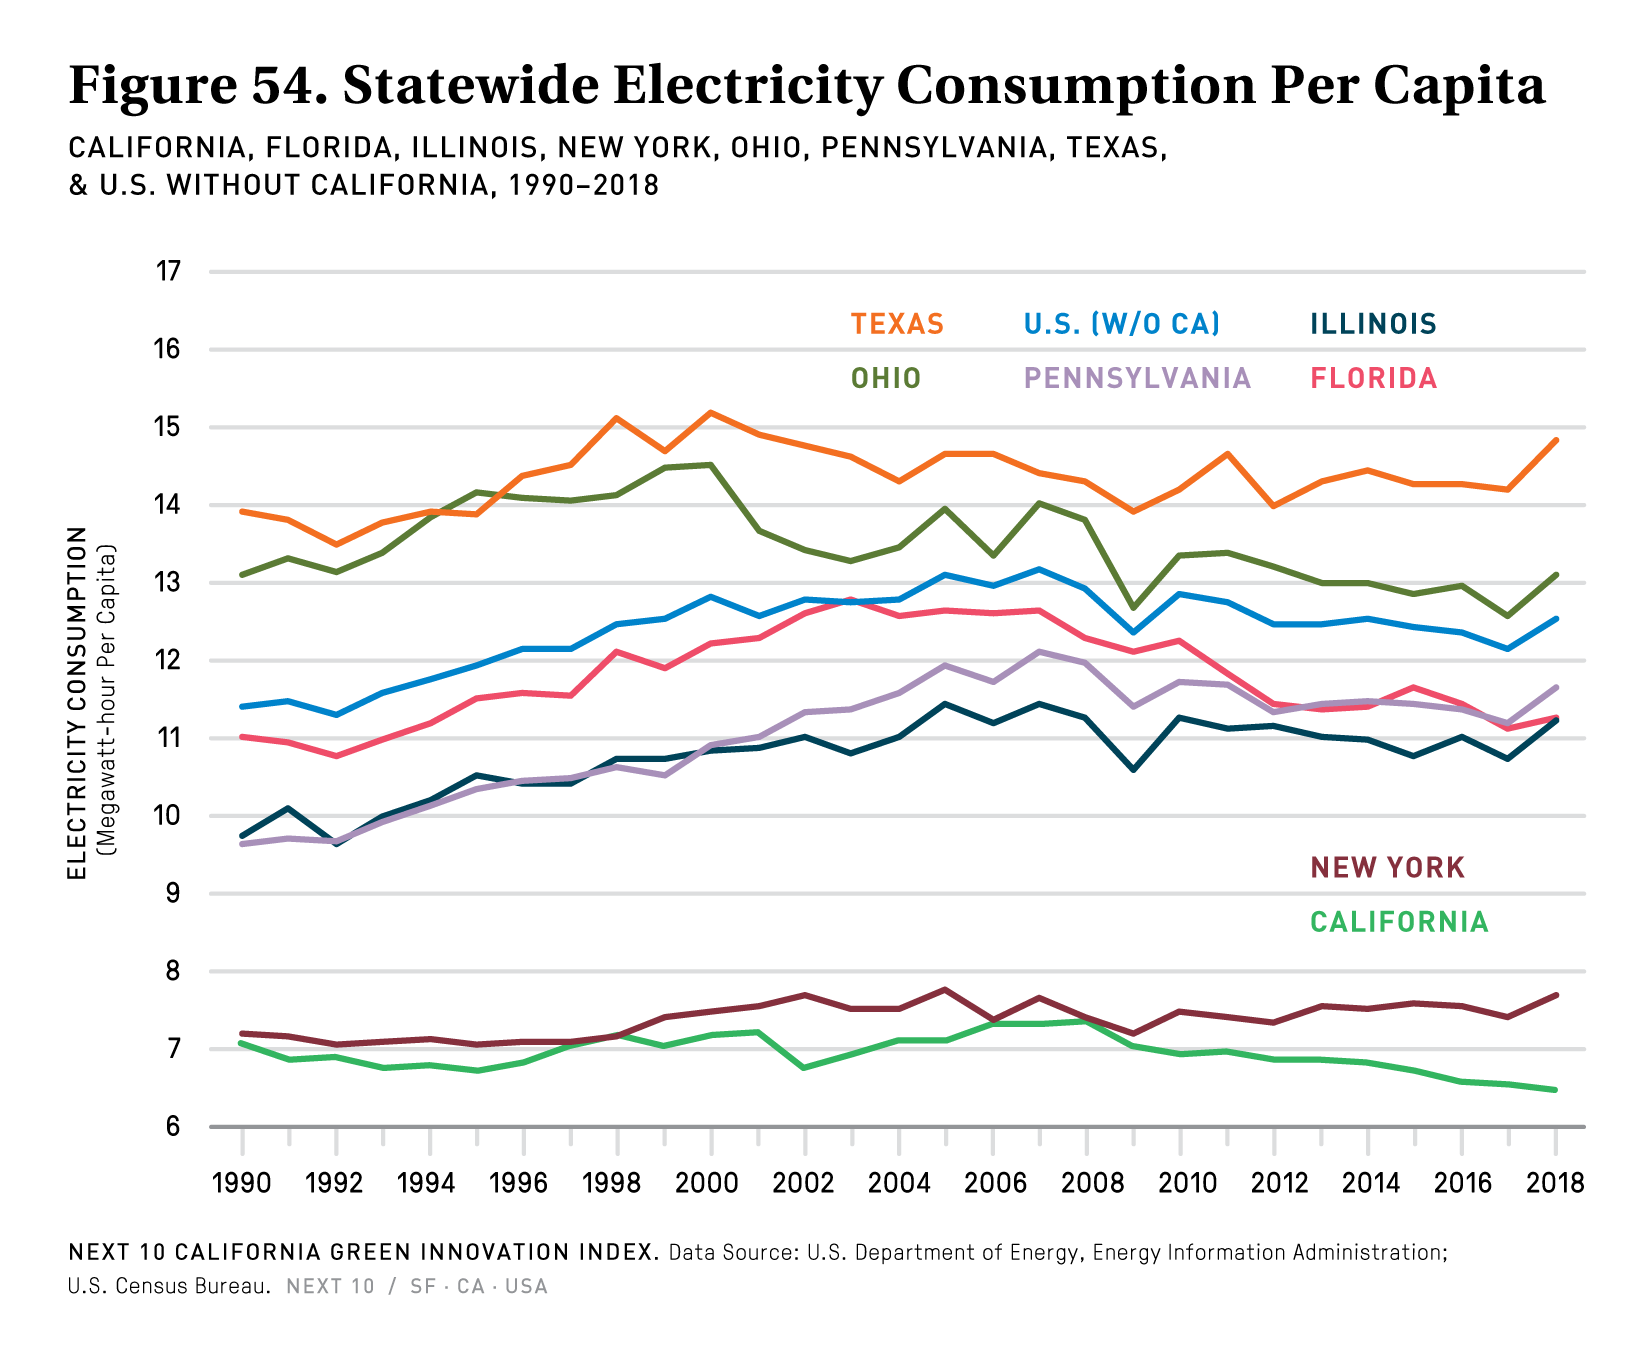
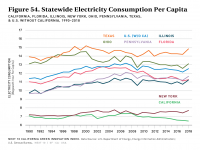
- California’s energy-related emissions per capita were 9.1 MTCO2e per person in 2017—the third-lowest among the 50 states, behind New York and Maryland.
Transportation
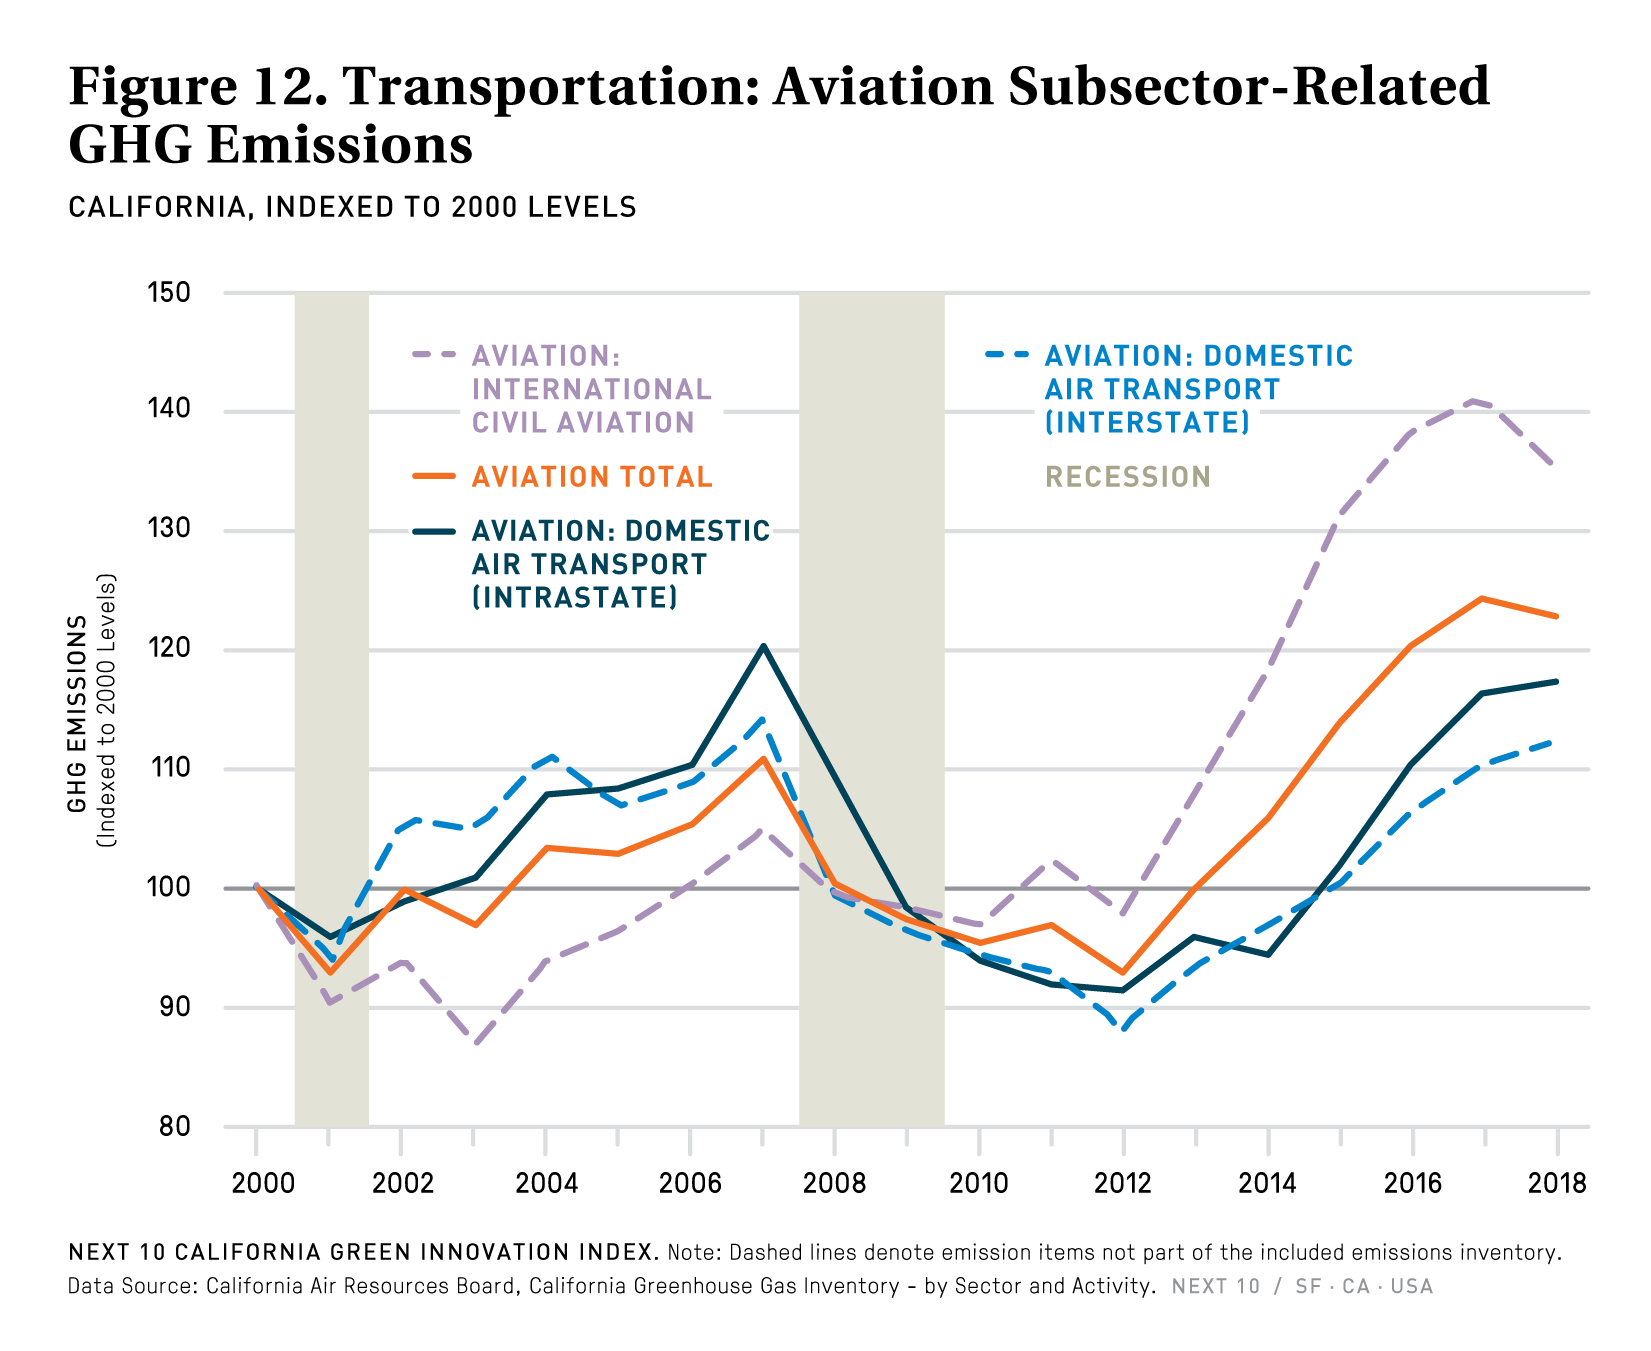
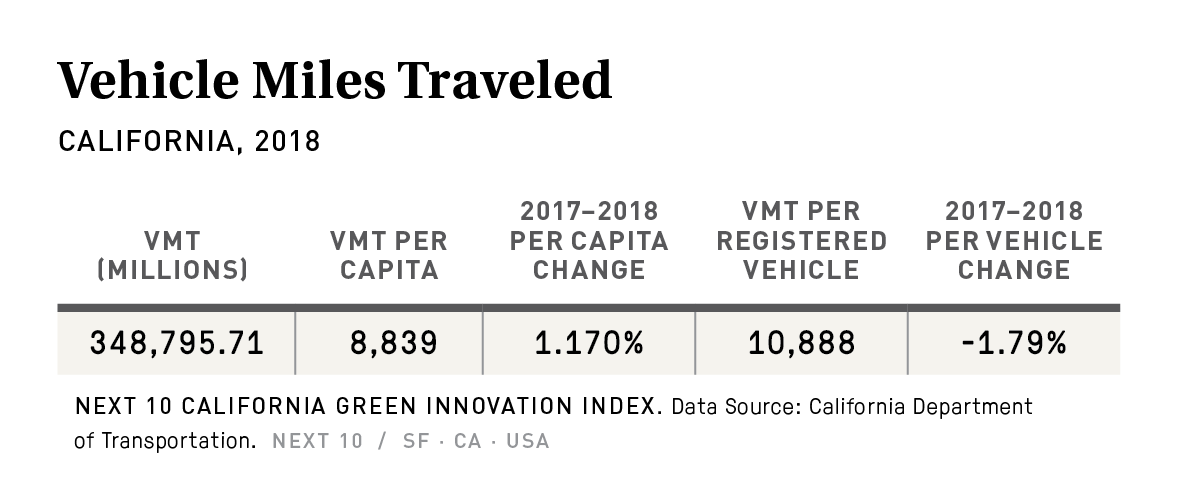
- Within the transportation sector, emissions dropped 1.3 percent from the on-road vehicles subsector, but increased 3.6 percent from off-road vehicles, which includes airport ground equipment, construction and mining equipment, industrial equipment and oil drilling equipment.
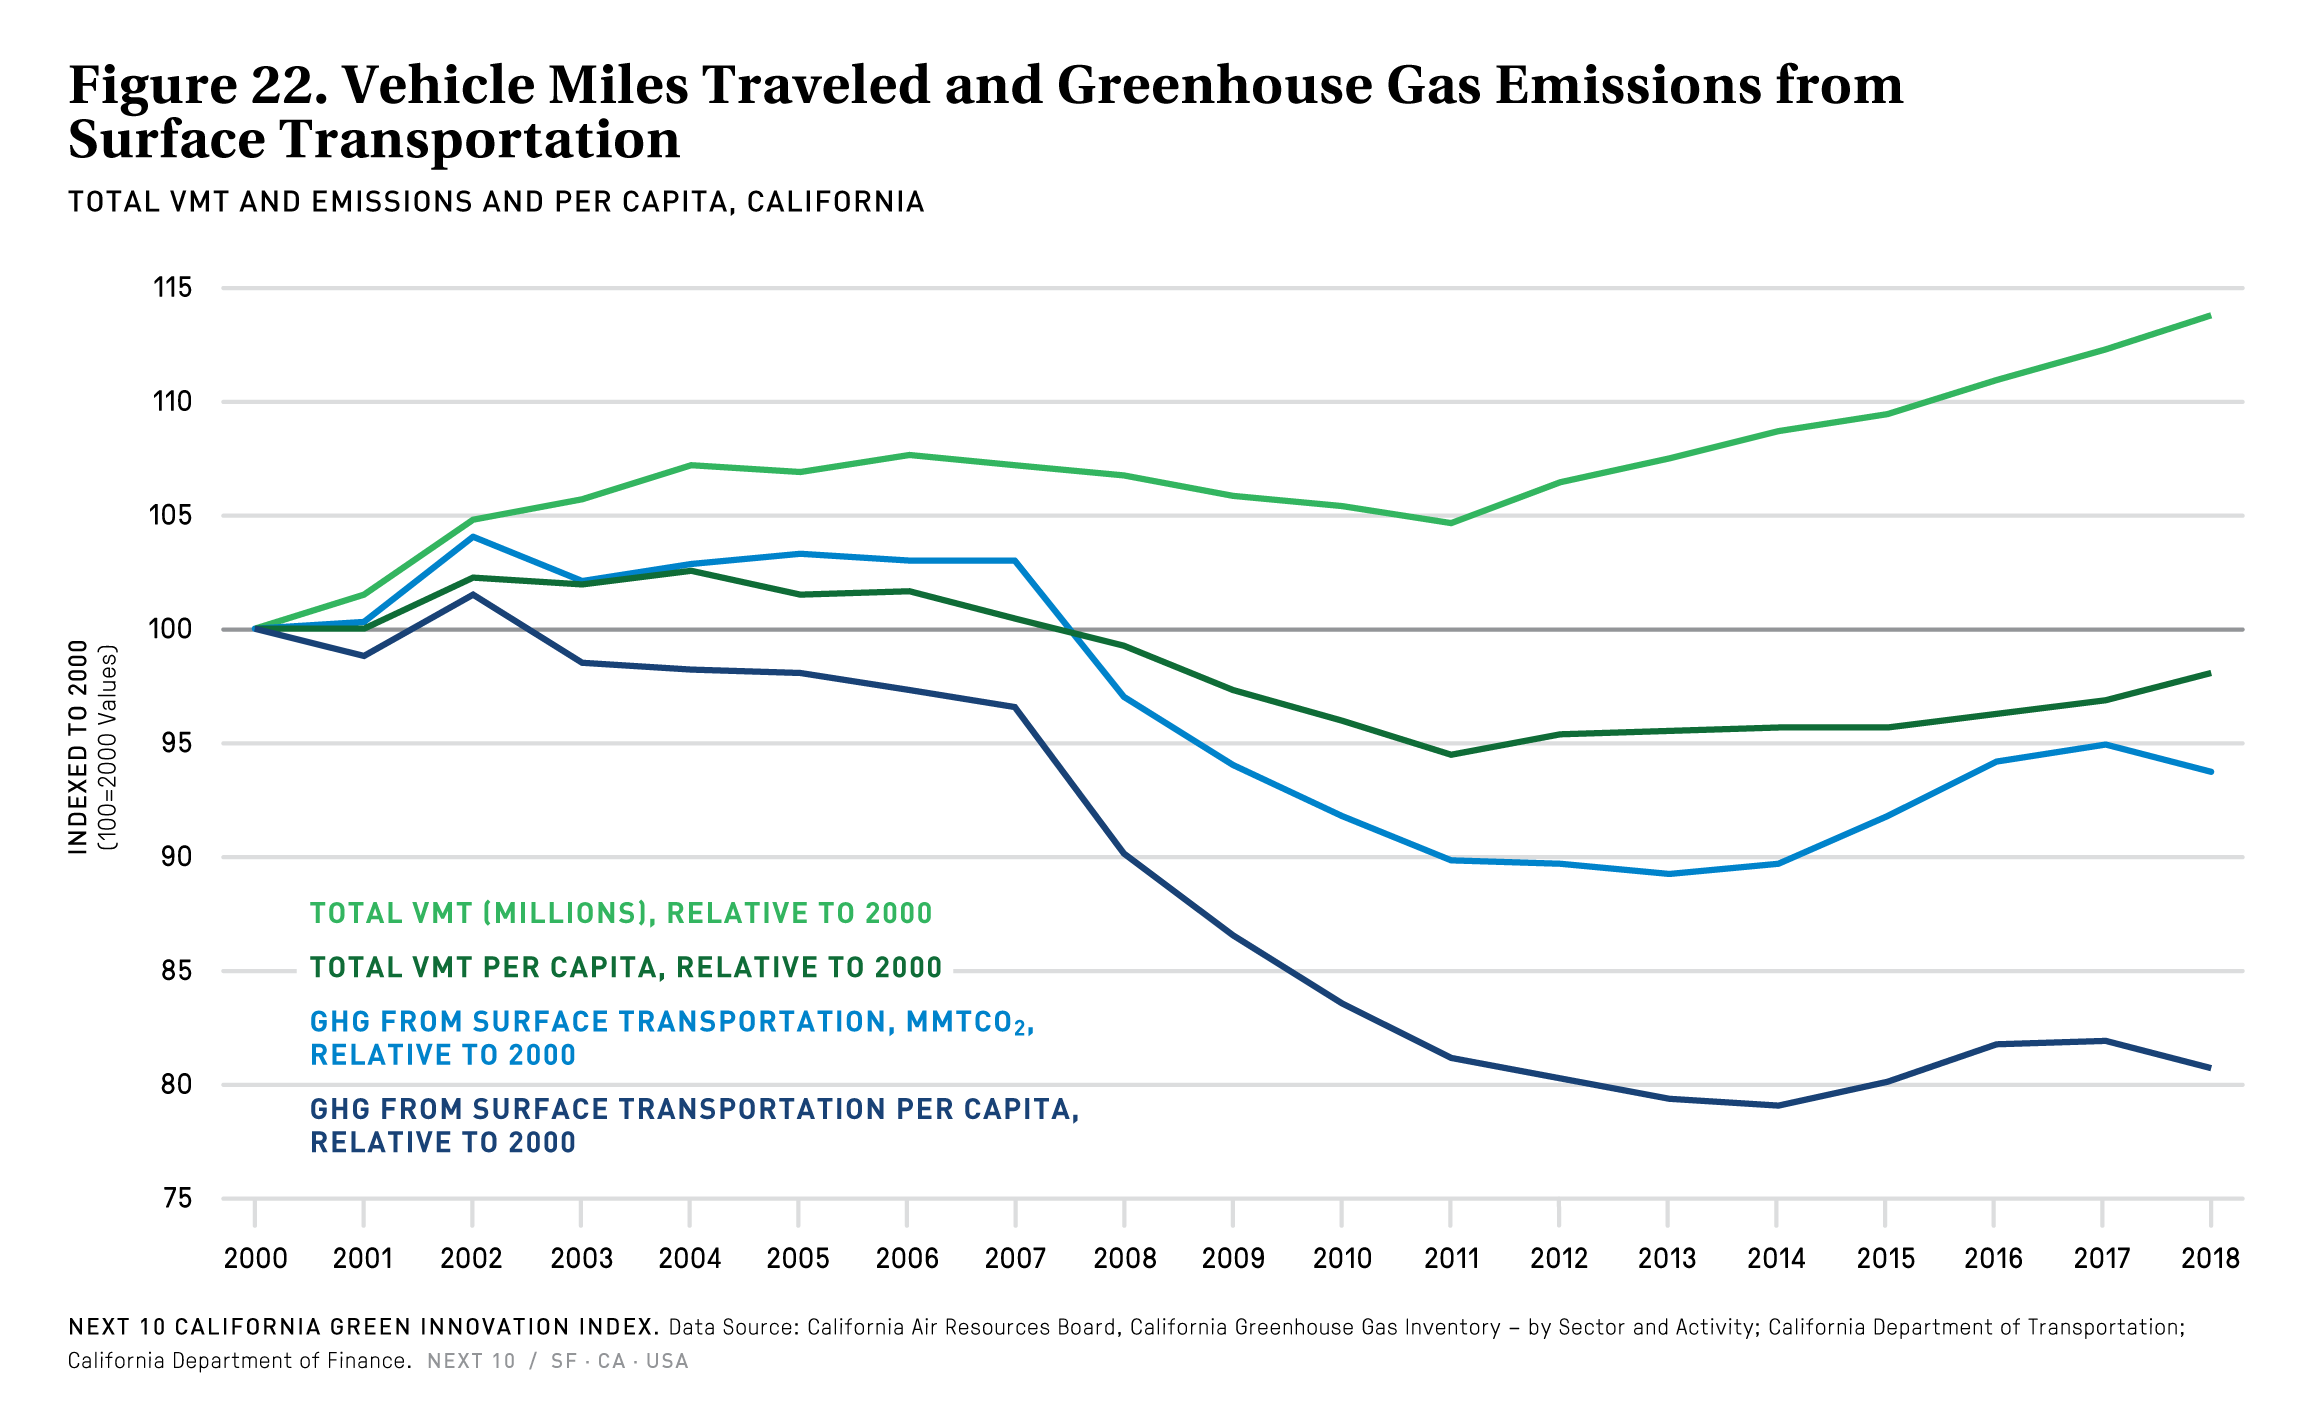
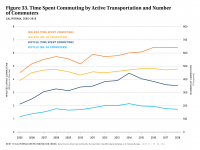
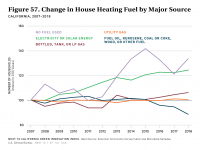
- While the amount of transportation fuel consumed in 2018 was similar to levels from ten and fifteen years prior, emissions from transportation fuel in 2018 were 3.3 percent lower and 8.3 percent lower than 2008 and 2003, respectively. This is the result of policies promoting cleaner vehicle fuels and advanced clean vehicle standards.
- Notably, emissions of buses decreased from 2017 to 2018 despite a slight uptick in the vehicle revenue miles of buses (+0.5%). This is plausibly due to bus fleets becoming cleaner or electrified. Likewise, there exists vast opportunities to electrify heavy-duty trucks.
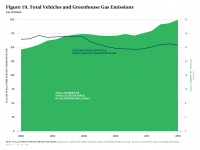
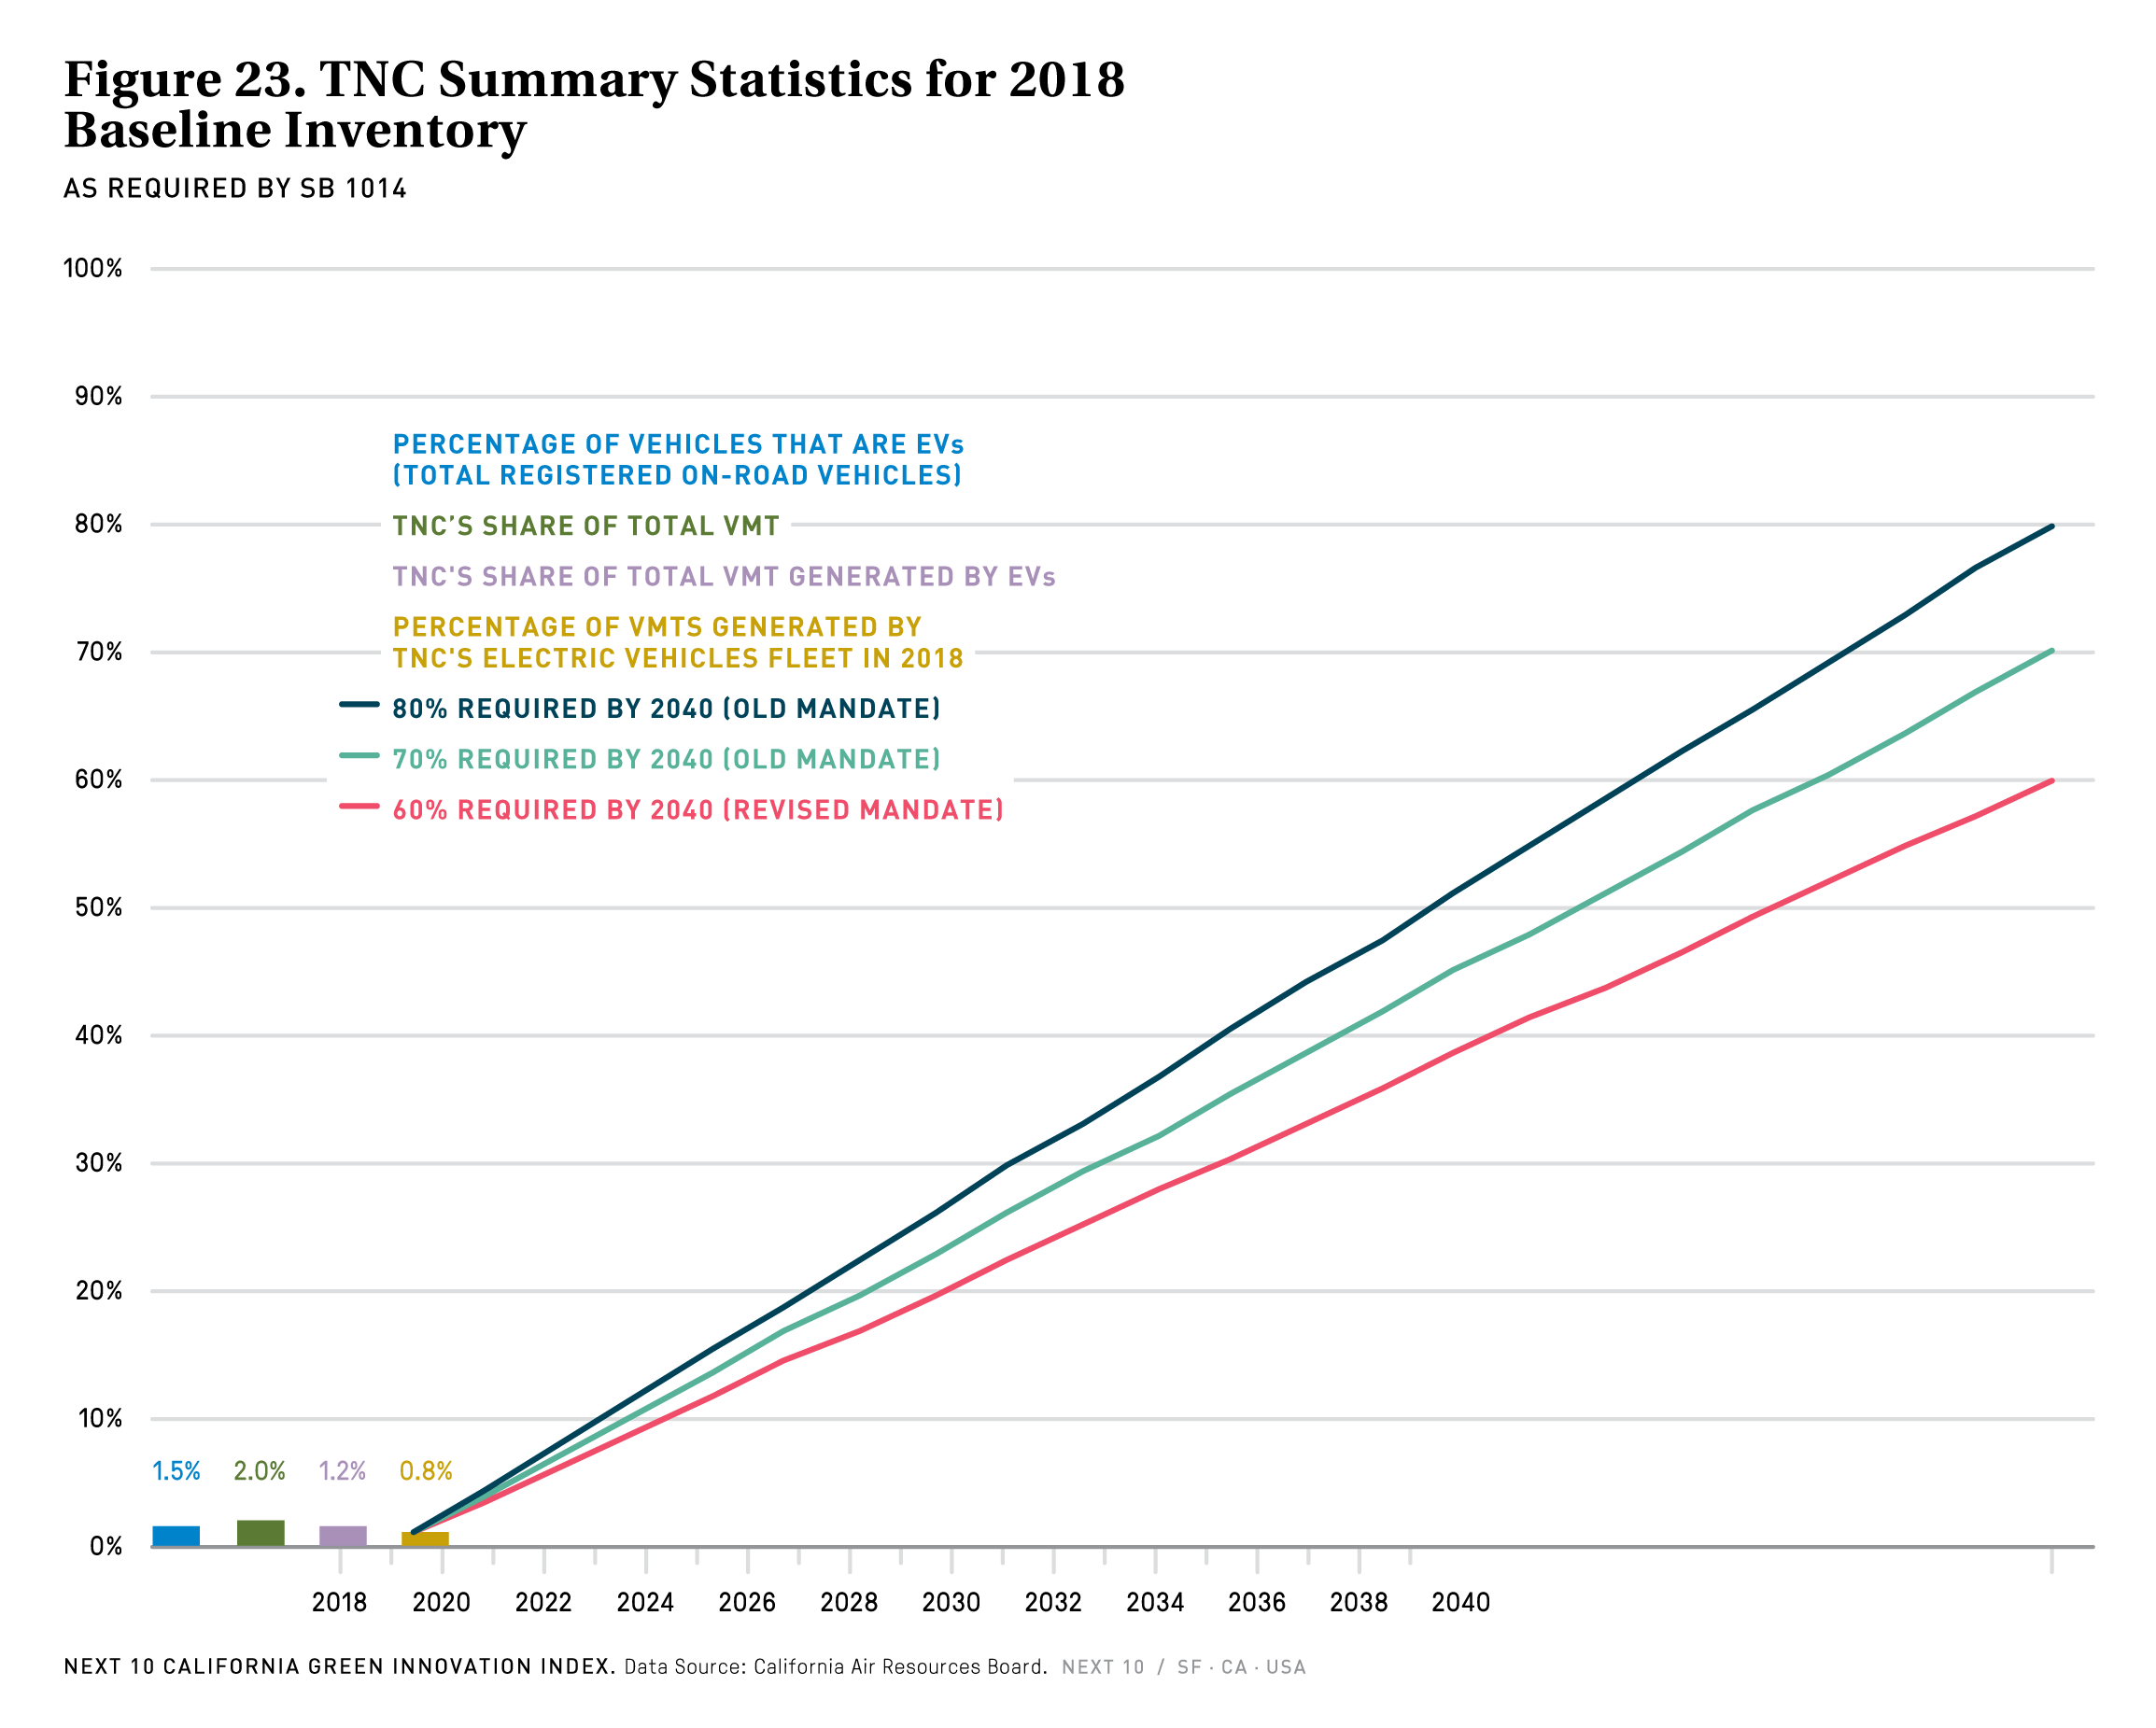
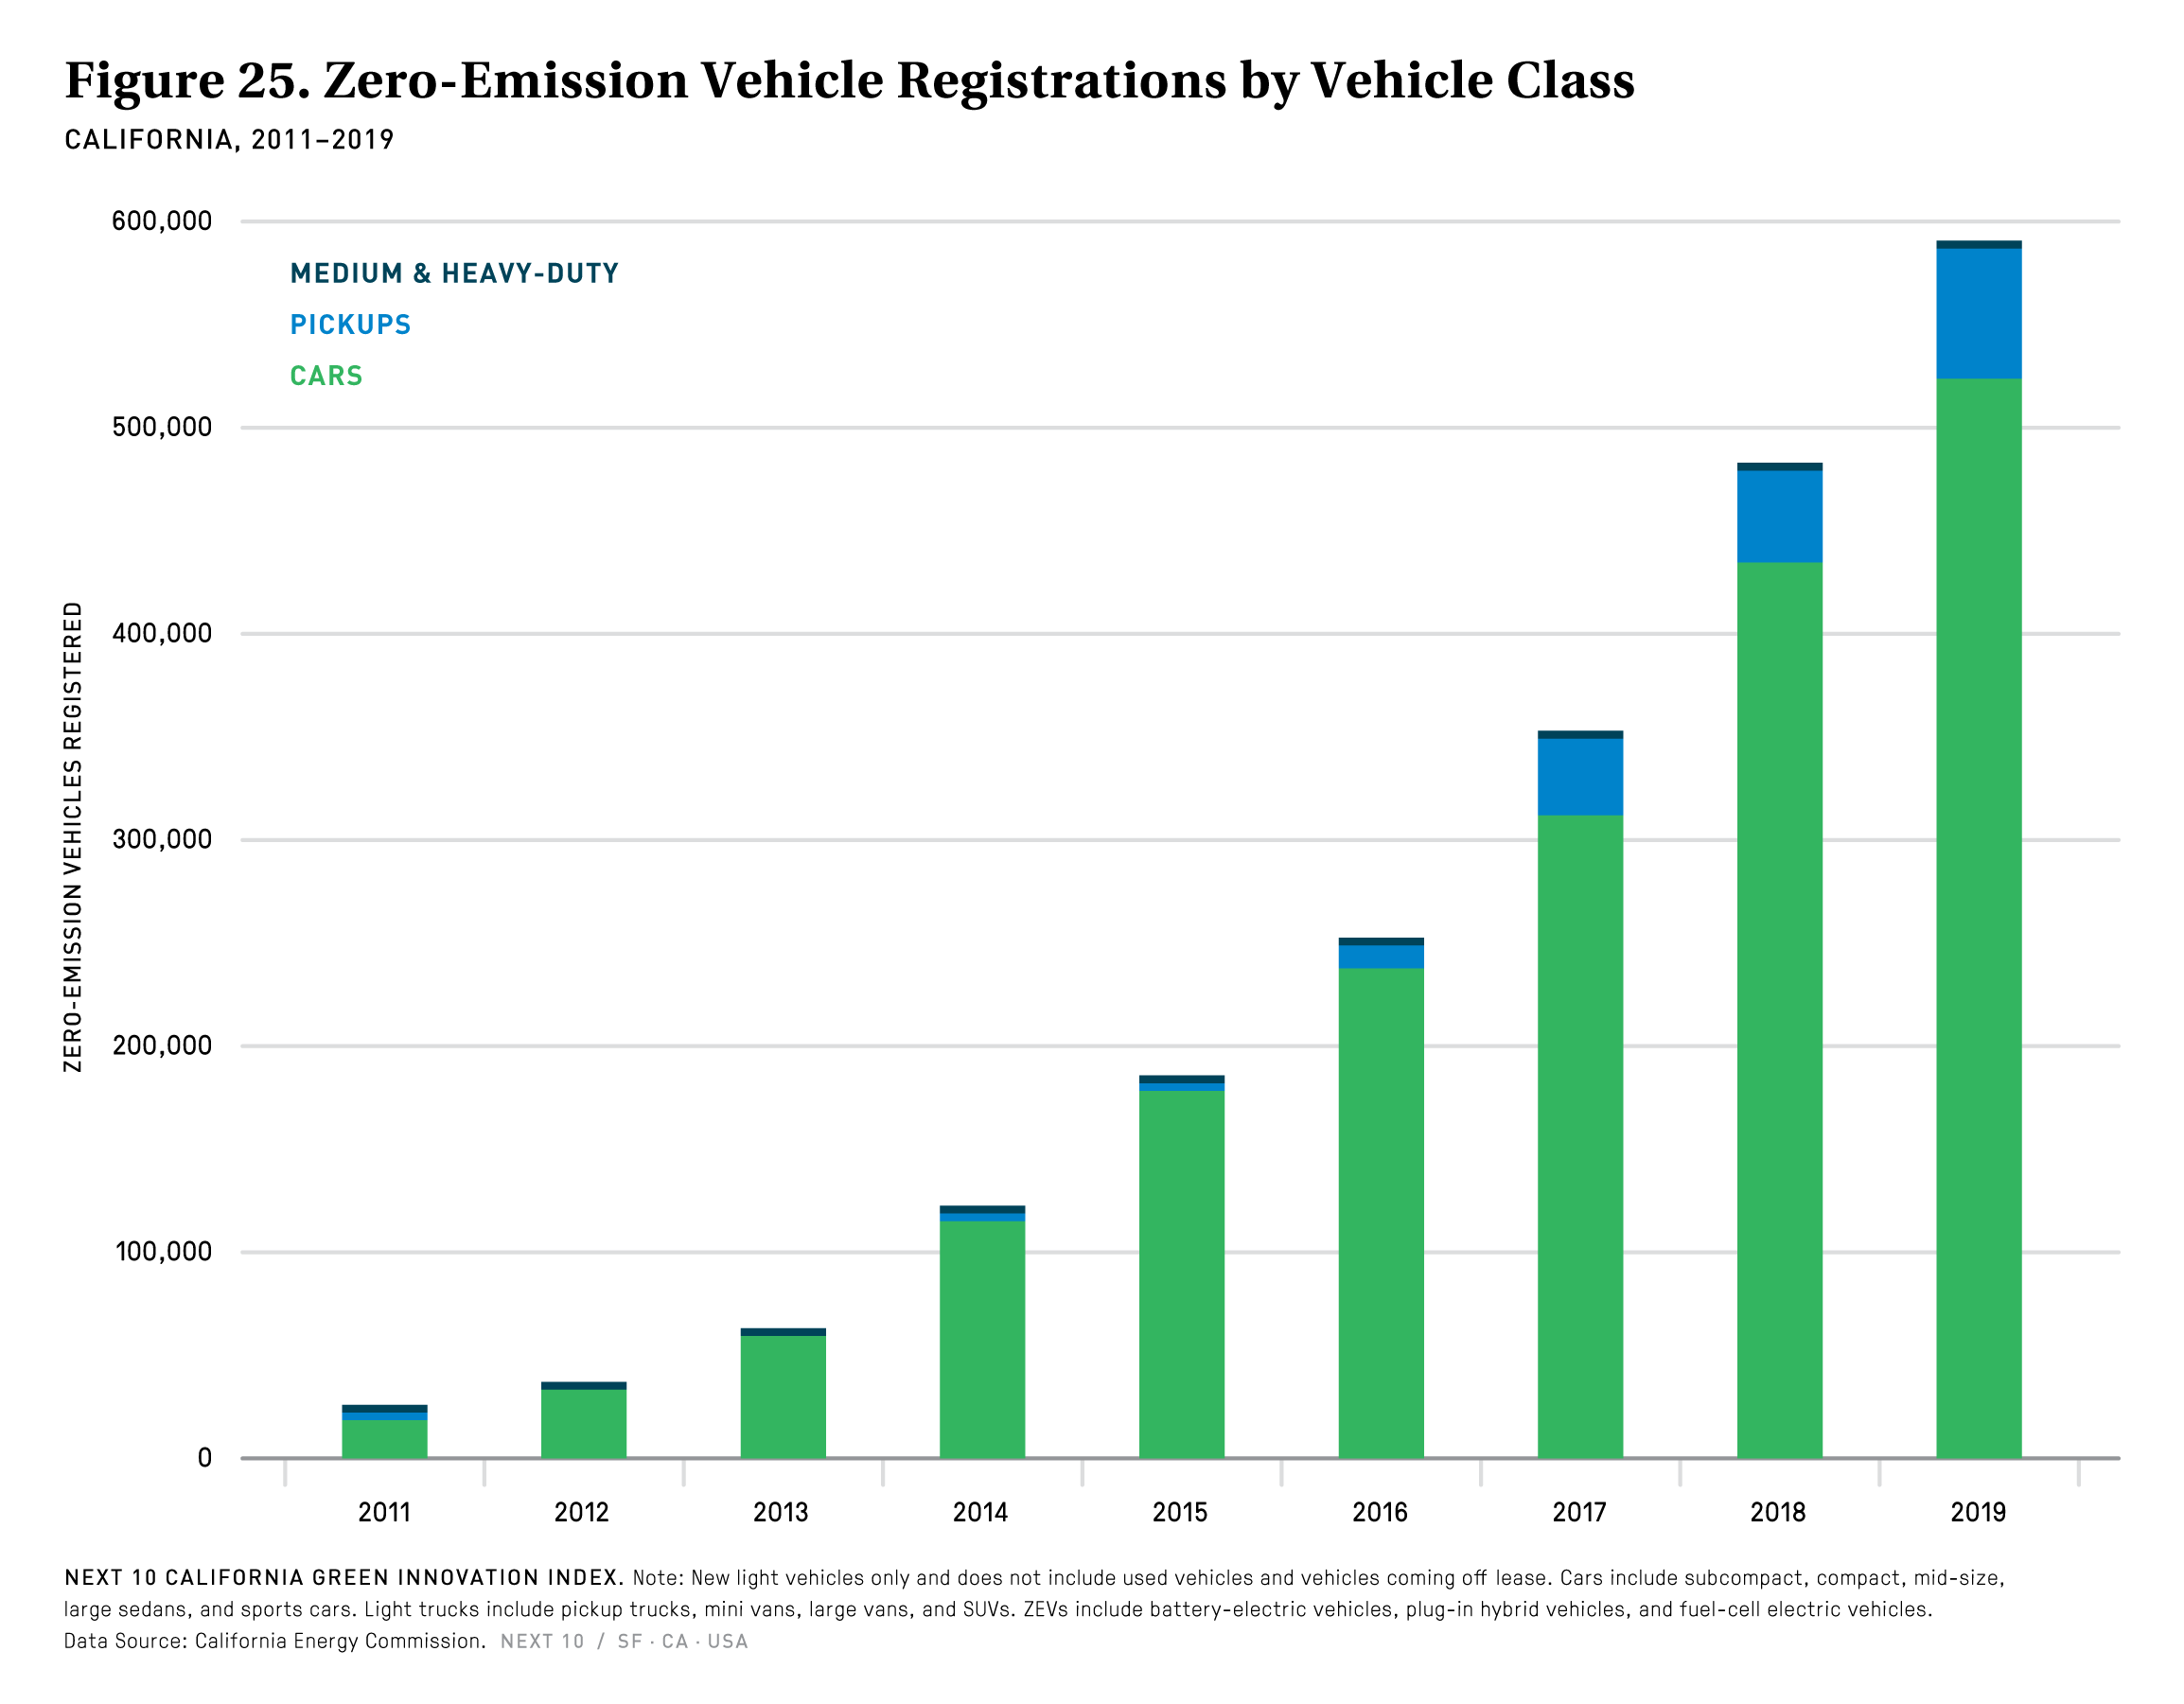
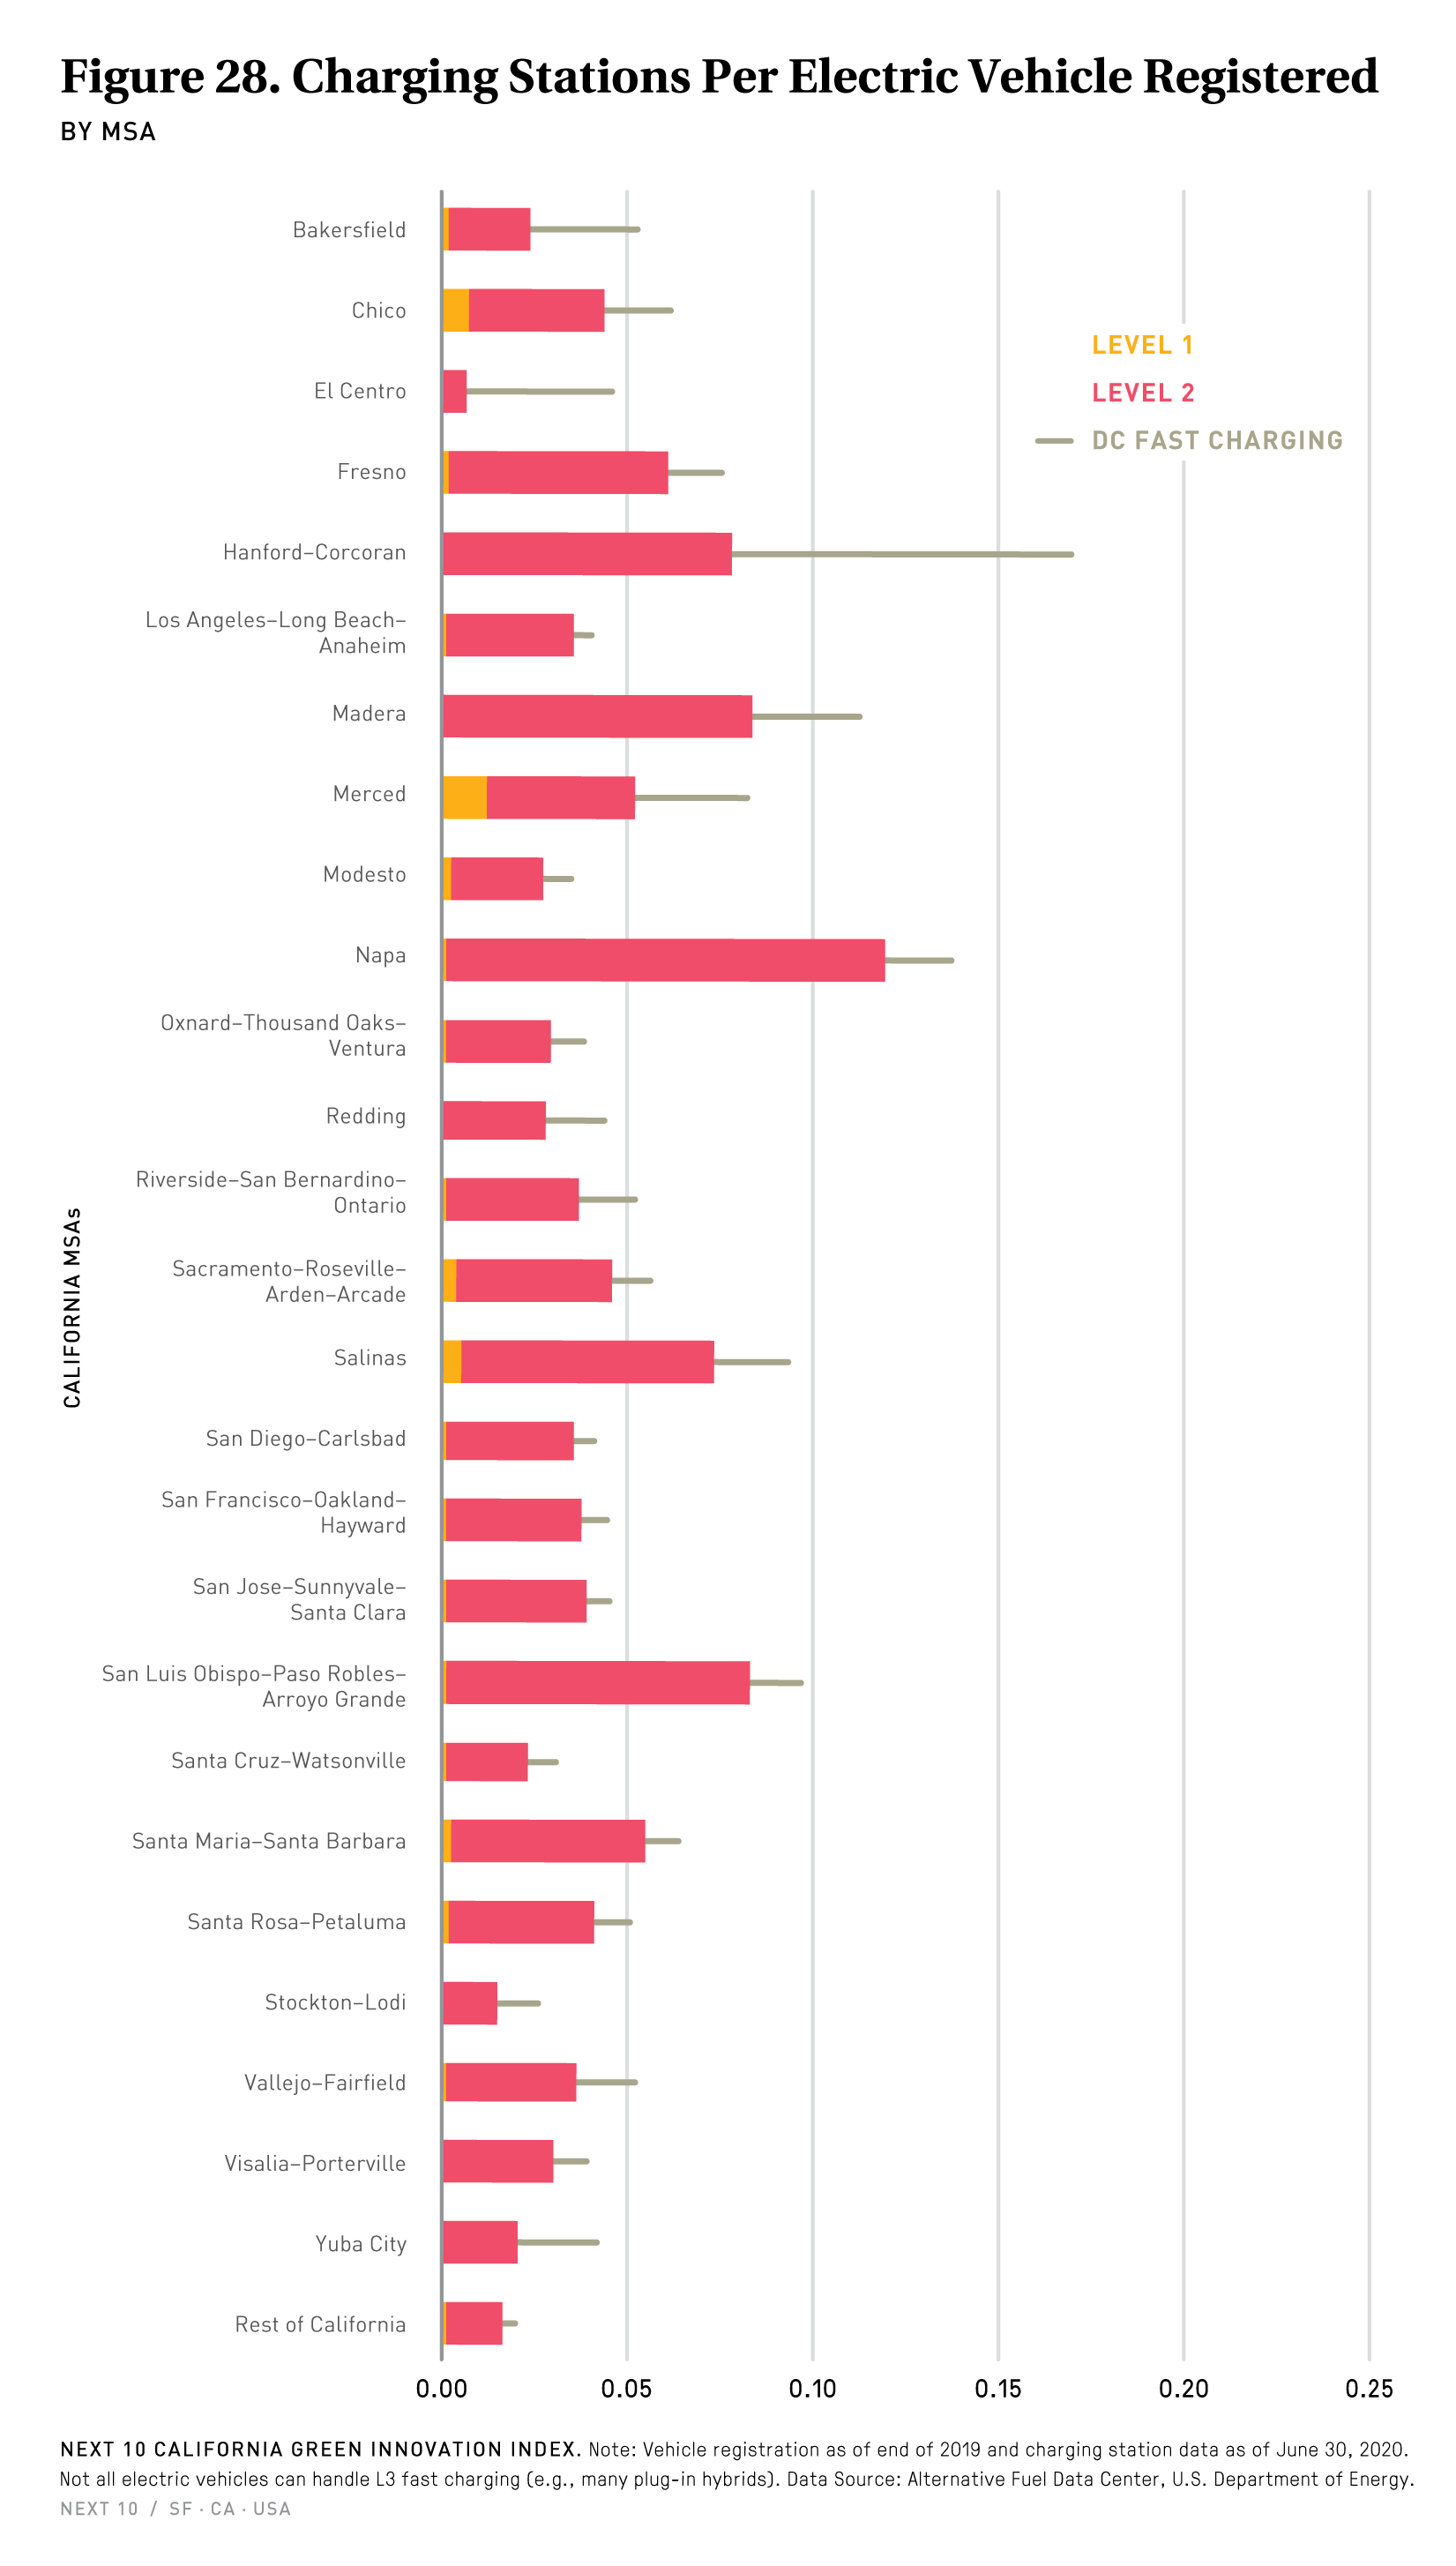
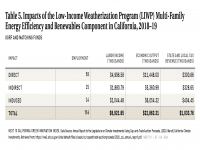
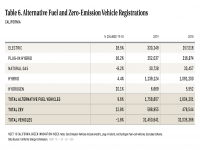
- California is on-track to meet its 2025 ZEV target, but at the current pace of adoption, will not meet the goal of five million zero-emission vehicle on-road by 2030.
- Light-duty vehicles emissions went down slightly from 2017 to 2018 (-0.5%), but the overall trend for the last five years or so is still up (+6.6%).
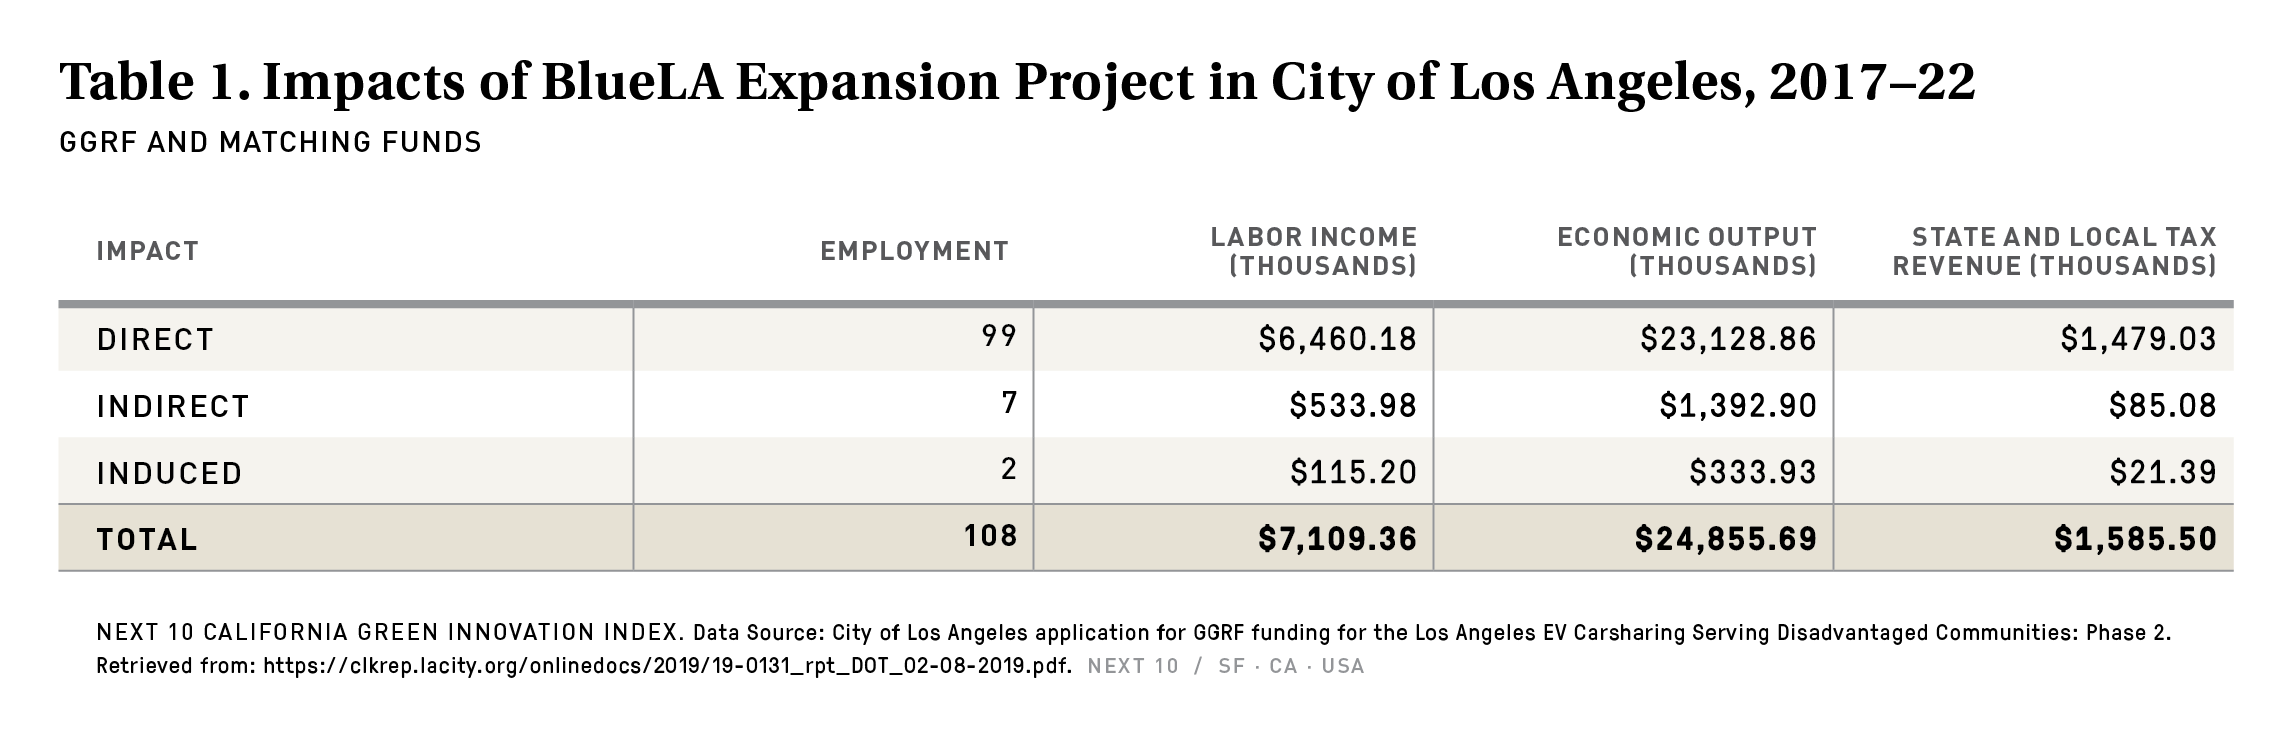
Green Stimulus Project Analysis
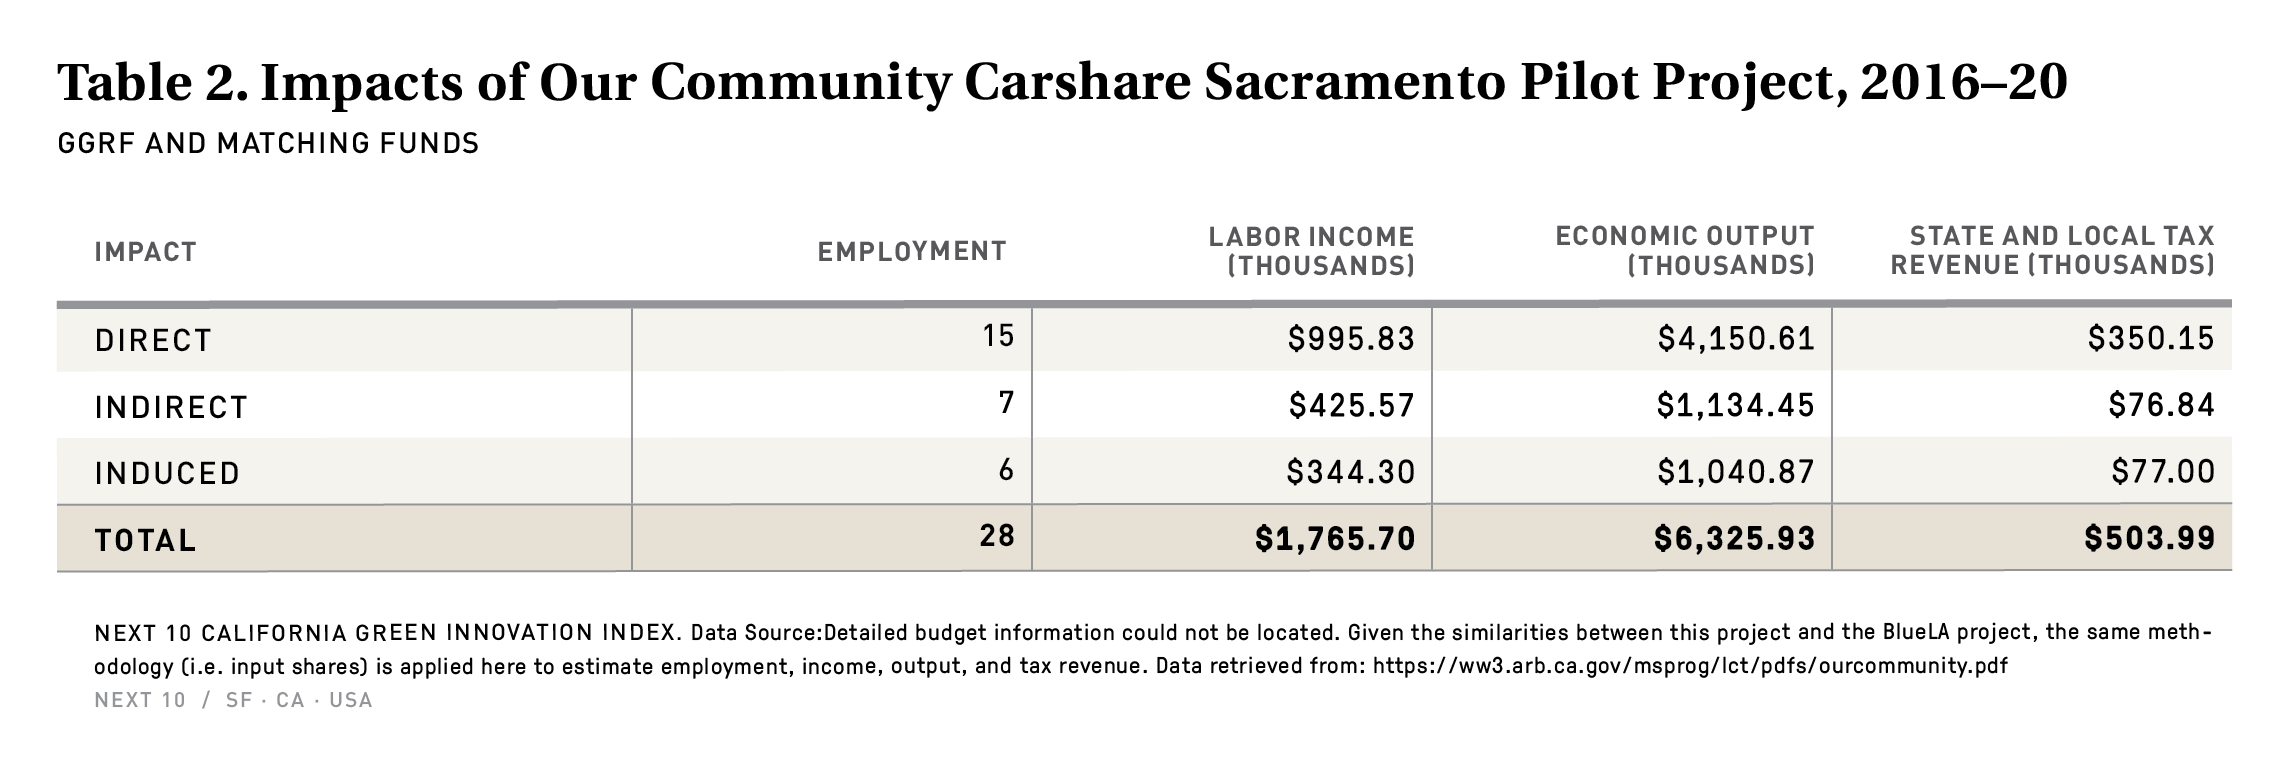
- With a total of $23.1 million in project funding, the City of Los Angeles’ BlueLA car share program, which aims to reduce emissions by extending access to electric vehicles (through carshares, vanpools, and shuttle services) in disadvantaged communities most affected by pollutants—airborne and otherwise, is expected to generate $7.1 million in labor income, $24.9 million in economic output, $1.6 million in state and local tax revenue, and support 108 jobs in the City of Los Angeles.
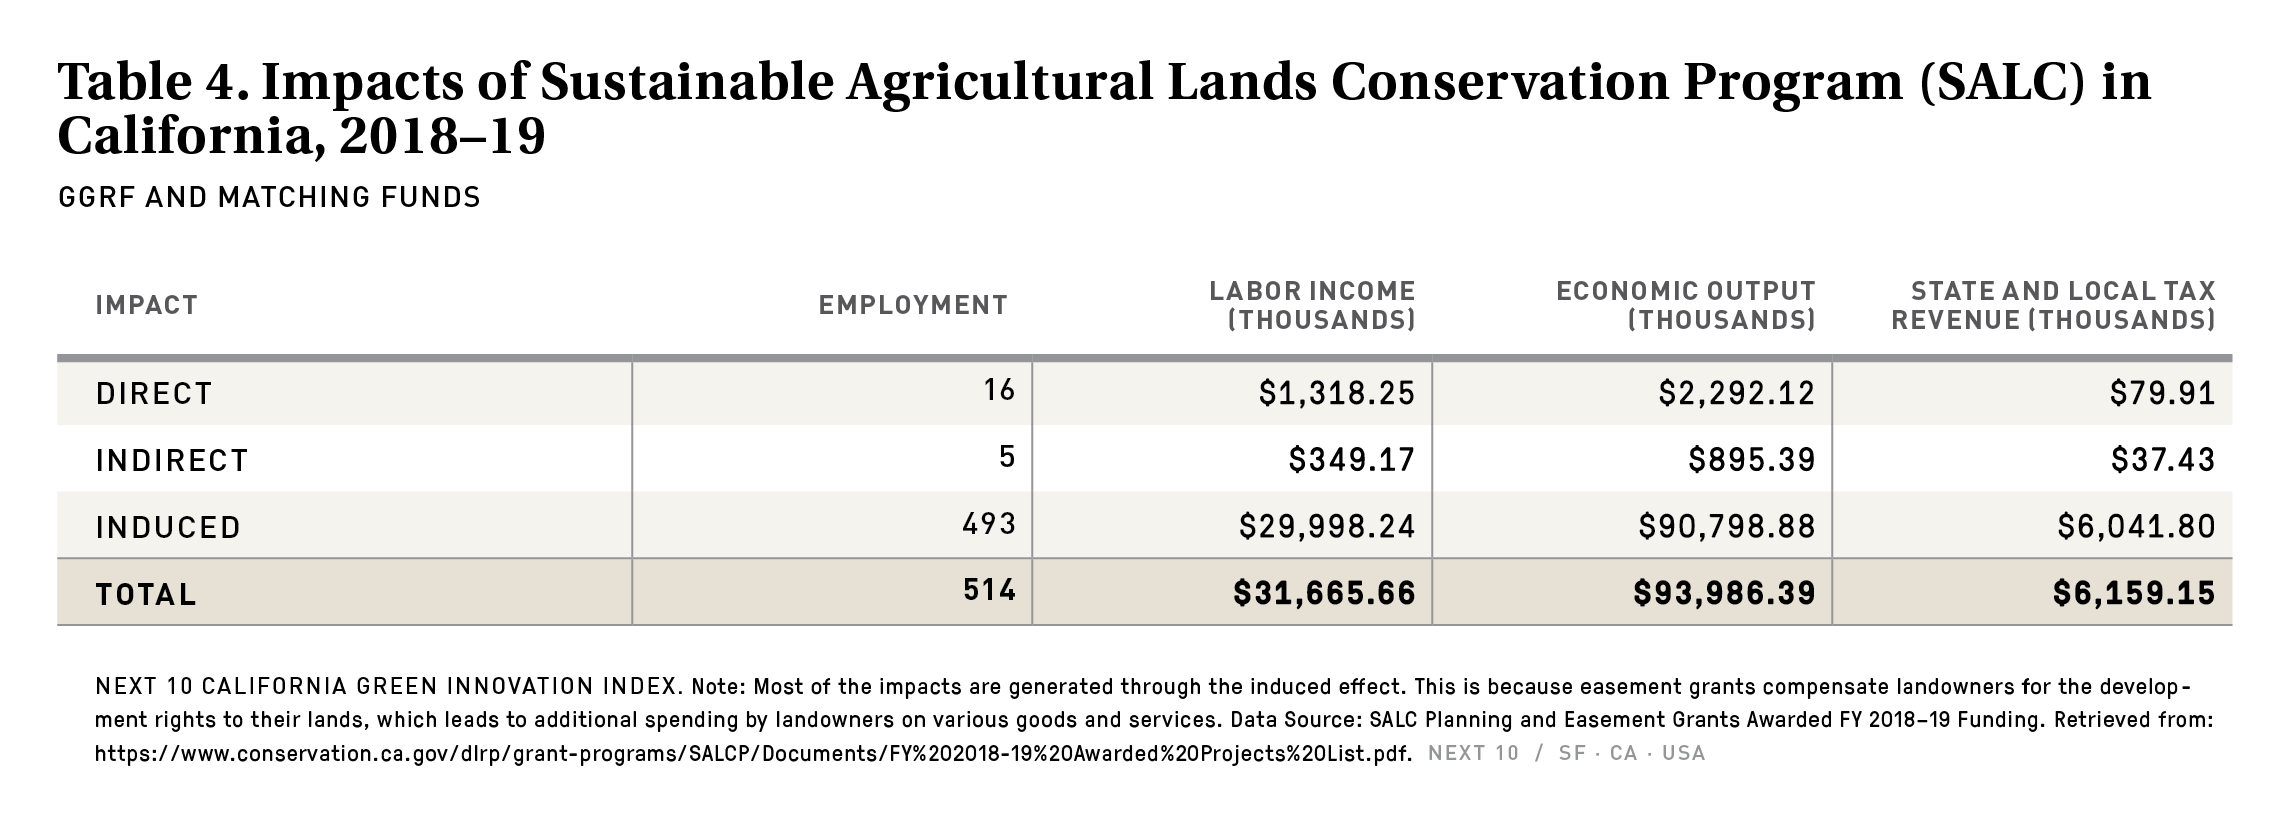
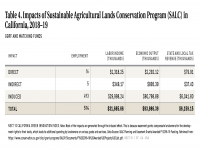
- With a total of $70.8 million funding, the Sustainable Agricultural Lands Conservation Program (SALC) Program, which aims to reduce GHG emissions by protecting agricultural lands against conversion to more GHG-intensive uses through conservation easement and planning grants is expected to generate $31.7 million in labor income, $94.0 million in output, $6.2 million in state and local tax revenue, and support 514 jobs in California.
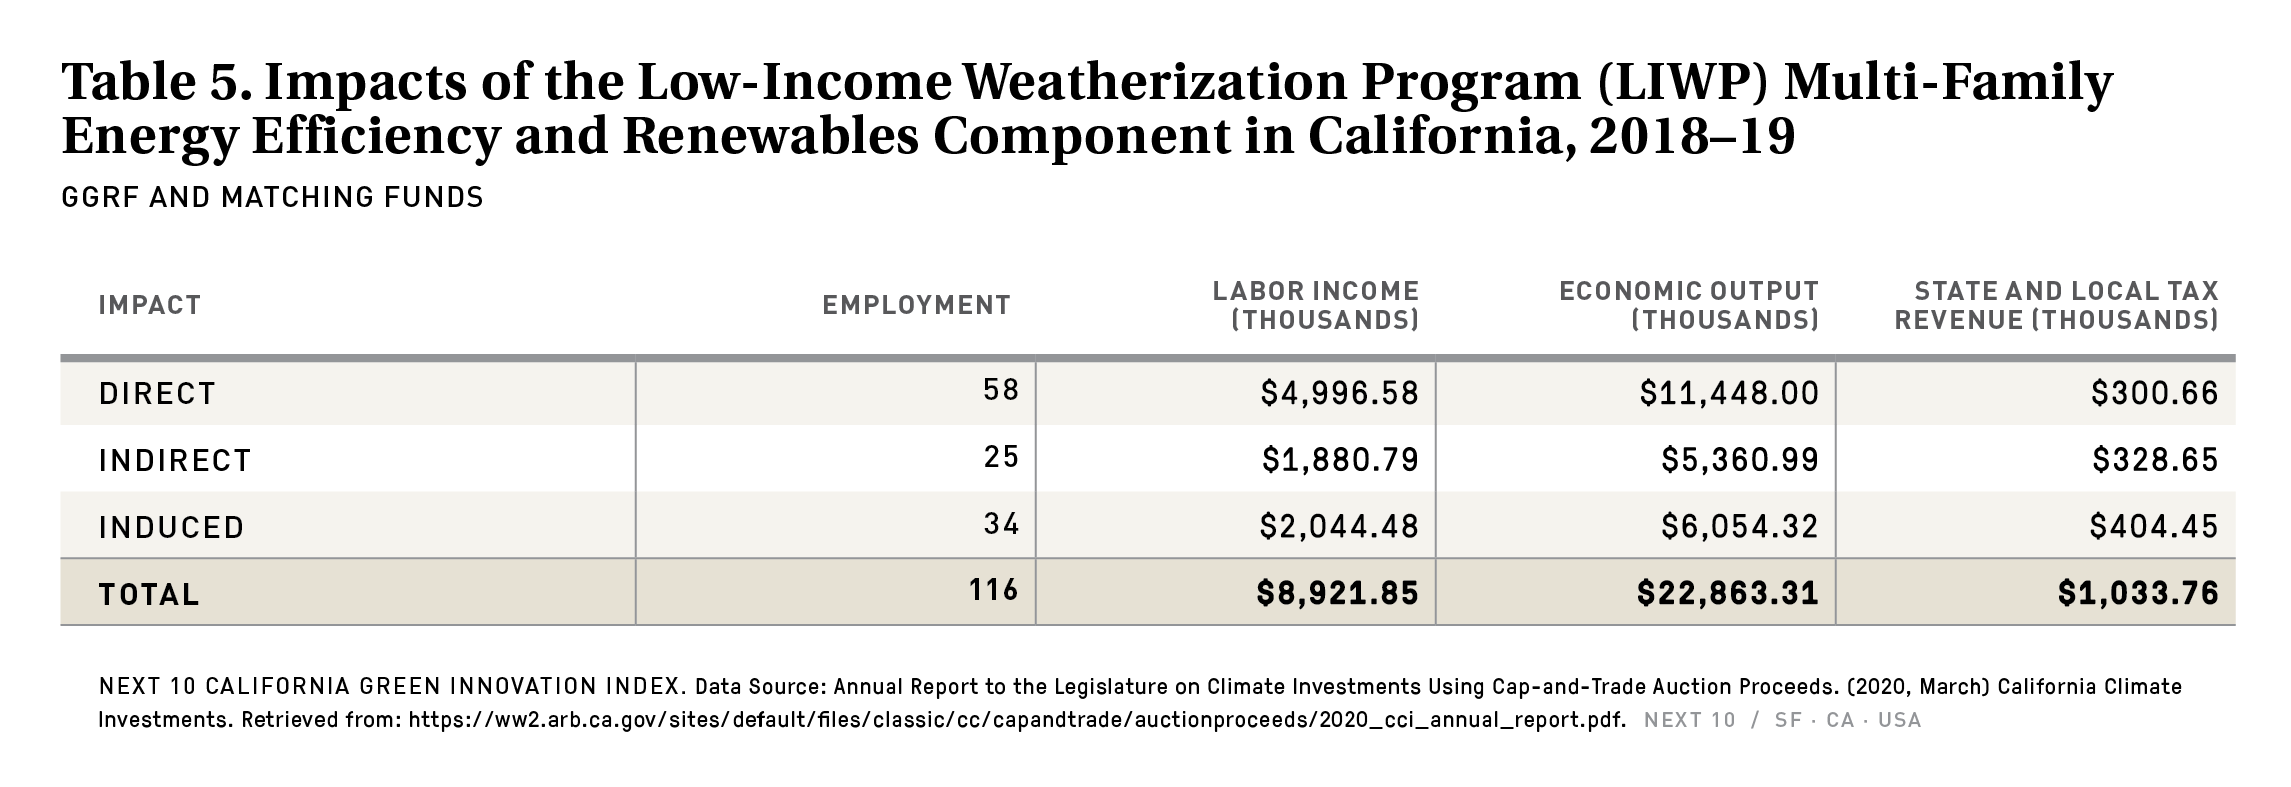
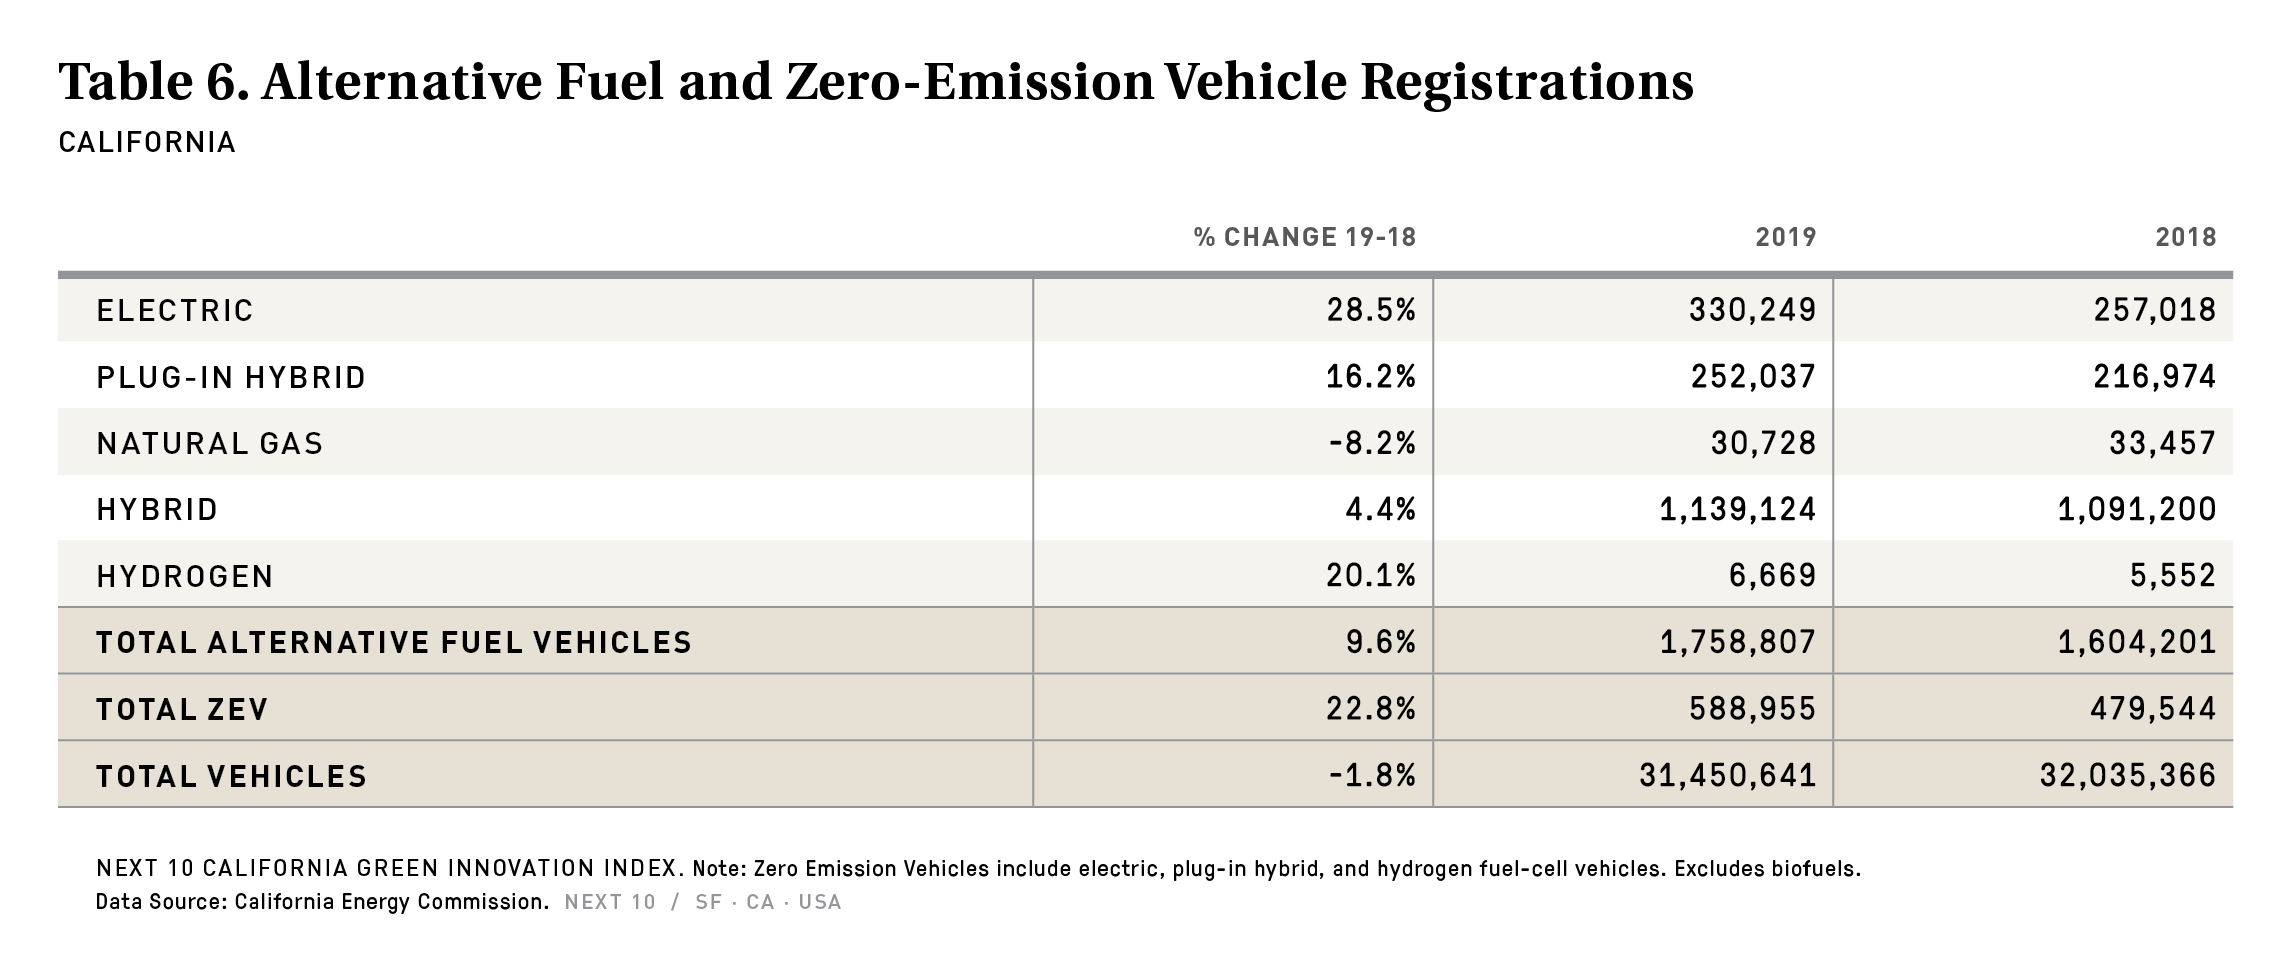
- With a total of $11.4 million in funding, the Low-Income Weatherization Program (LIWP), which provides low-income households (located in either multifamily, community - or farmworker housing) with energy efficiency upgrades and solar photovoltaic systems to help reduce residential emissions, is expected to generate $8.9 million in labor income, $22.9 million in output, $1.0 million in state and local tax revenue, and support 116 jobs in California.
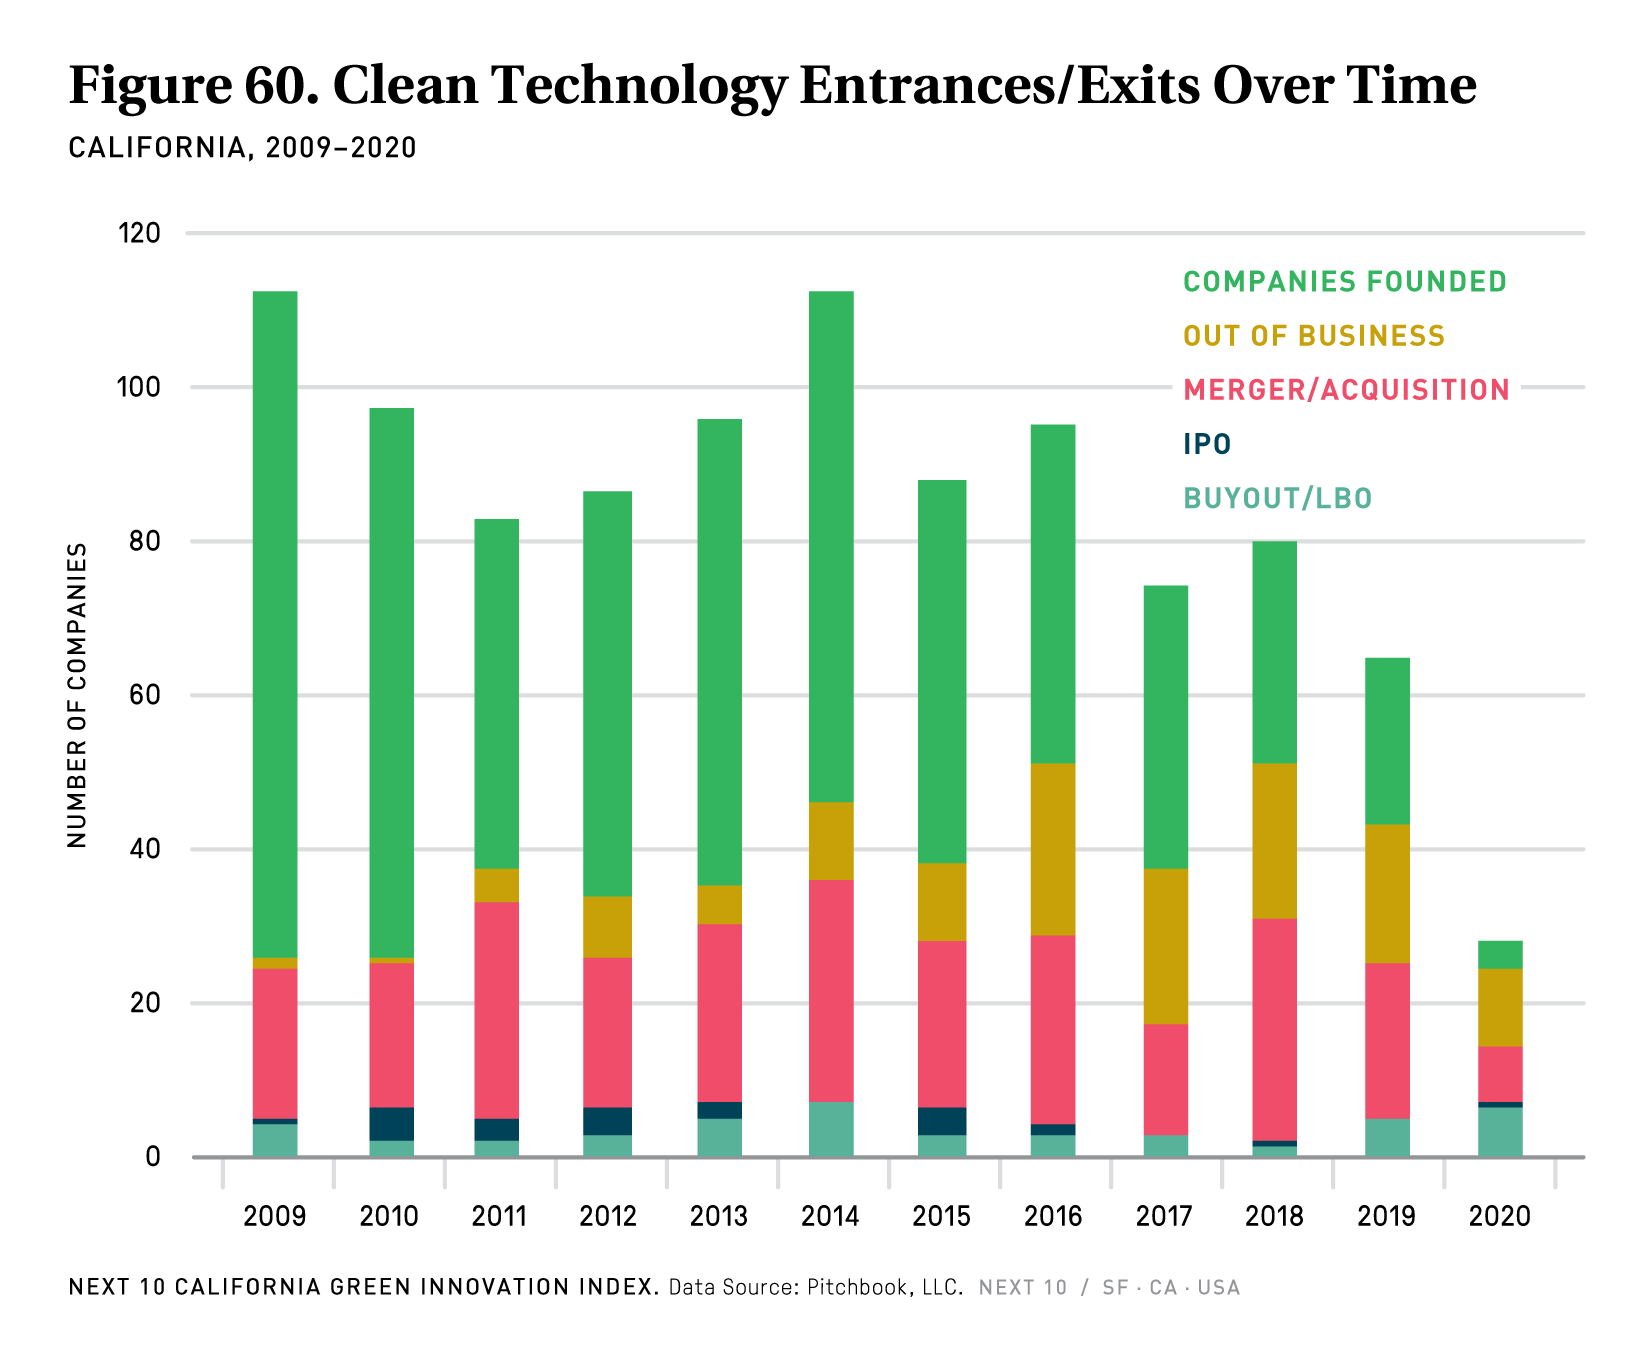
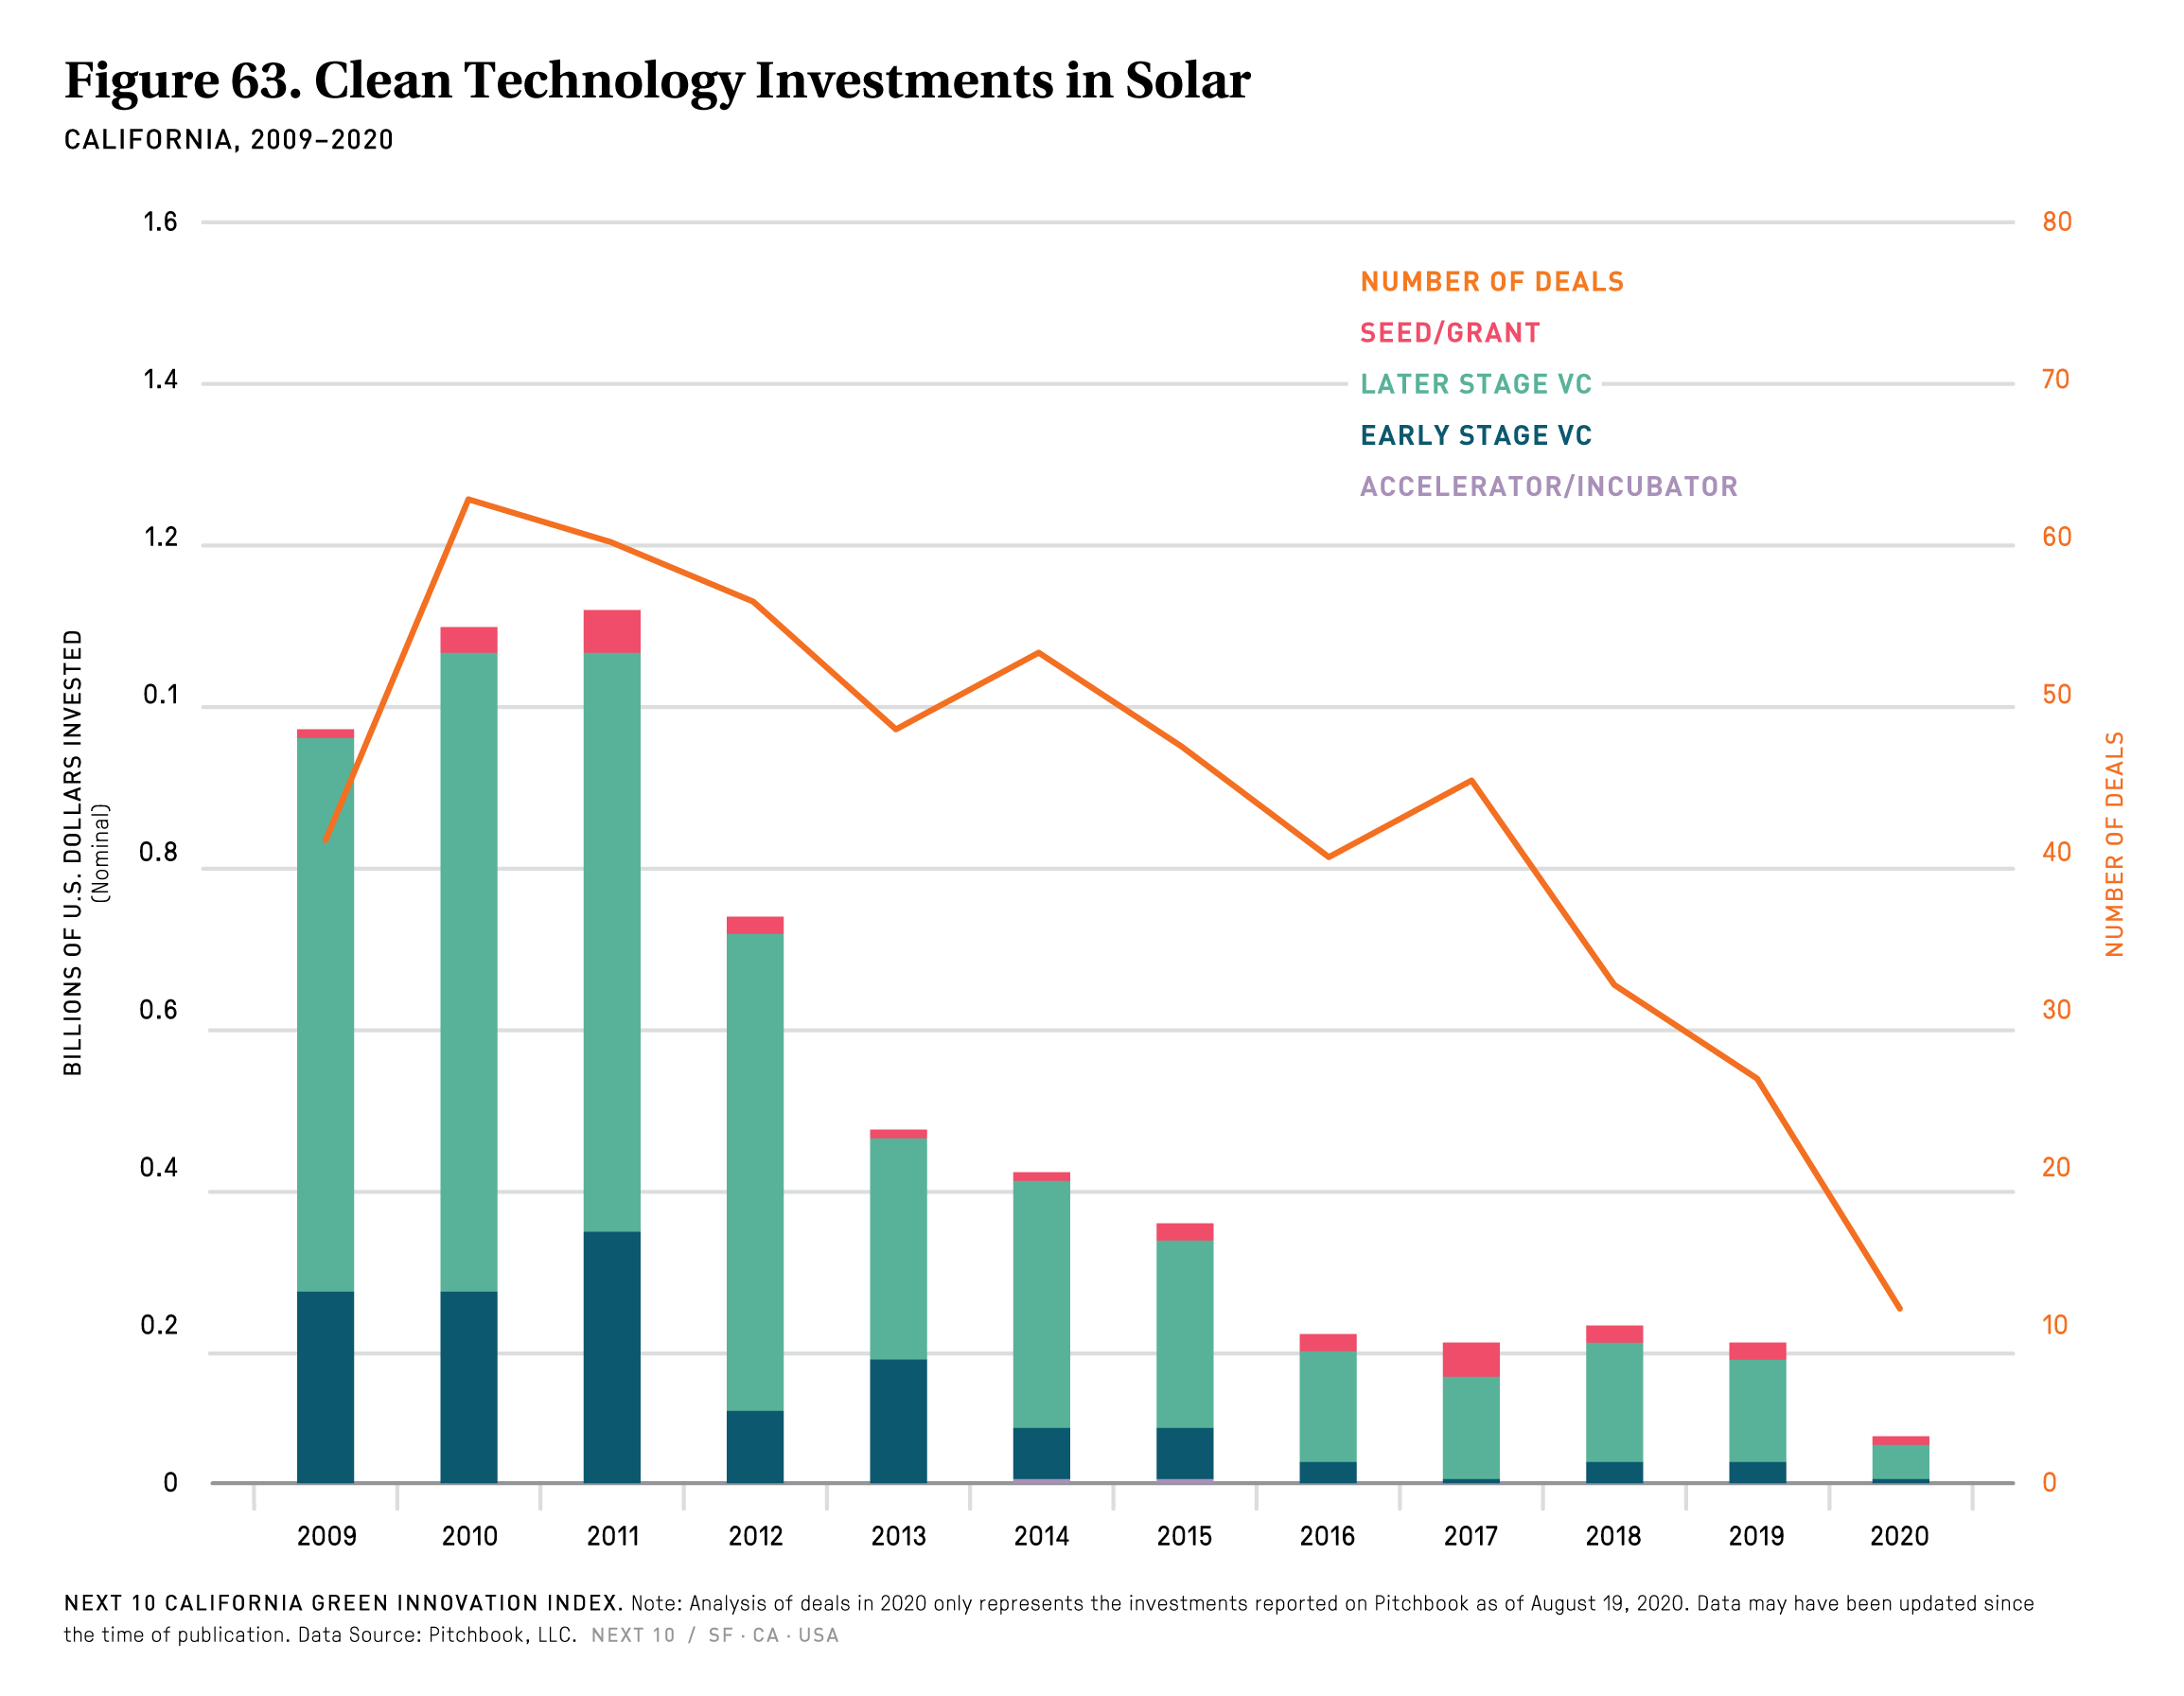
Clean Technology Investment
- Compared to 2018, the dollar amount investment in California clean tech firms decreased significantly in 2019 (-39%), totaling $3.1 billion —with $1.25 billion of that total investment attributed to a single deal from Faraday Future, a leading electric vehicles company.
- The average investment amount has gone down. In 2019, the average deal in California was $18.5 million (down from $27 million in 2018) compared to $11 million in the U.S. overall (down from $15 million in 2018).
- Despite the economic impacts induced by the COVID-19 pandemic, total clean tech investment through mid-August 2020 ($2.8 billion) was close to the total amount of clean tech VC investment through all of 2019 ($3.1 billion).
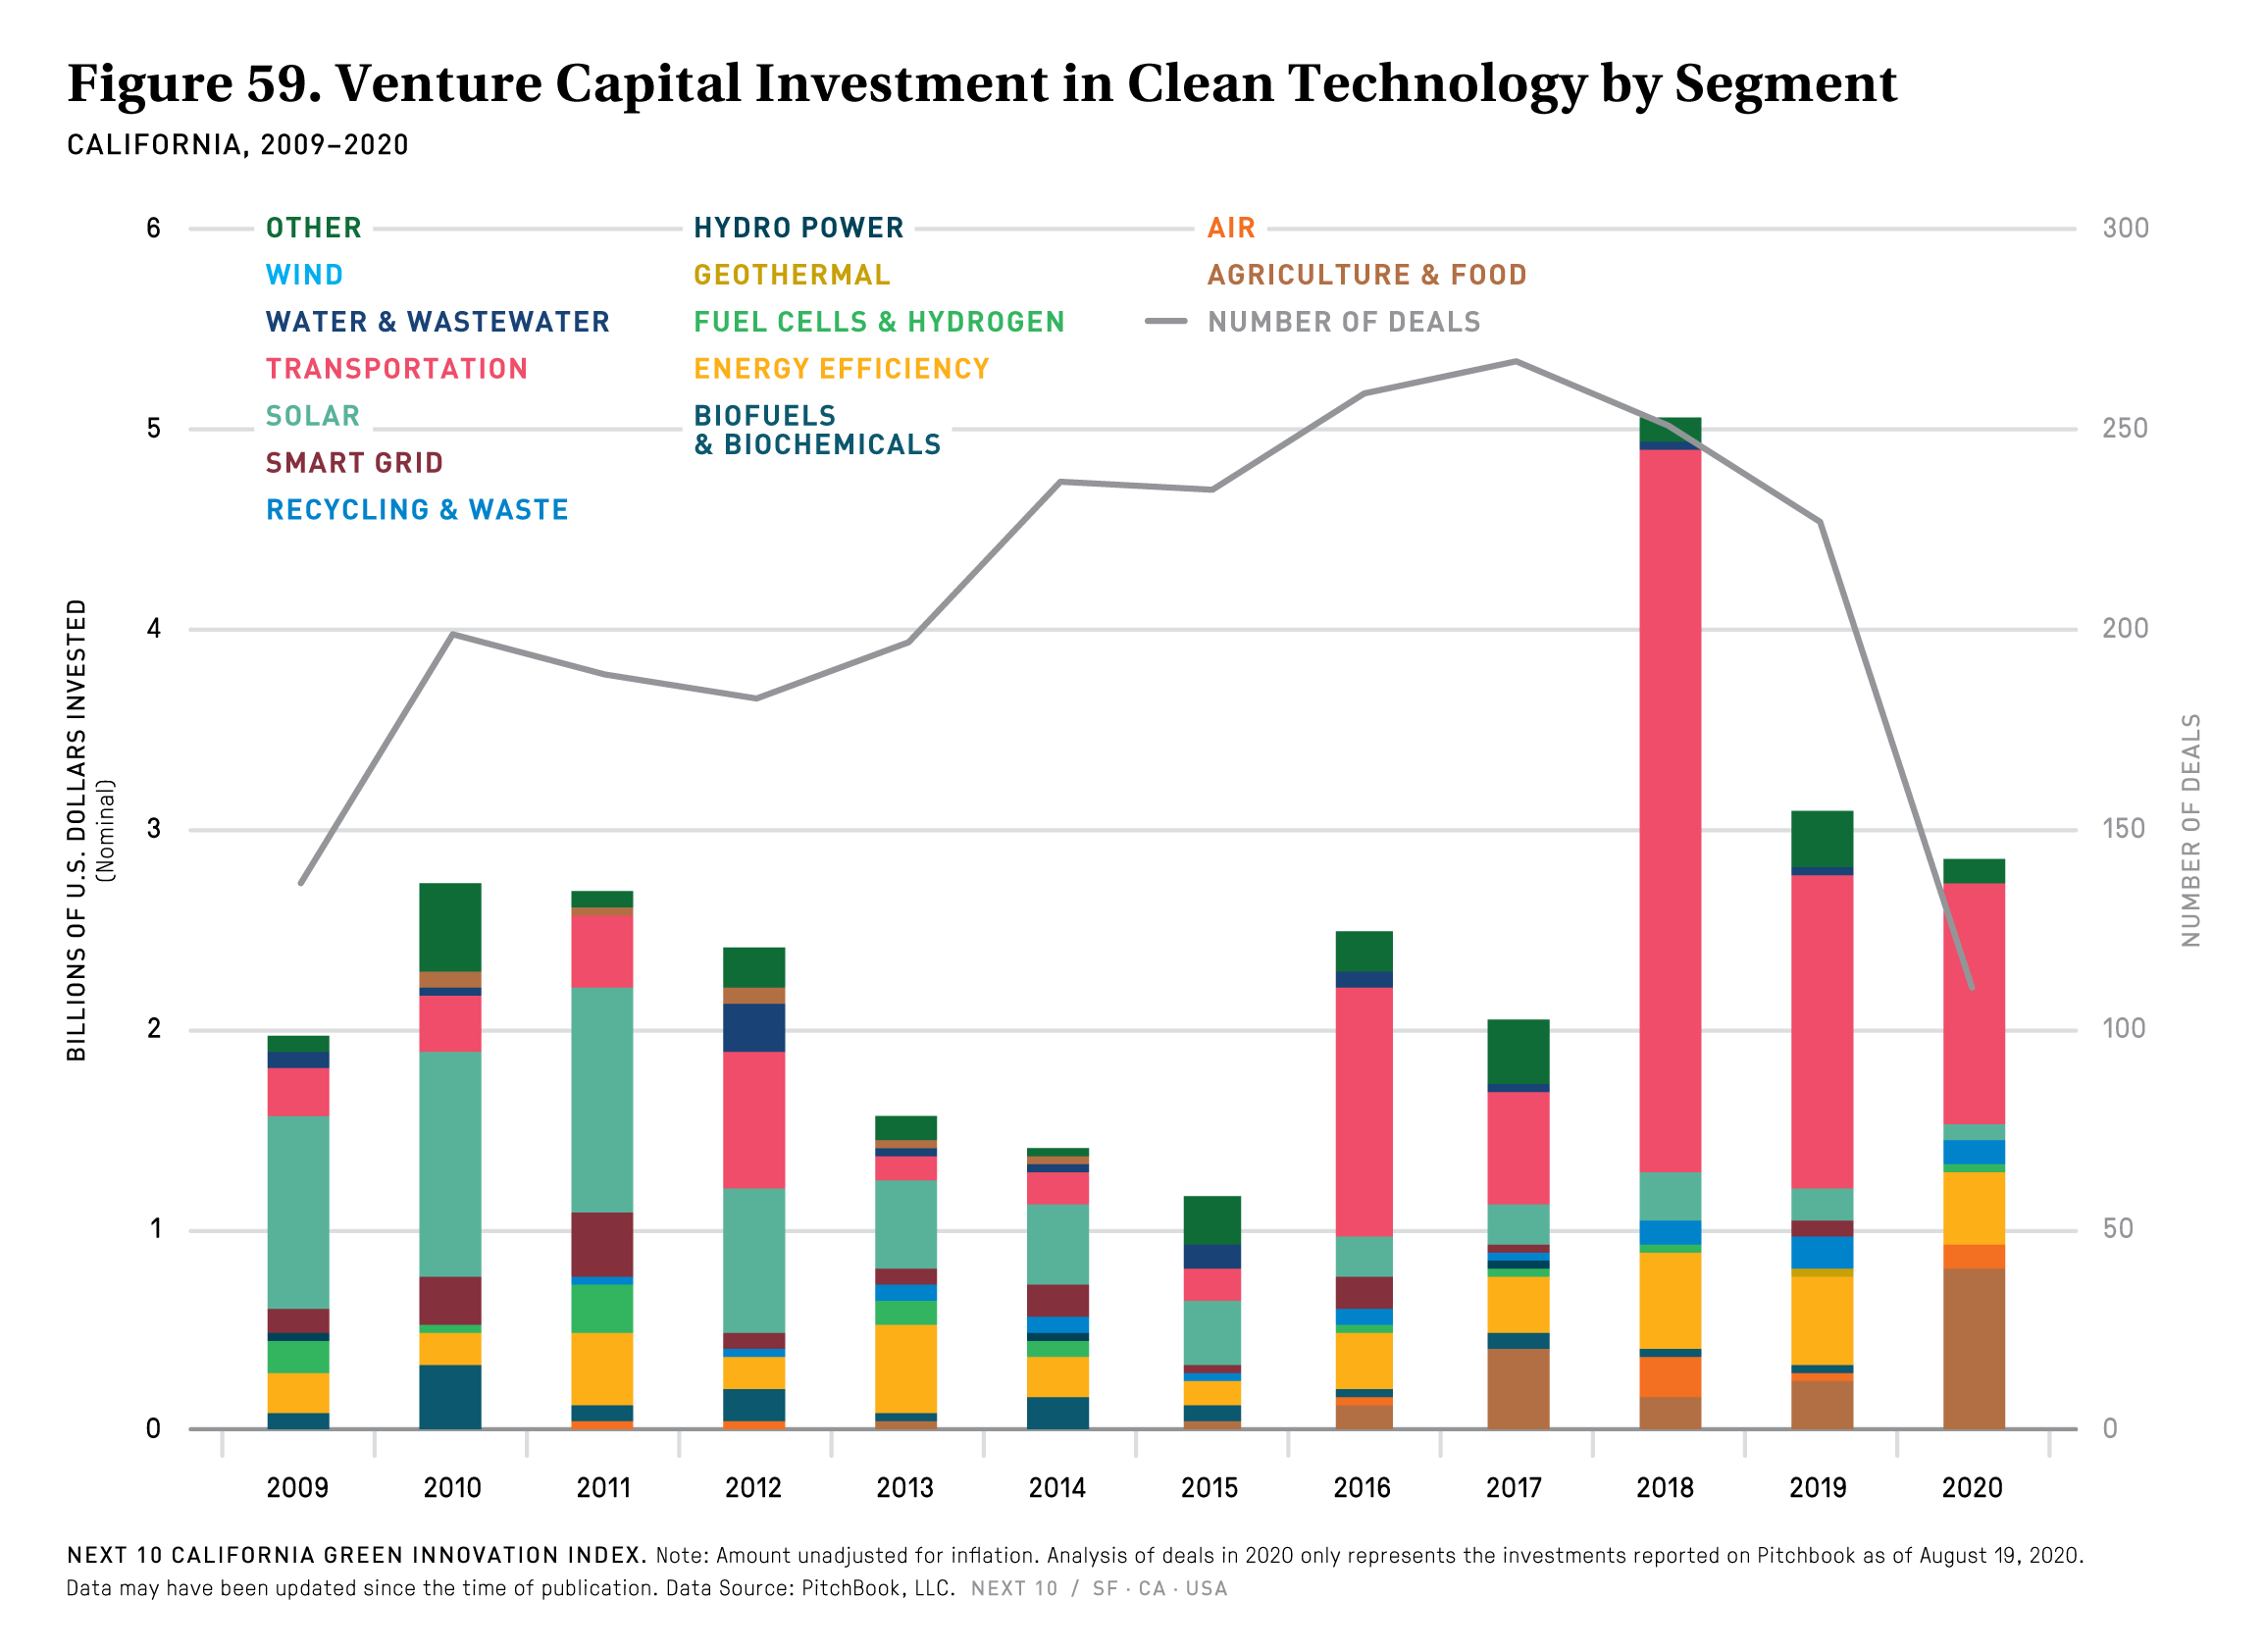
California Clean Technology Investment by Segment
- The largest increase in dollars between 2018 and 2019 invested was in Geothermal, which saw an increase from nothing in 2018 to over $11 million in 2019. This was followed by Smart Grid, which saw a 360 percent increase, and Hydropower, which saw an 81 percent increase.
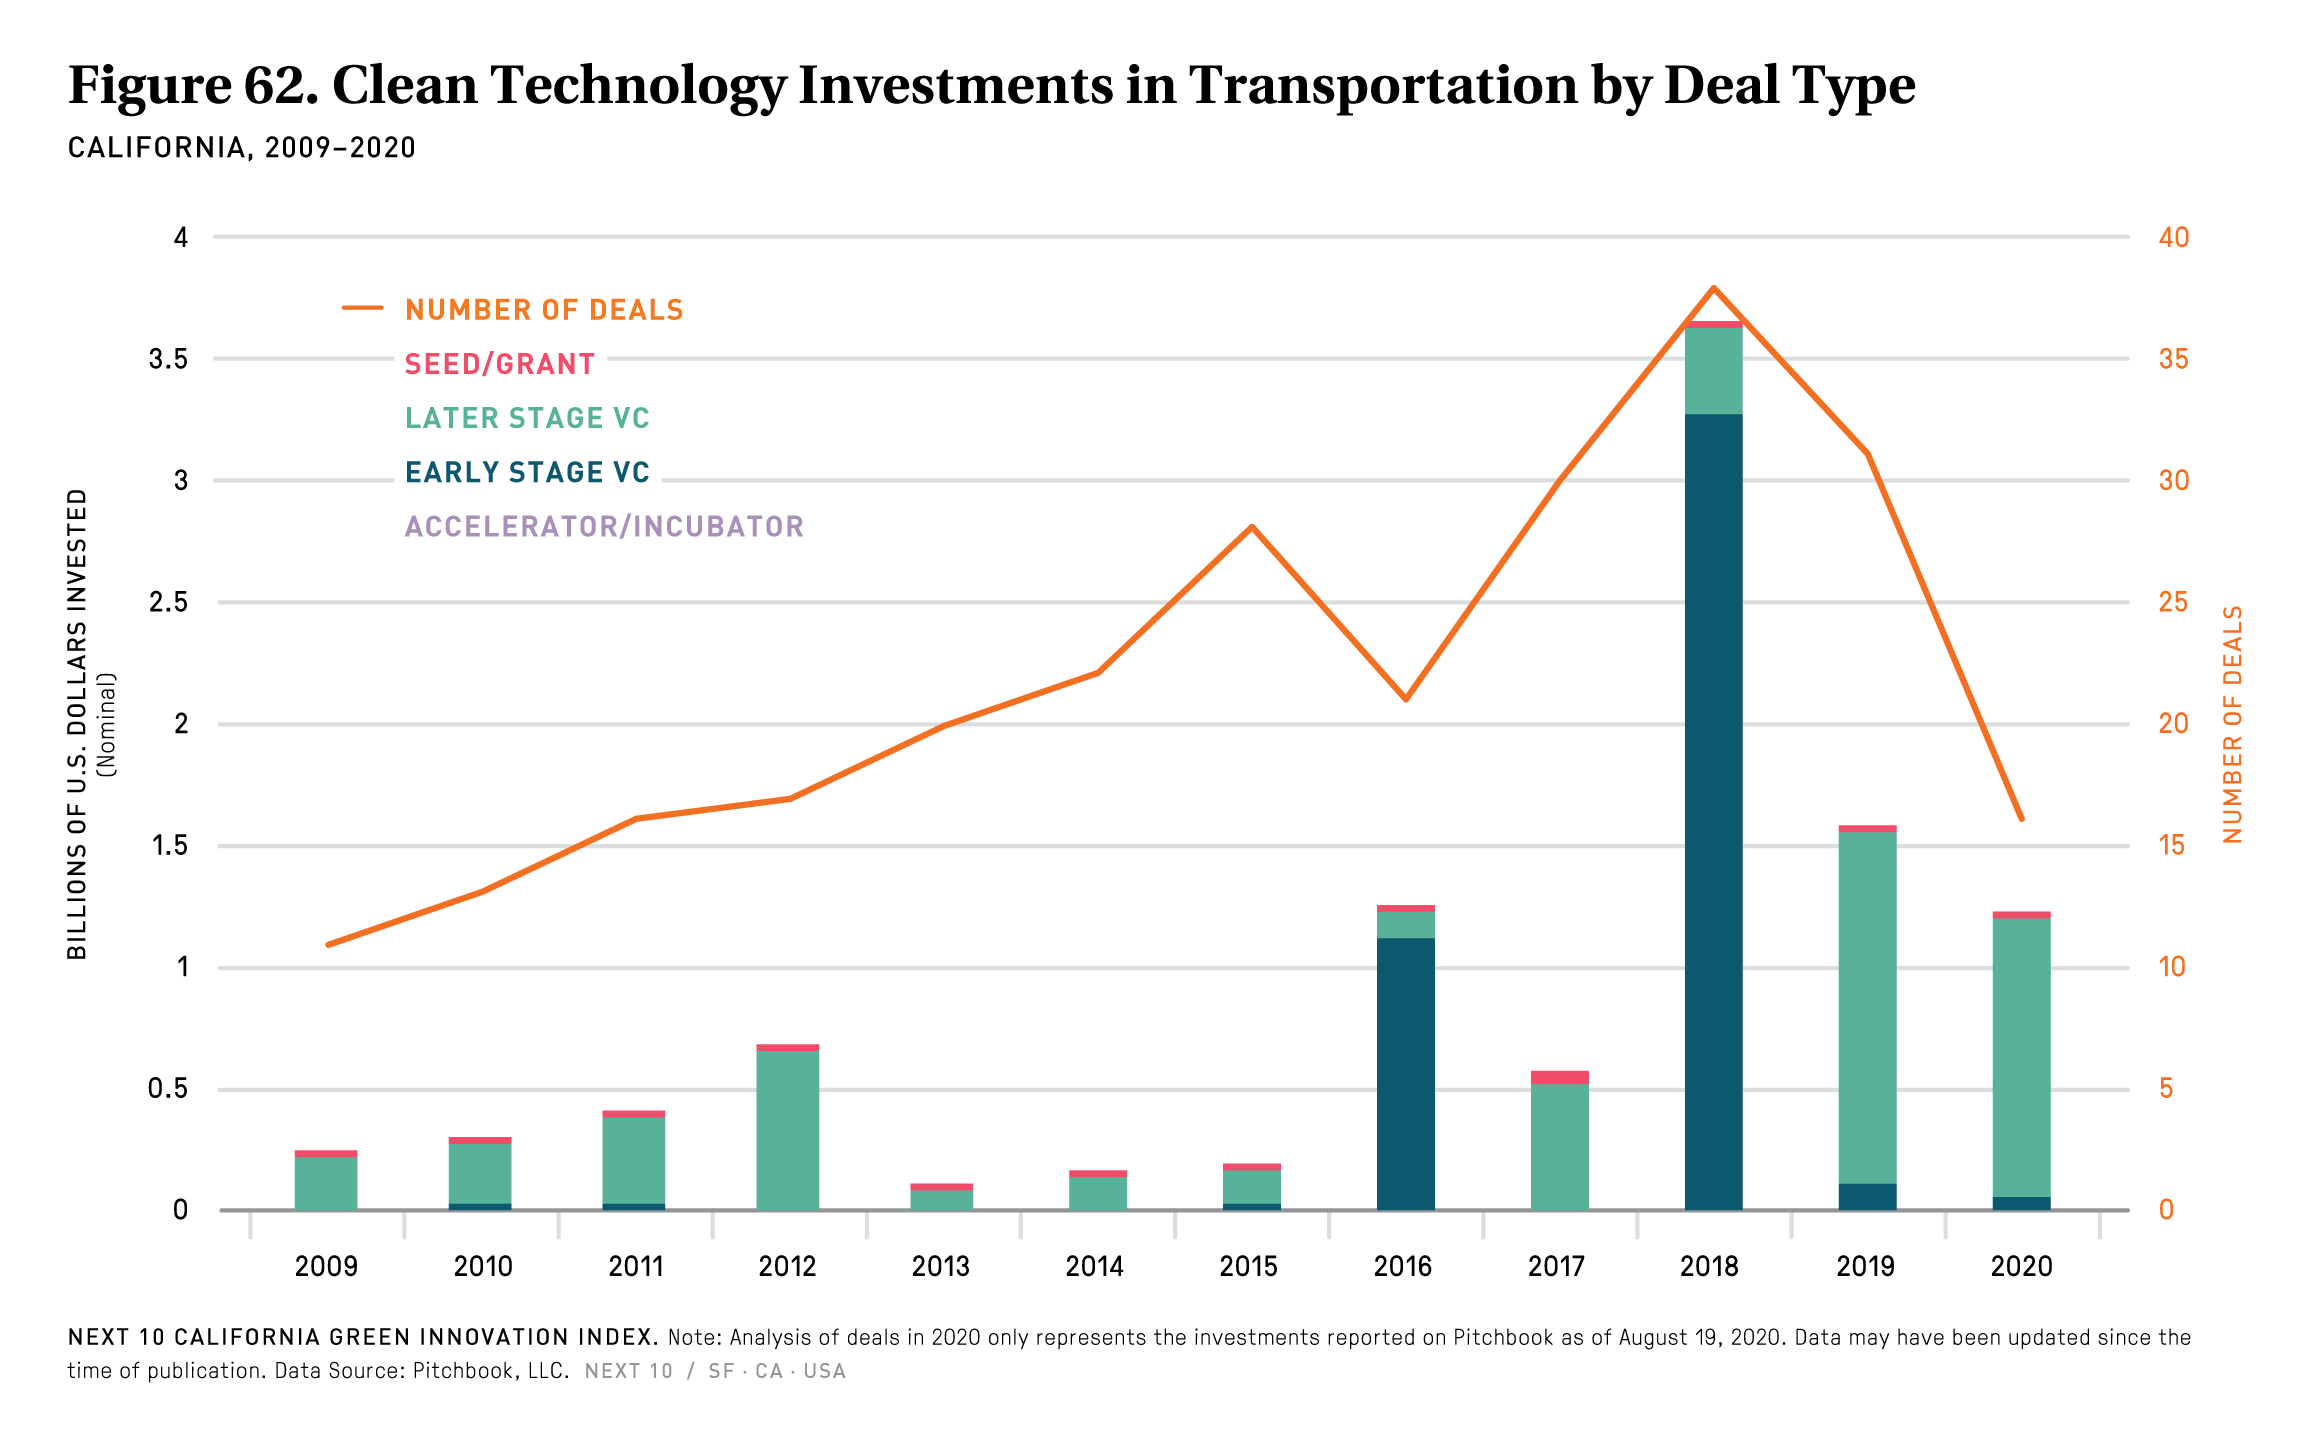
- Though two transportation companies––Faraday Future and Joey Aviation––each represent the largest clean tech deals of 2019 and 2020 respectively, there has been an overall decline in investment in companies that specialize in transportation.
- The three largest clean tech deals in 2019 were all transportation-related: Faraday Future ($1.25 billion), RomeoPower ($92 million), and Proterra ($75 million).
Next 10 owns the copyright to all graphics in this section, and they are available for download and limited use, subject to our Terms of Use. Please contact Next 10 at info@next10.org with any questions.