Publications
Clean Transportation: An Economic Assessment of More Inclusive Vehicle Electrification in California
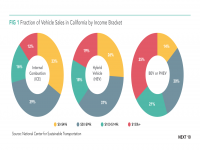
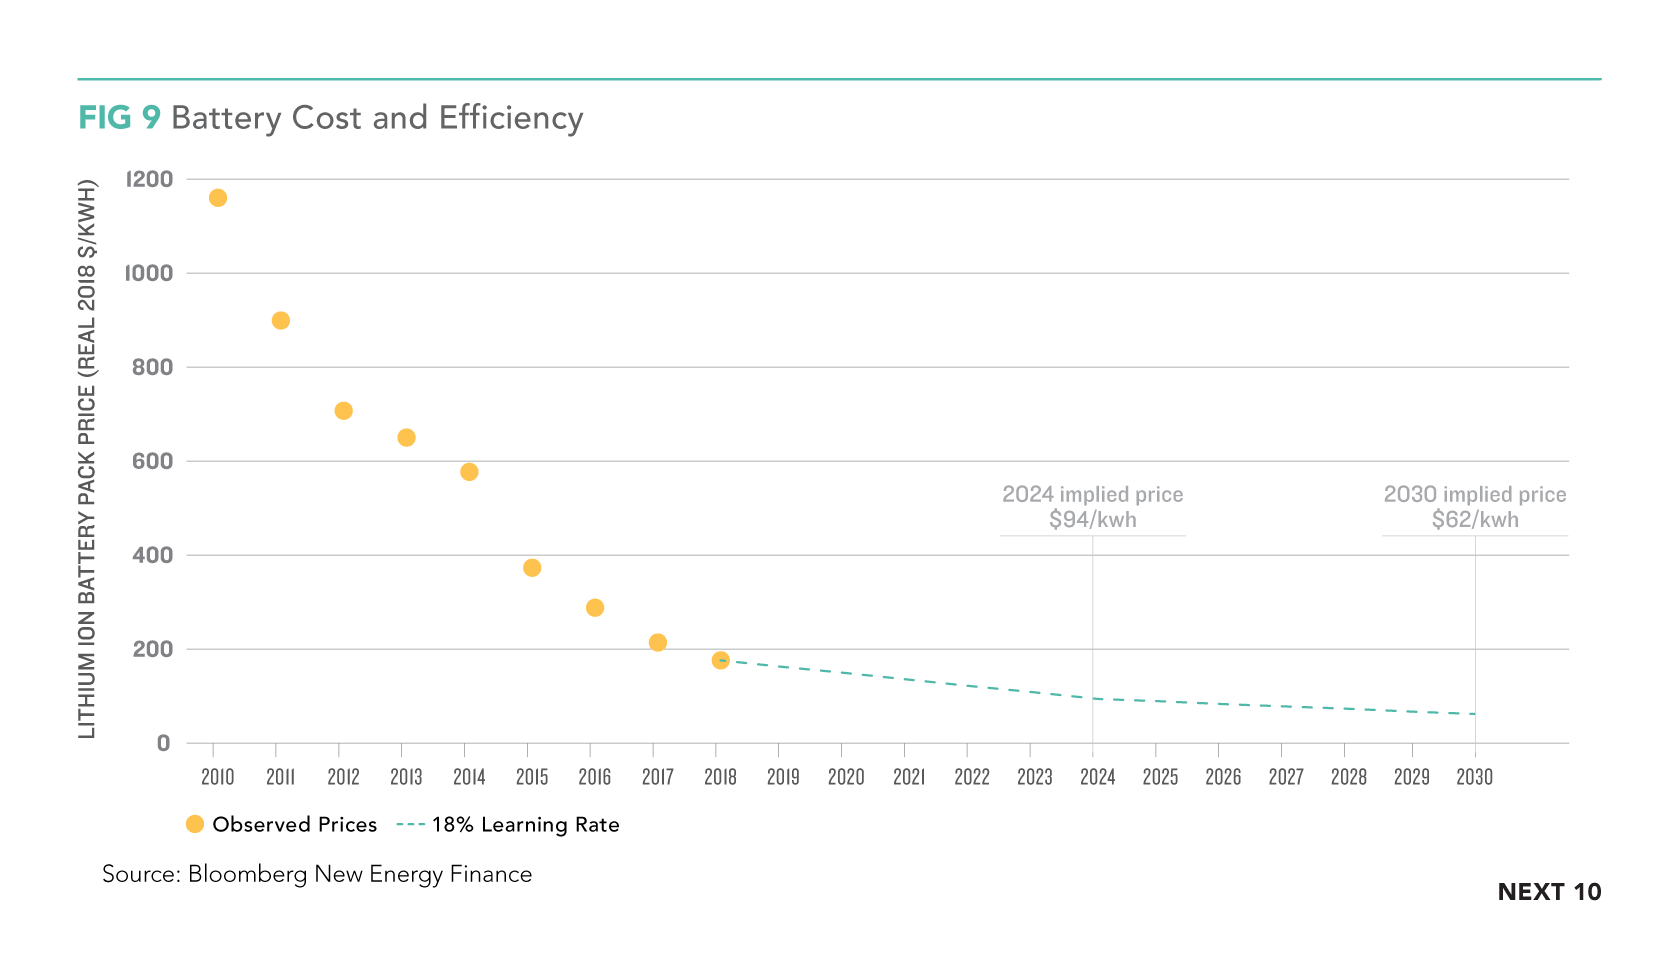
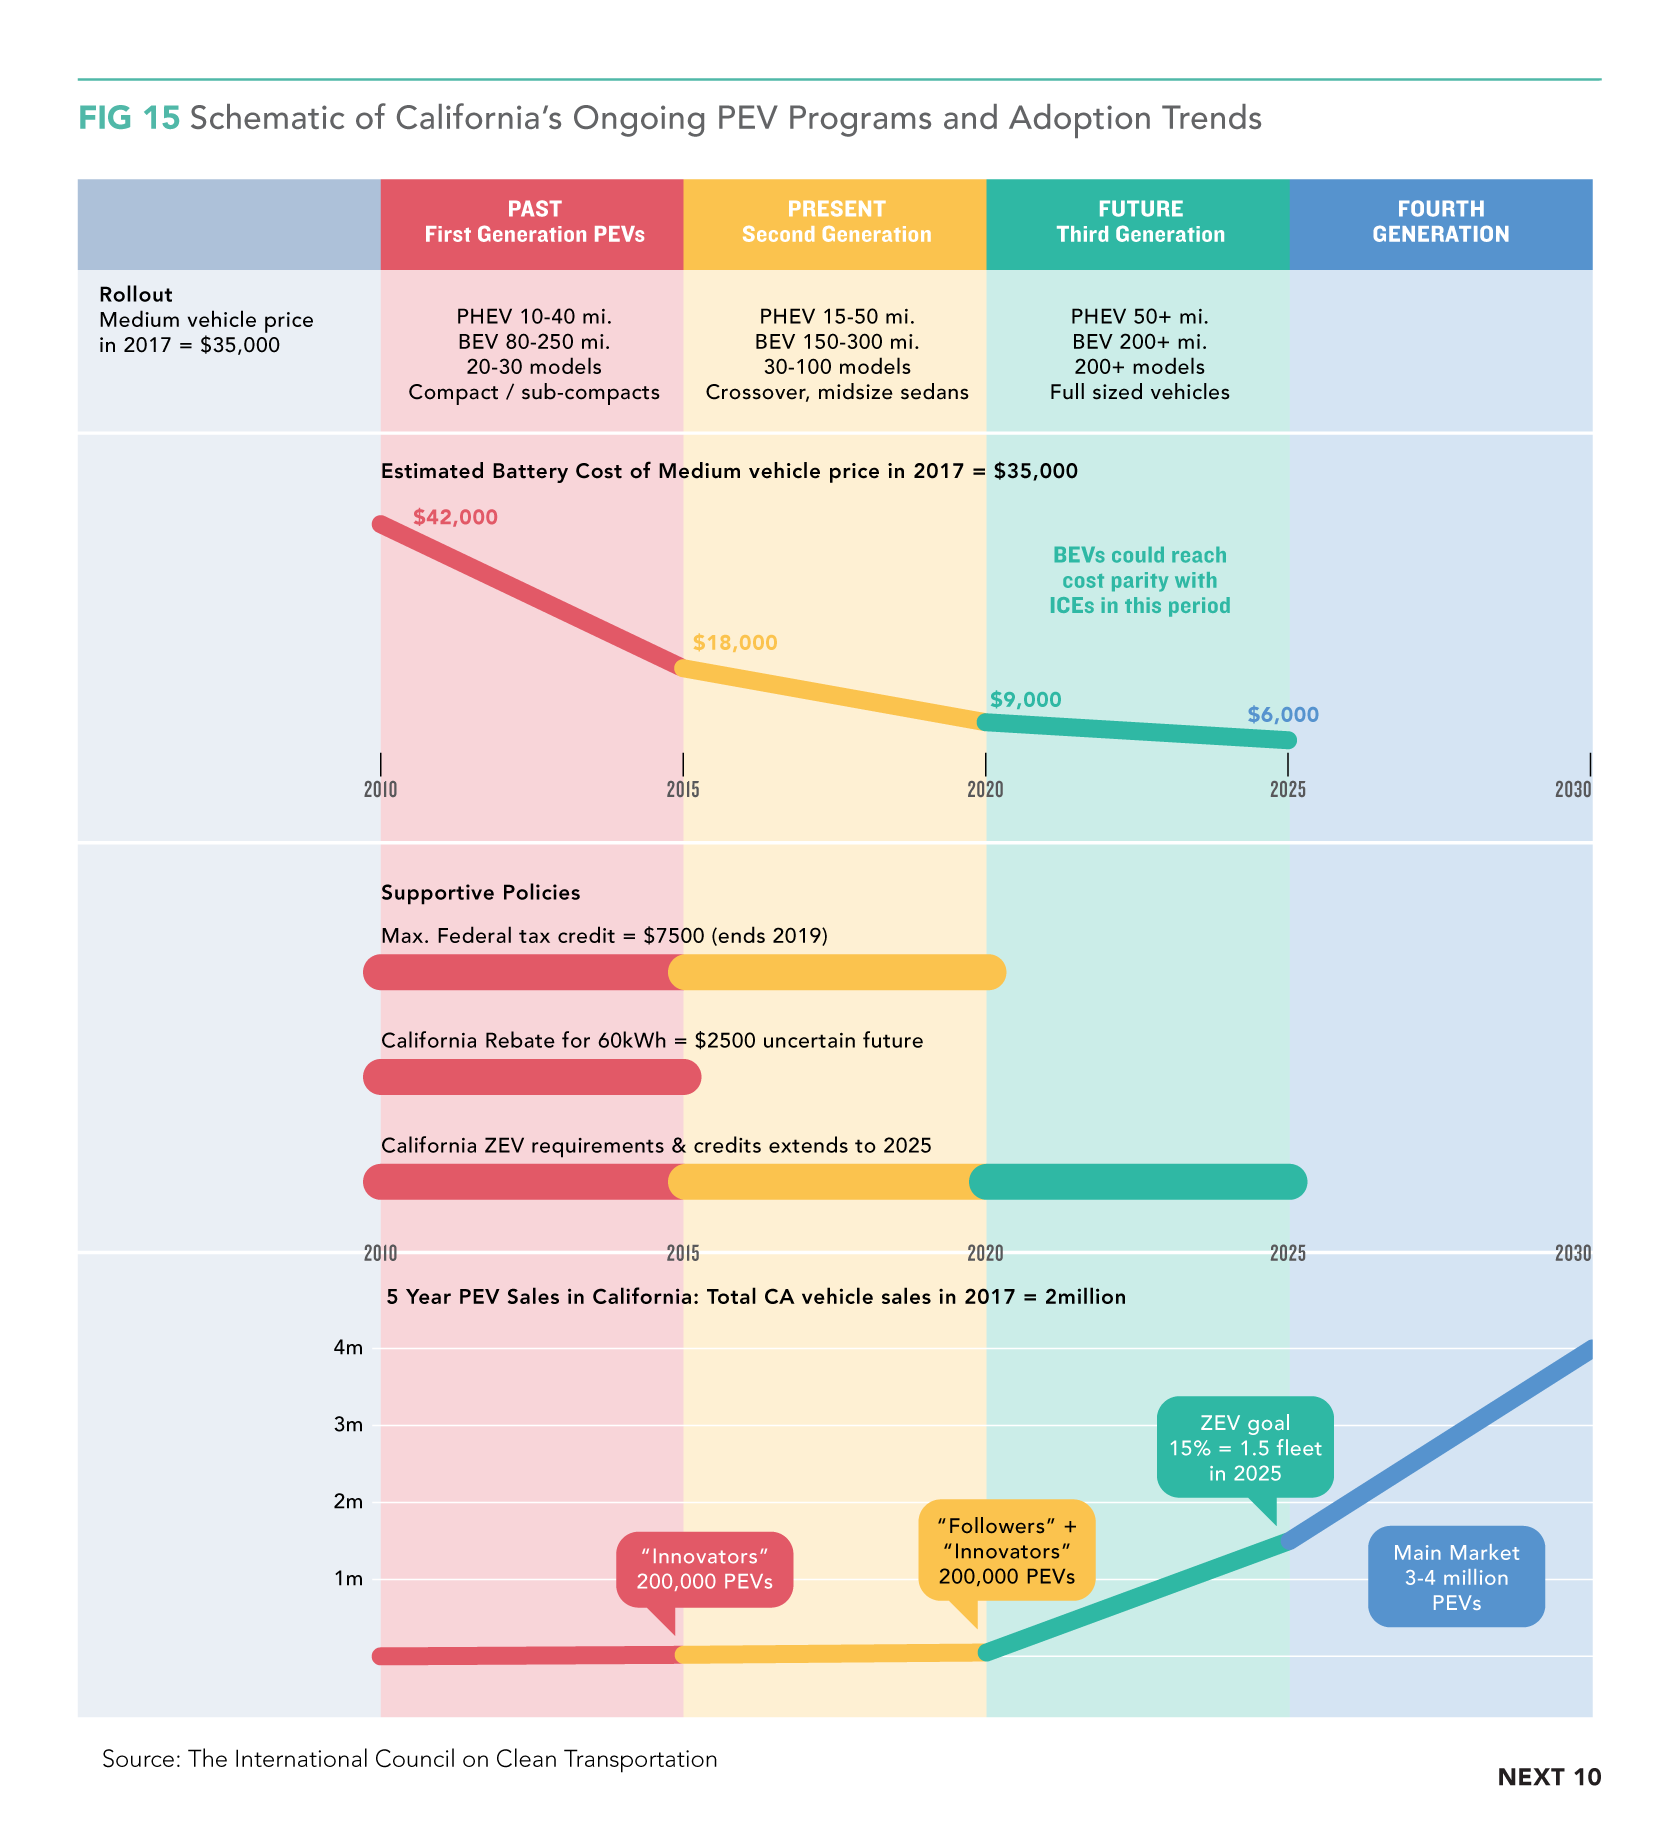
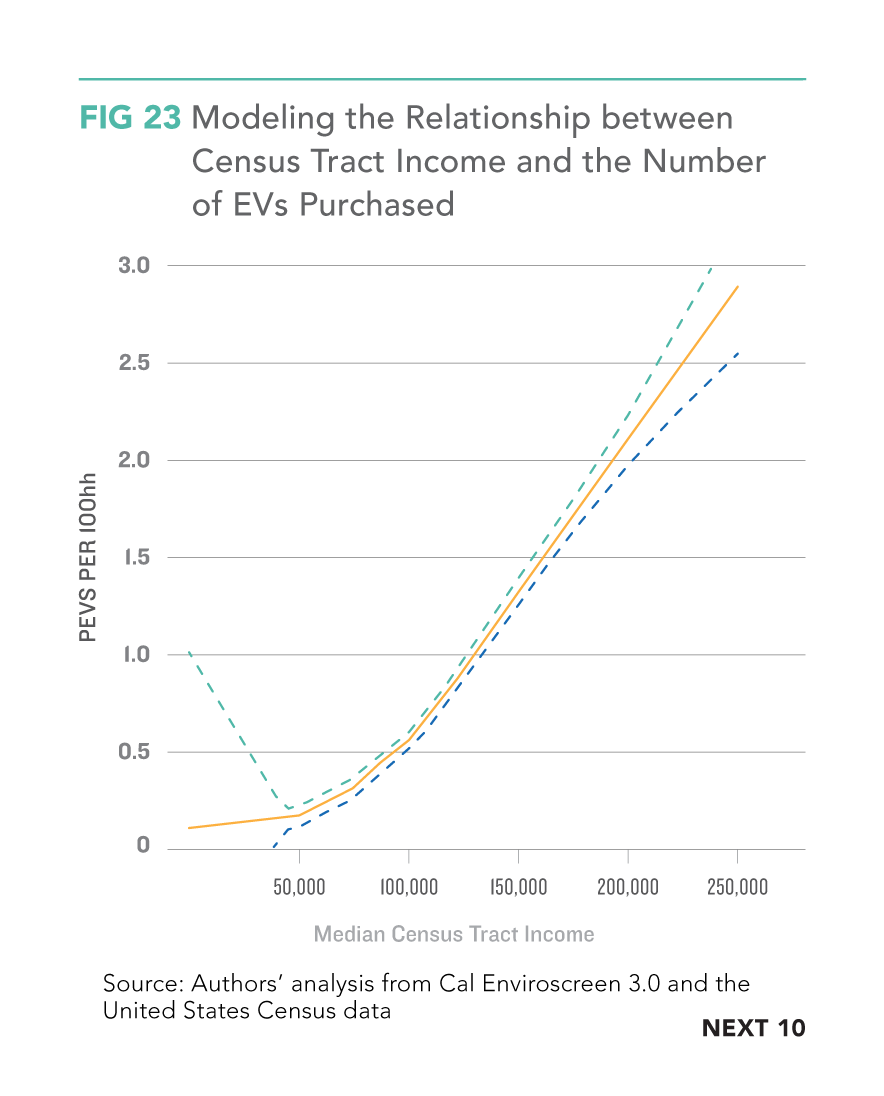
California’s transportation sector is the largest contributor of greenhouse gas emissions in the state, accounting for 41 percent of statewide emissions. Electrification of the light vehicle fleet is an essential component of the state’s ambitious plans to reduce global warming pollution. While adoption of plug-in electric vehicles (PEVs) has been relatively gradual and unequally distributed across the population, overall adoption is likely to accelerate as prices continue to drop, technology continues to improve, and more mass market vehicles become competitive. To promote more inclusive access to these innovative vehicle technologies, the state is considering more targeted incentives.
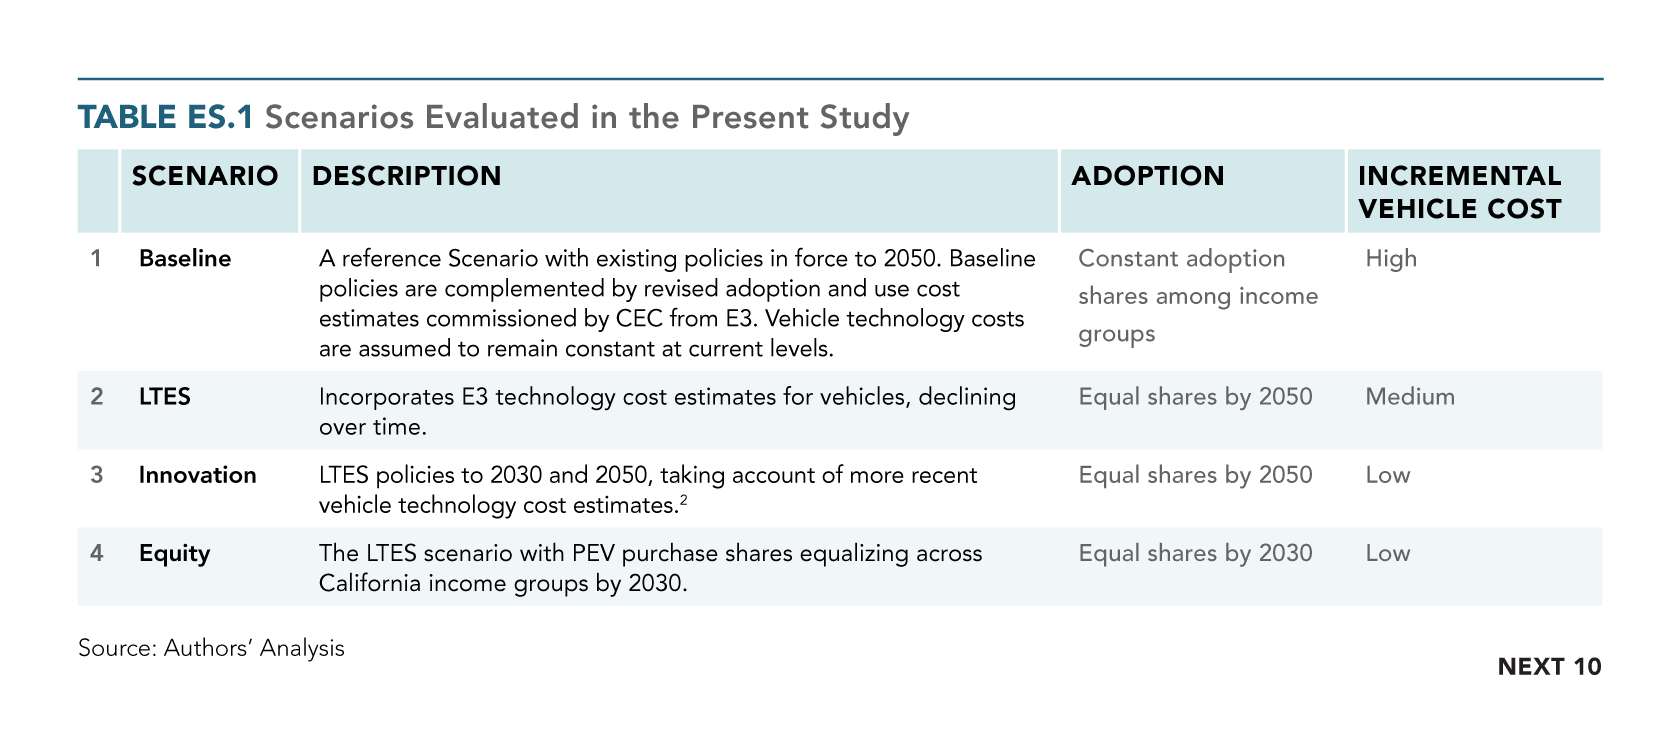
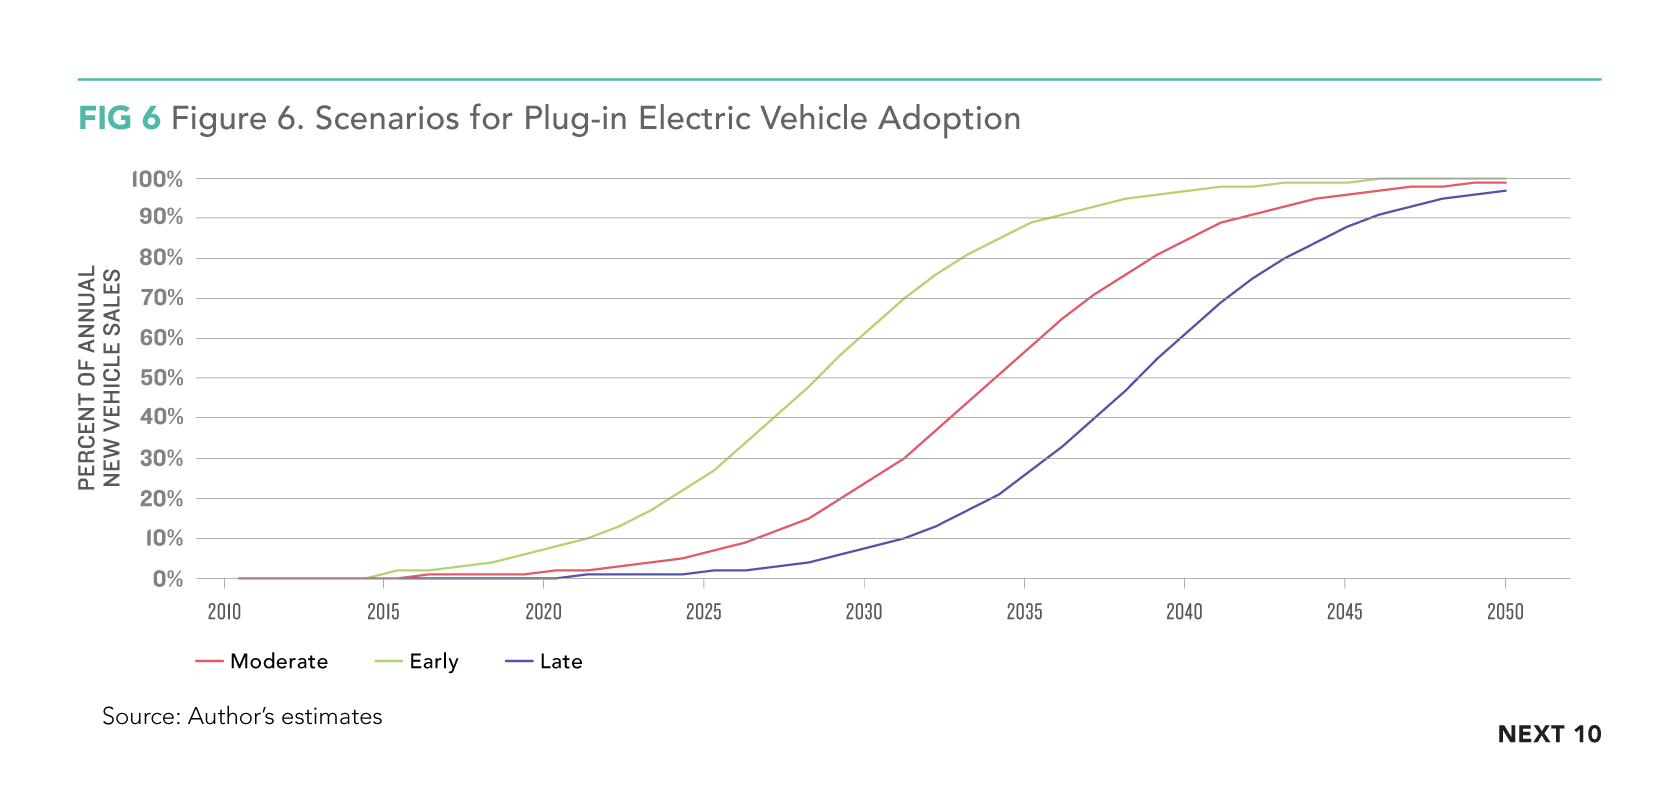
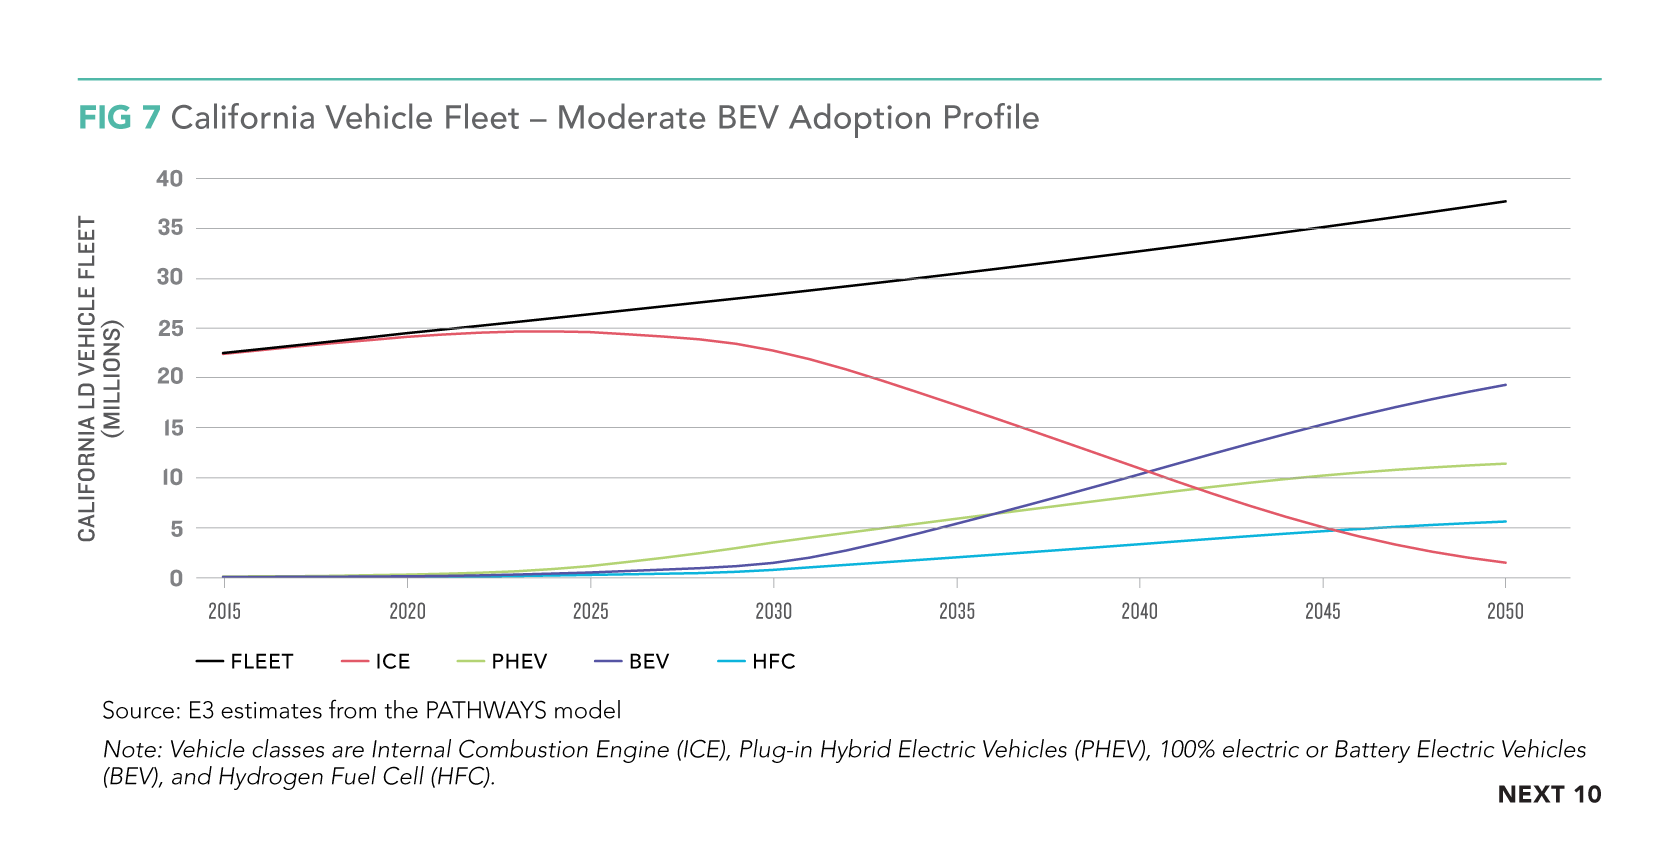
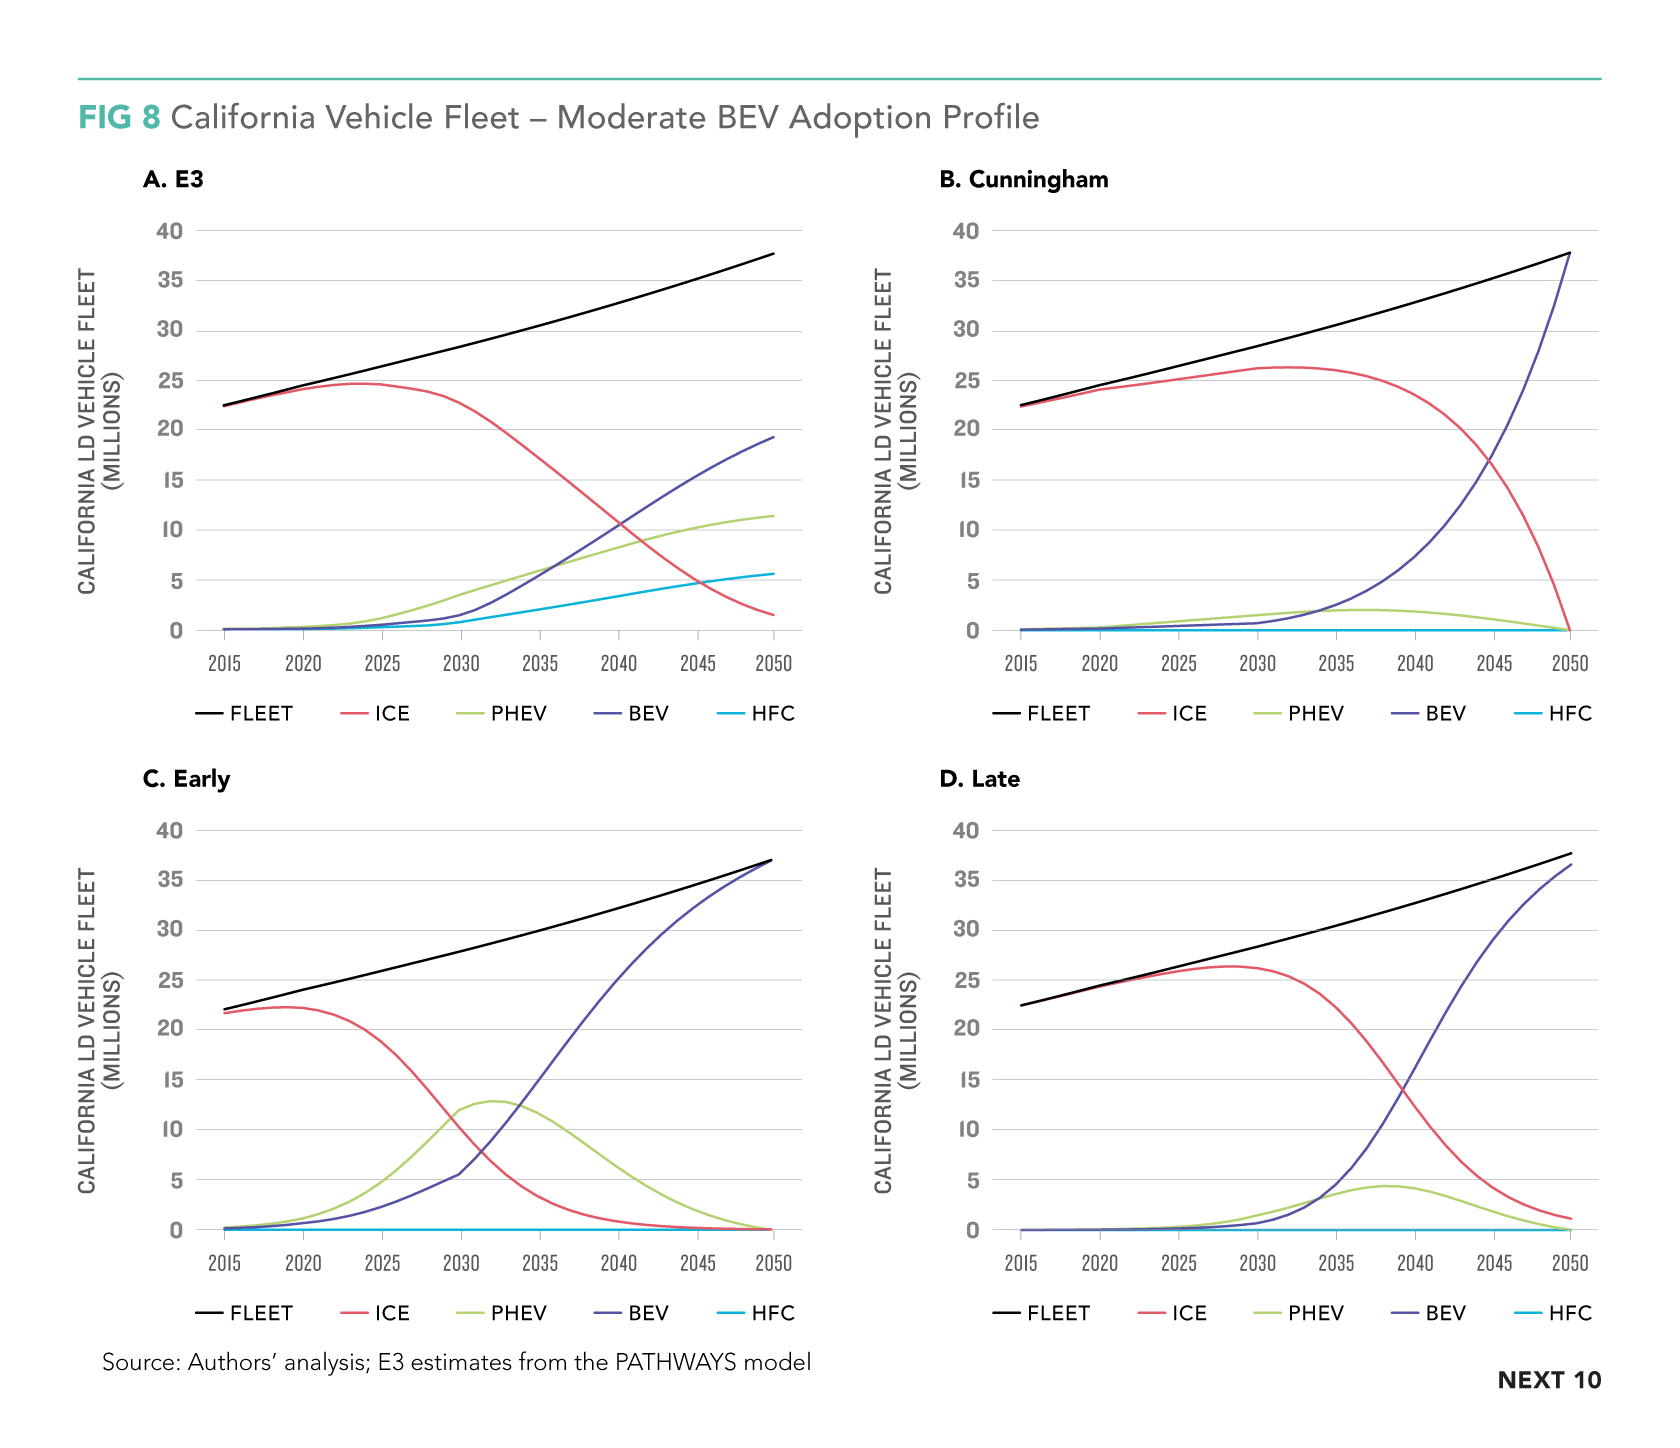
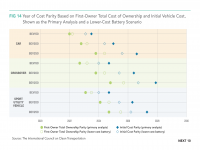
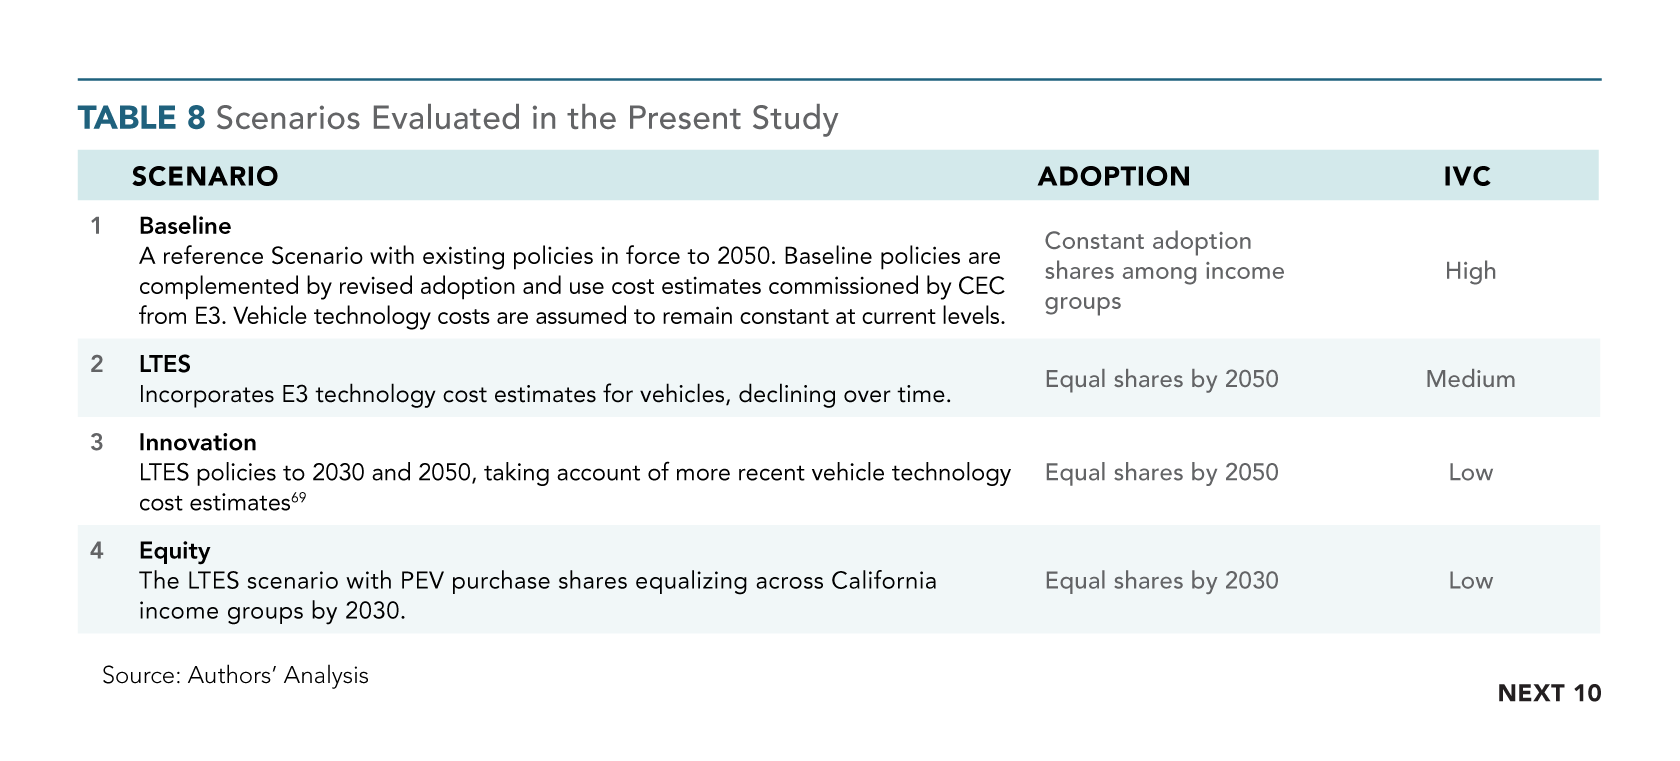
To help elucidate some of the potential impacts and benefits of broader PEV adoption, Clean Transportation: An Economic Assessment of More Inclusive Vehicle Electrification in California, prepared by Berkeley Economic Advising and Research, assesses the economic implications of the projected increase in electric vehicle use with a long-term economic forecasting model. Californians spend about $60 billion on gasoline each year—most of which goes to out-of-state or out-of-country companies. By transitioning to more electric vehicles powered by clean energy, consumers save money and spend those savings in the economy, multiplying the benefit economy-wide to provide a significant boost to service industry spending. To illustrate the economic consequences of different pathways for large-scale vehicle electrification, this report analyzed four different scenarios that assumed different adoption patterns and vehicle costs—using the latest data available to forecast results out to 2050.
The report found that vehicle electrification under the scenario with relatively more conservative cost assumptions would confer significant economic benefits by both 2030 and 2050—resulting in increases to Gross State Product (GSP), employment, real household incomes, and state revenue. These results indicate that wider and more rapid PEV adoption will benefit most Californians—whether they buy a PEV or not—by stimulating the overall economy and reducing harmful criteria pollution. The report also finds that promoting PEV adoption in lower-income communities improves both economic and health benefits to them without significantly reducing benefits to others.
Next 10 is not the sole owner of rights to this publication. Usage of this content is subject to permissions, please contact us at info@next10.org for more information.


Key Findings:
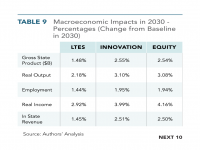
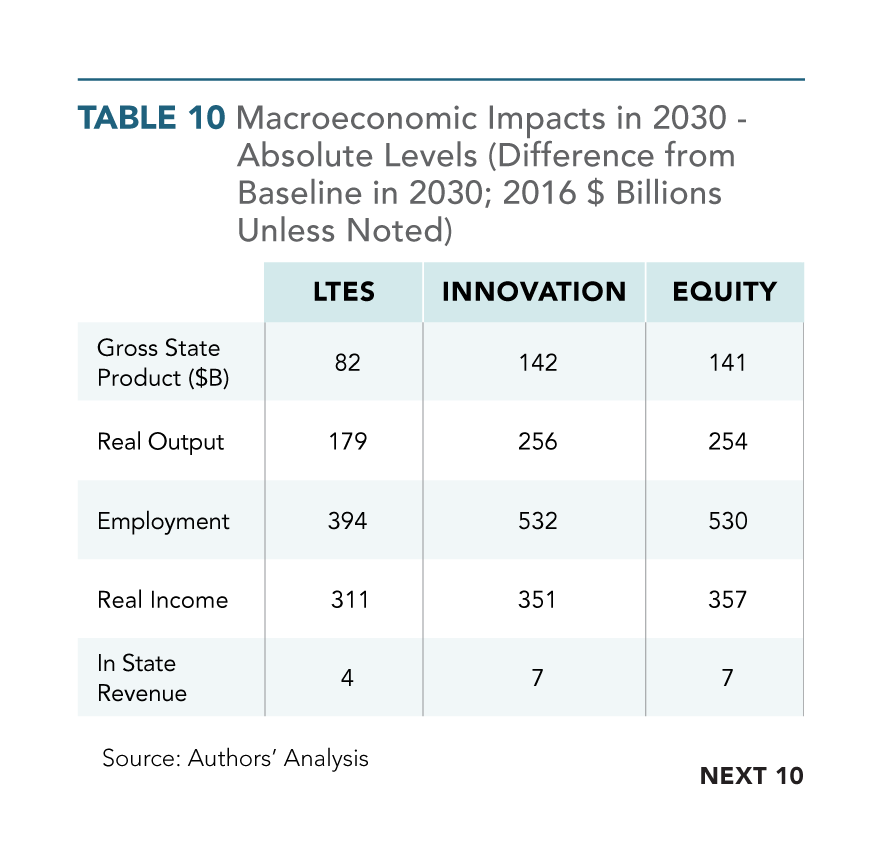
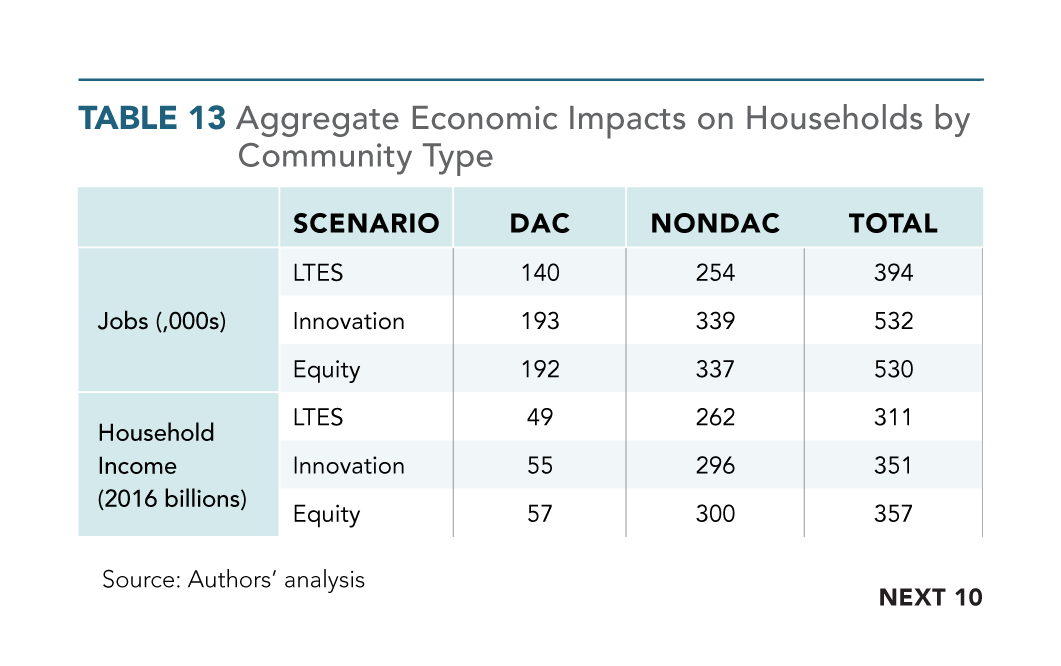
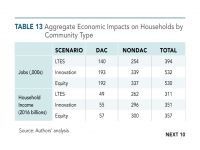
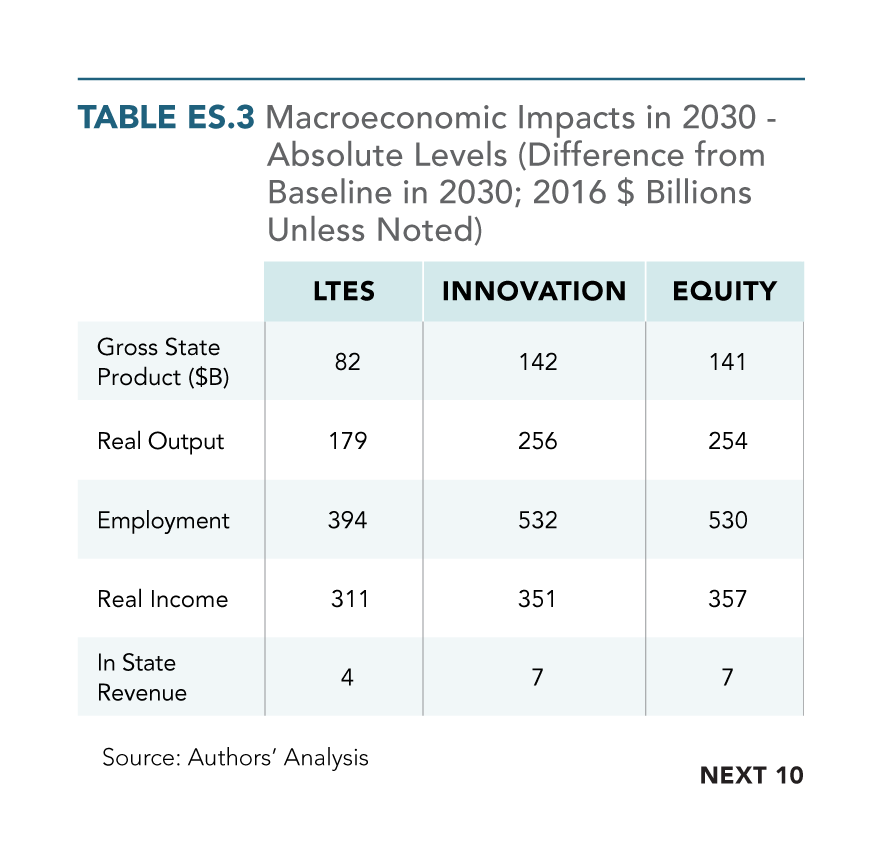
- Successfully hitting California’s 2030 GHG reduction goals with the scale of increased EV adoption modeled in this study would create more than 390,000 new jobs under a relatively conservative scenario—and more than half a million new jobs in the scenarios that account for steeper declining costs and increasing model choices.
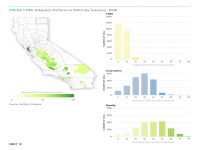
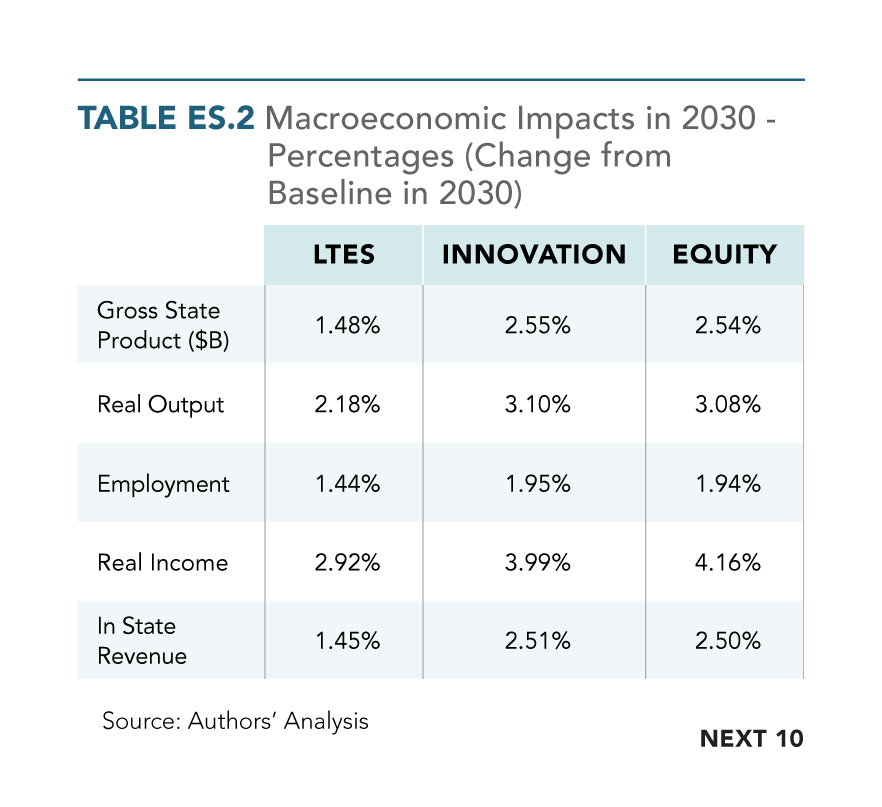
- By 2030, California's Gross State Product (GSP) would increase between $82 billion and $142 billion, depending on the scenario.
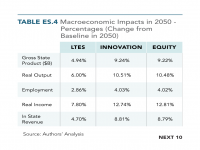
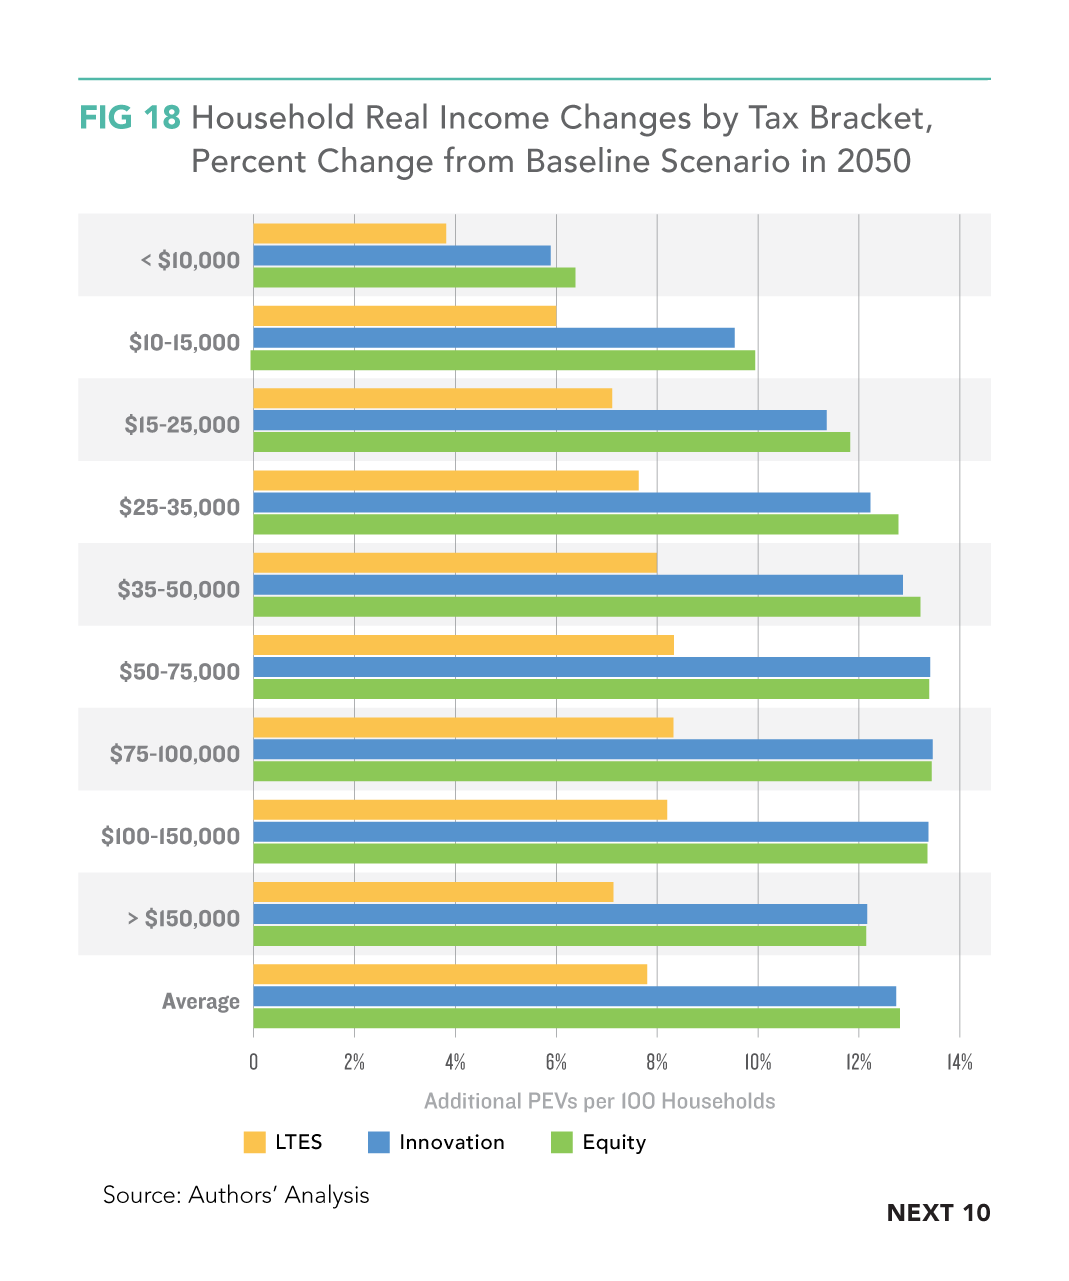
- Real Income (income adjusted for inflation) is projected to increase substantially—ranging between $311 billion to $357 billion in 2030, depending on the scenario.
- The overall economic expansion has significant fiscal benefits—generating billions in additional revenue per year from existing tax instruments.
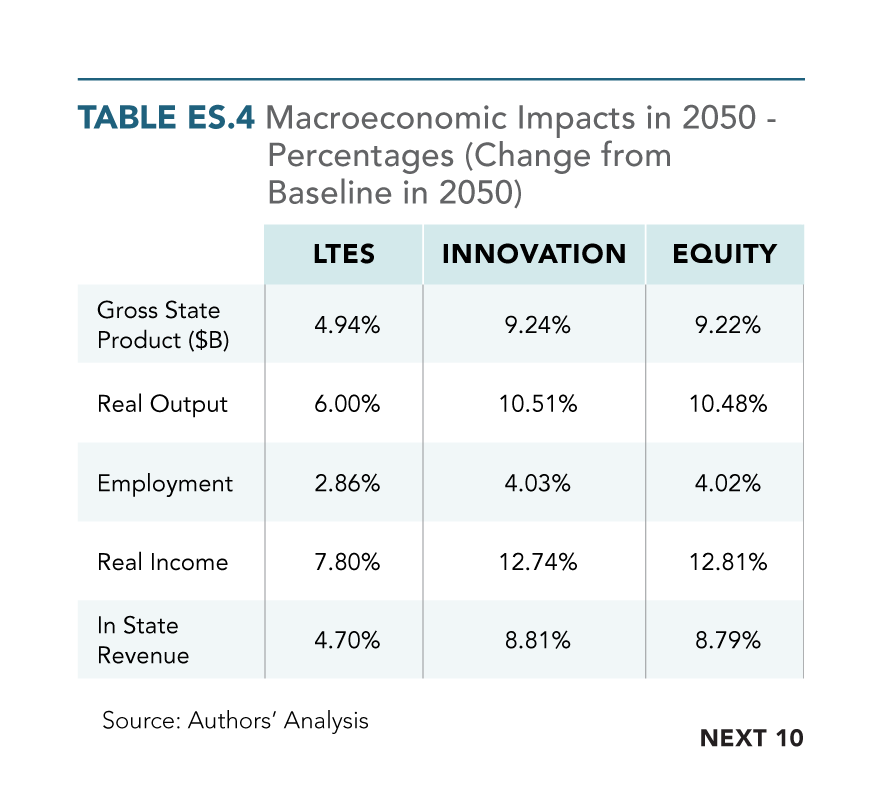
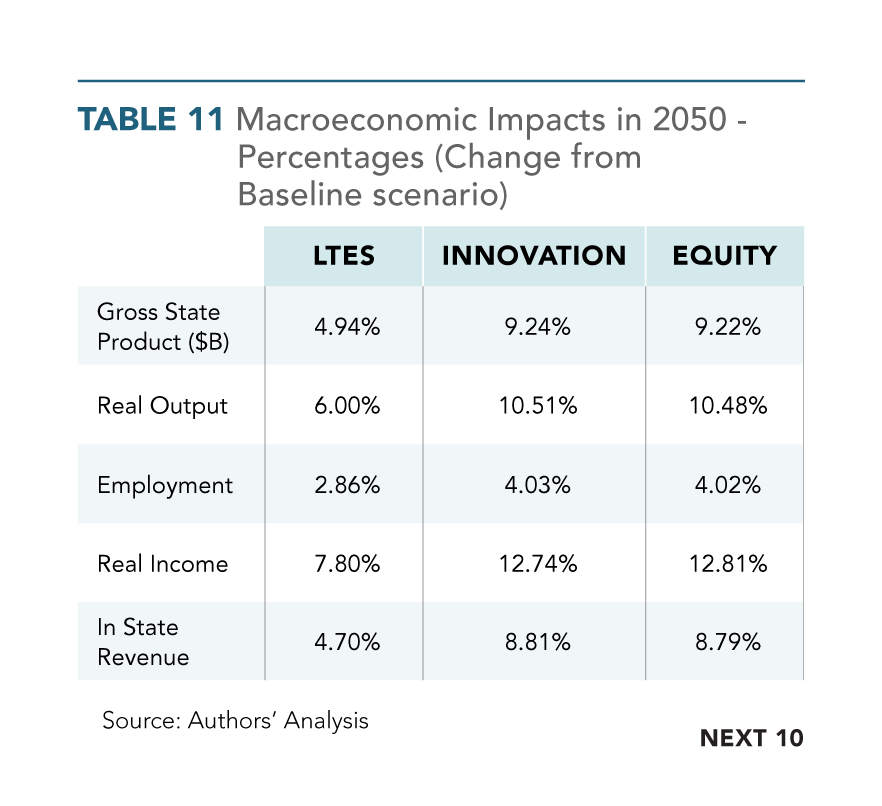
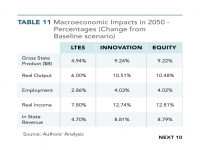
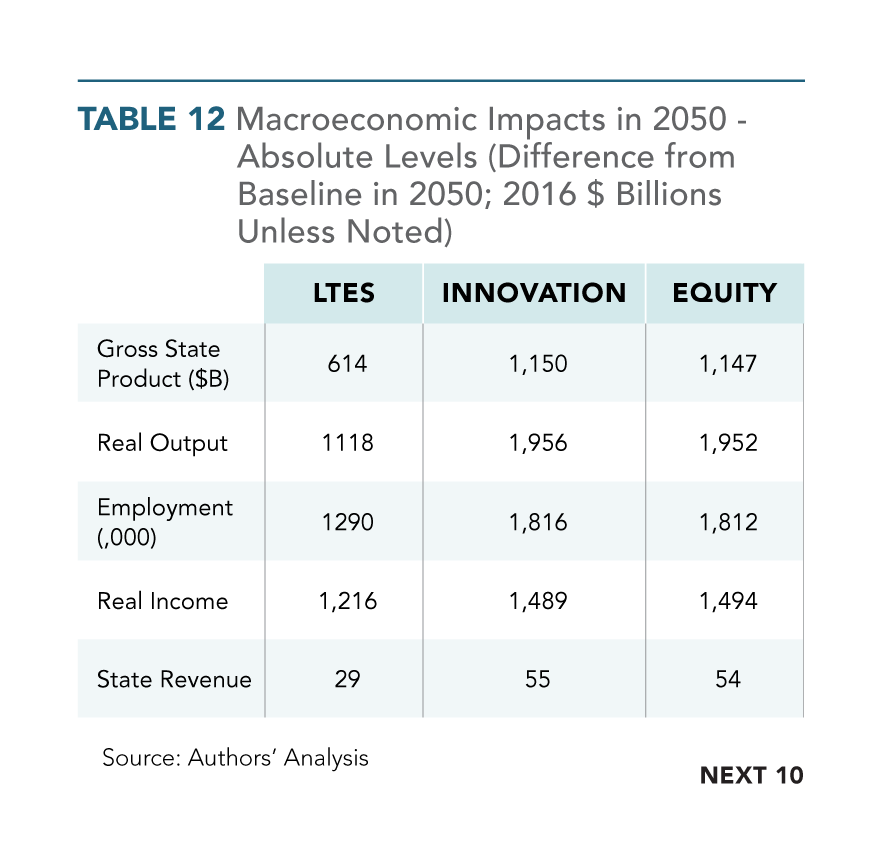
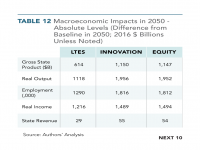
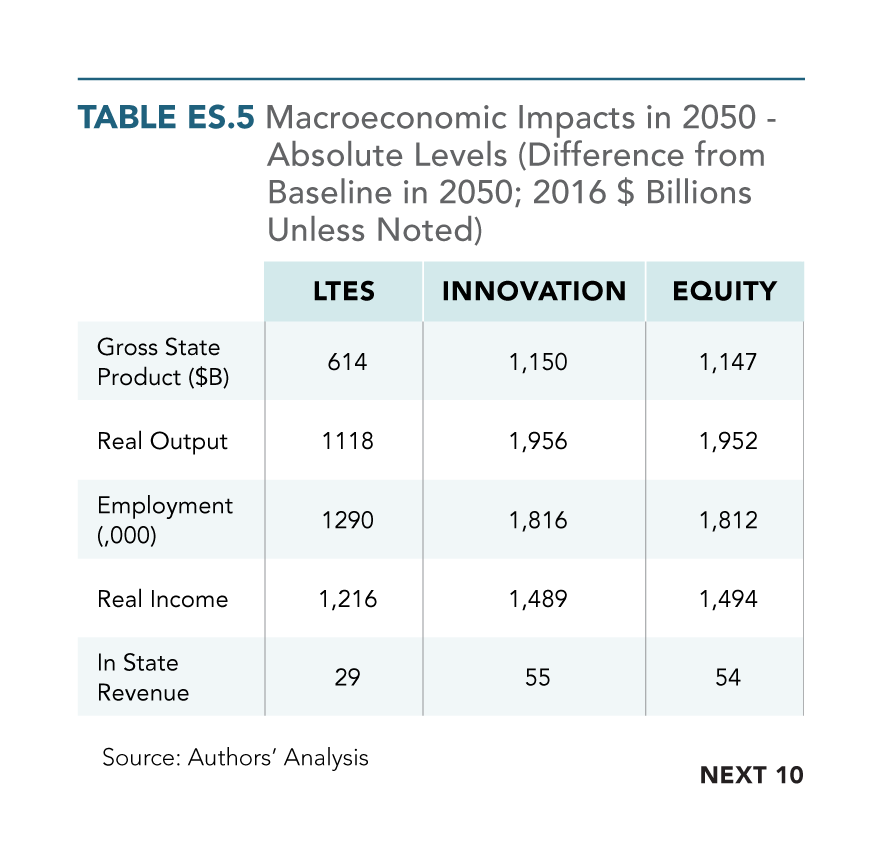
- Looking out to 2050, the economic benefits increase by seven to eight times over those in 2030, depending on the scenario, as the growth dividends from more efficient mobility are amplified.
- Even under a relatively conservative estimate, California’s GSP stands to increase by about five percent by 2050.
- Under scenarios that reflect more likely vehicle cost reductions—the gains are almost twice as large.
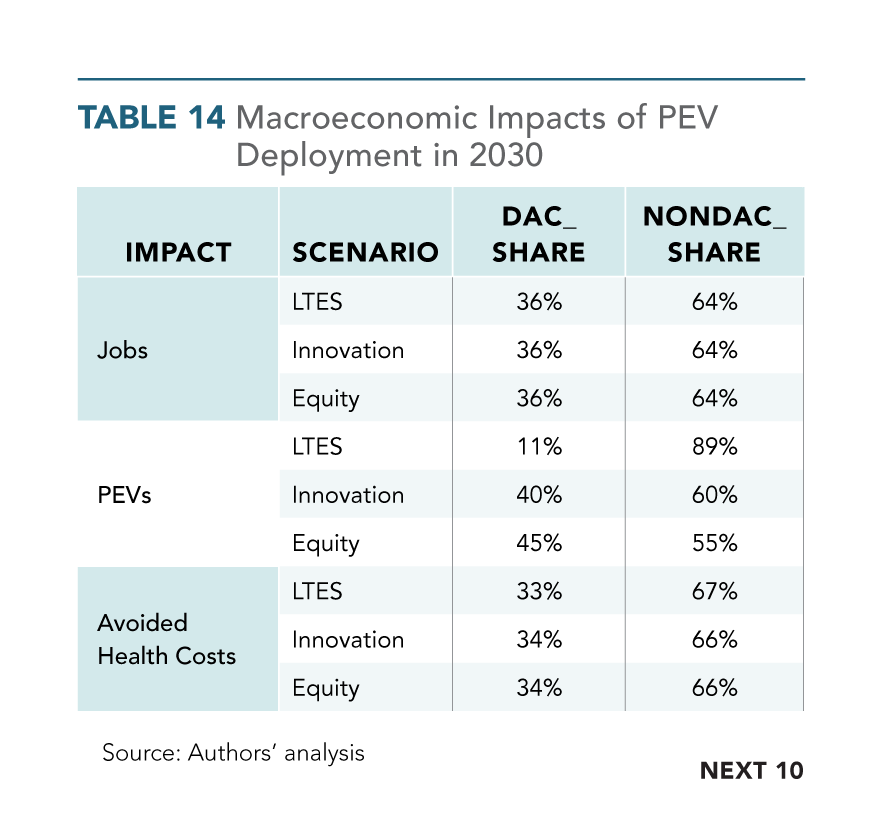
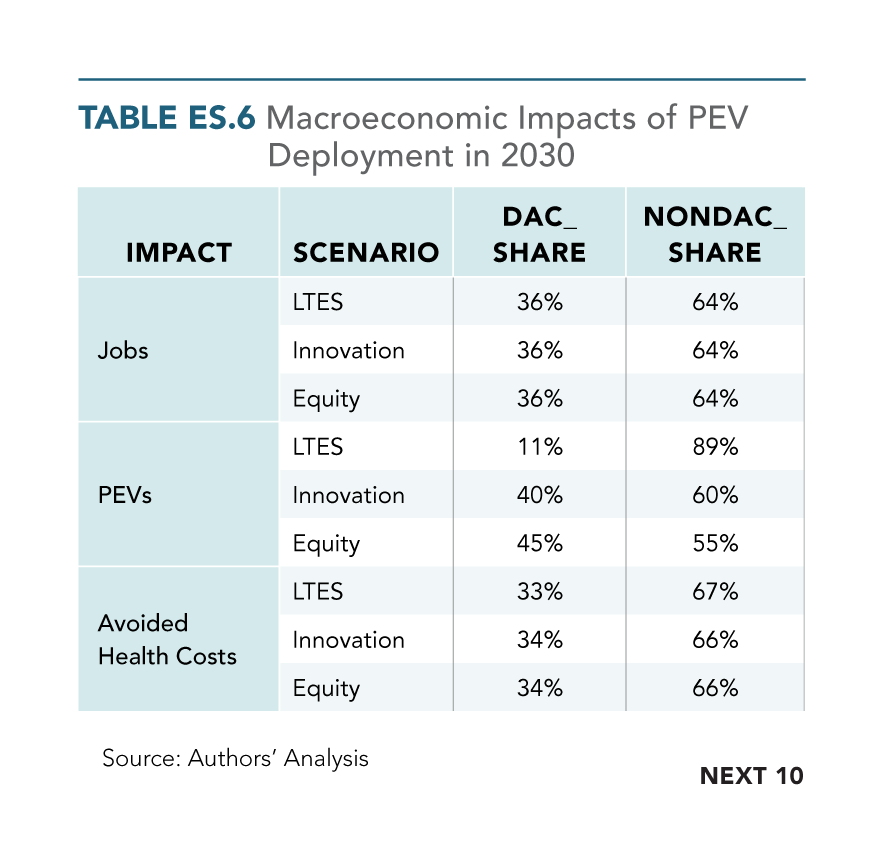
- By 2050, the Innovation scenario—which assumes greater cost savings through improved technology costs—creates 1.182 million additional jobs across the state, with more than 36 percent benefiting DAC households.
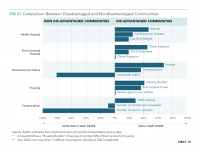
- Employment and income benefits are proportionately higher among Disadvantaged Communities (DACs)—even though they represent only 25 percent of the state’s population.
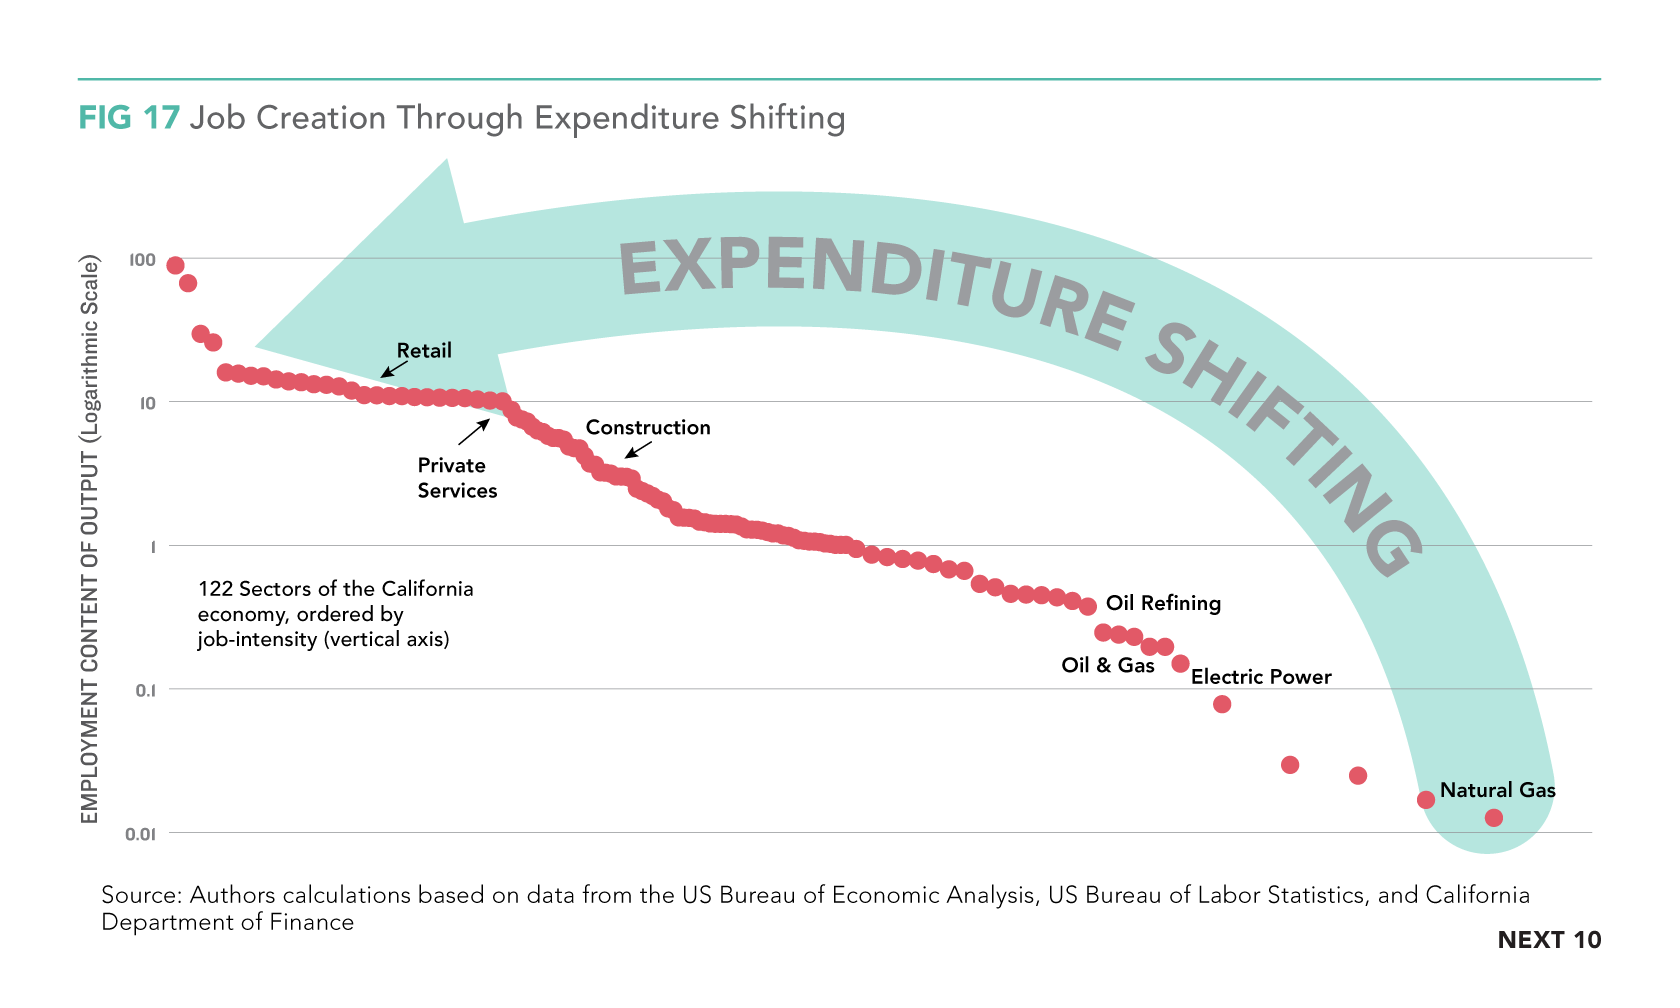
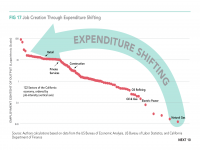
- This is because the dollars spent from fuel savings will go primarily to goods and services industries—sectors that disproportionately employ DAC workers.
- All Californians gain from increased economic growth associated with fuel cost savings due to vehicle electrification—whether they buy a new car or not.
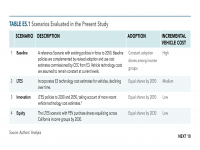
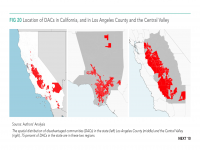
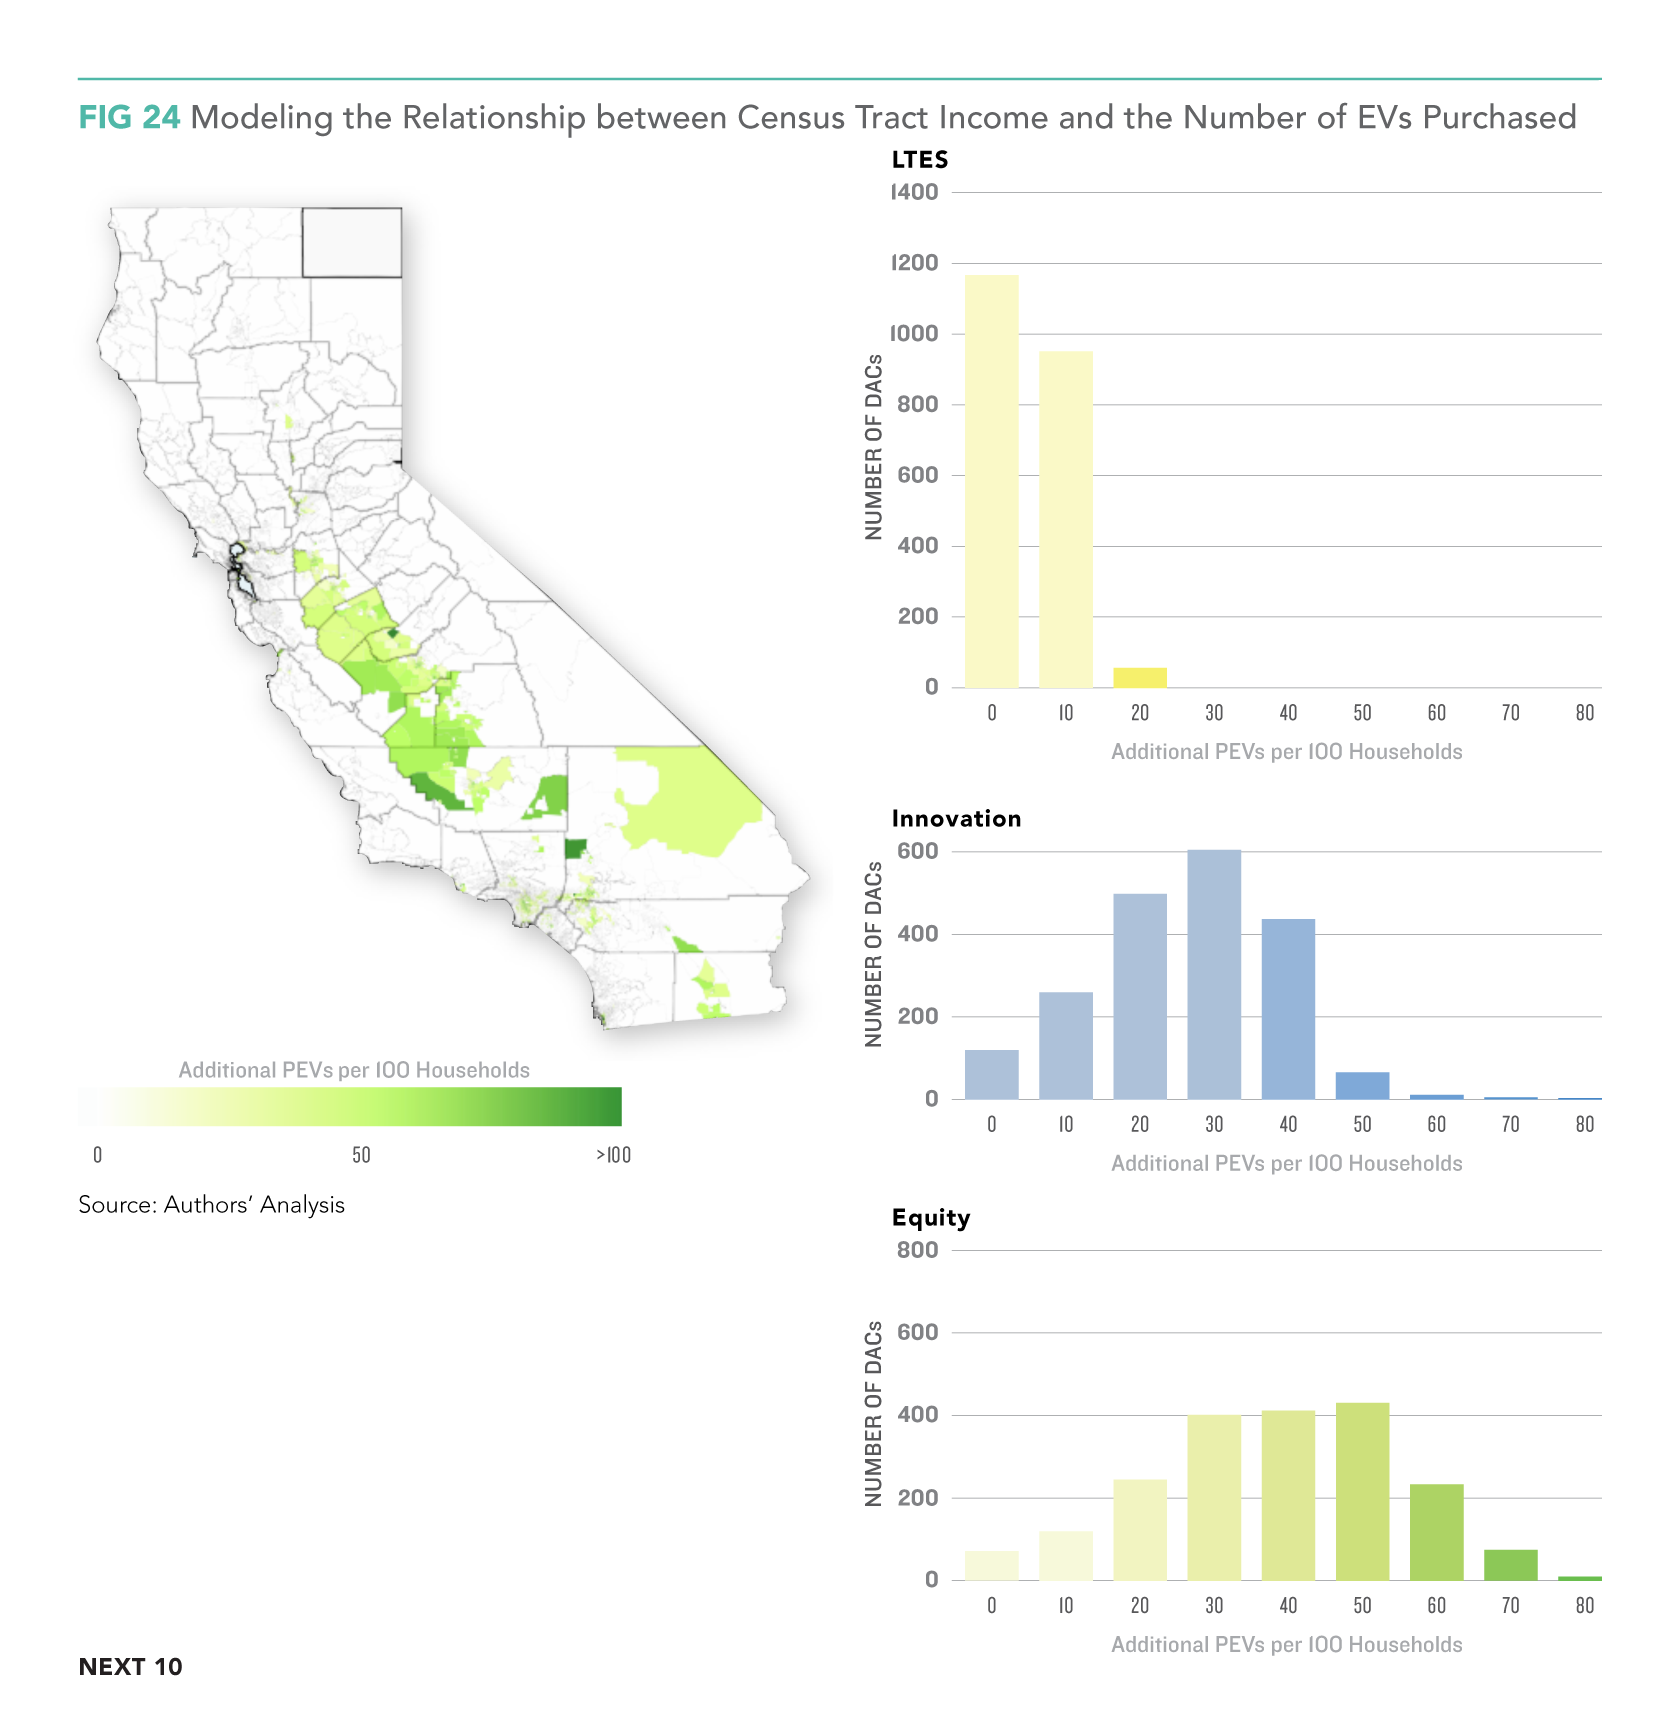
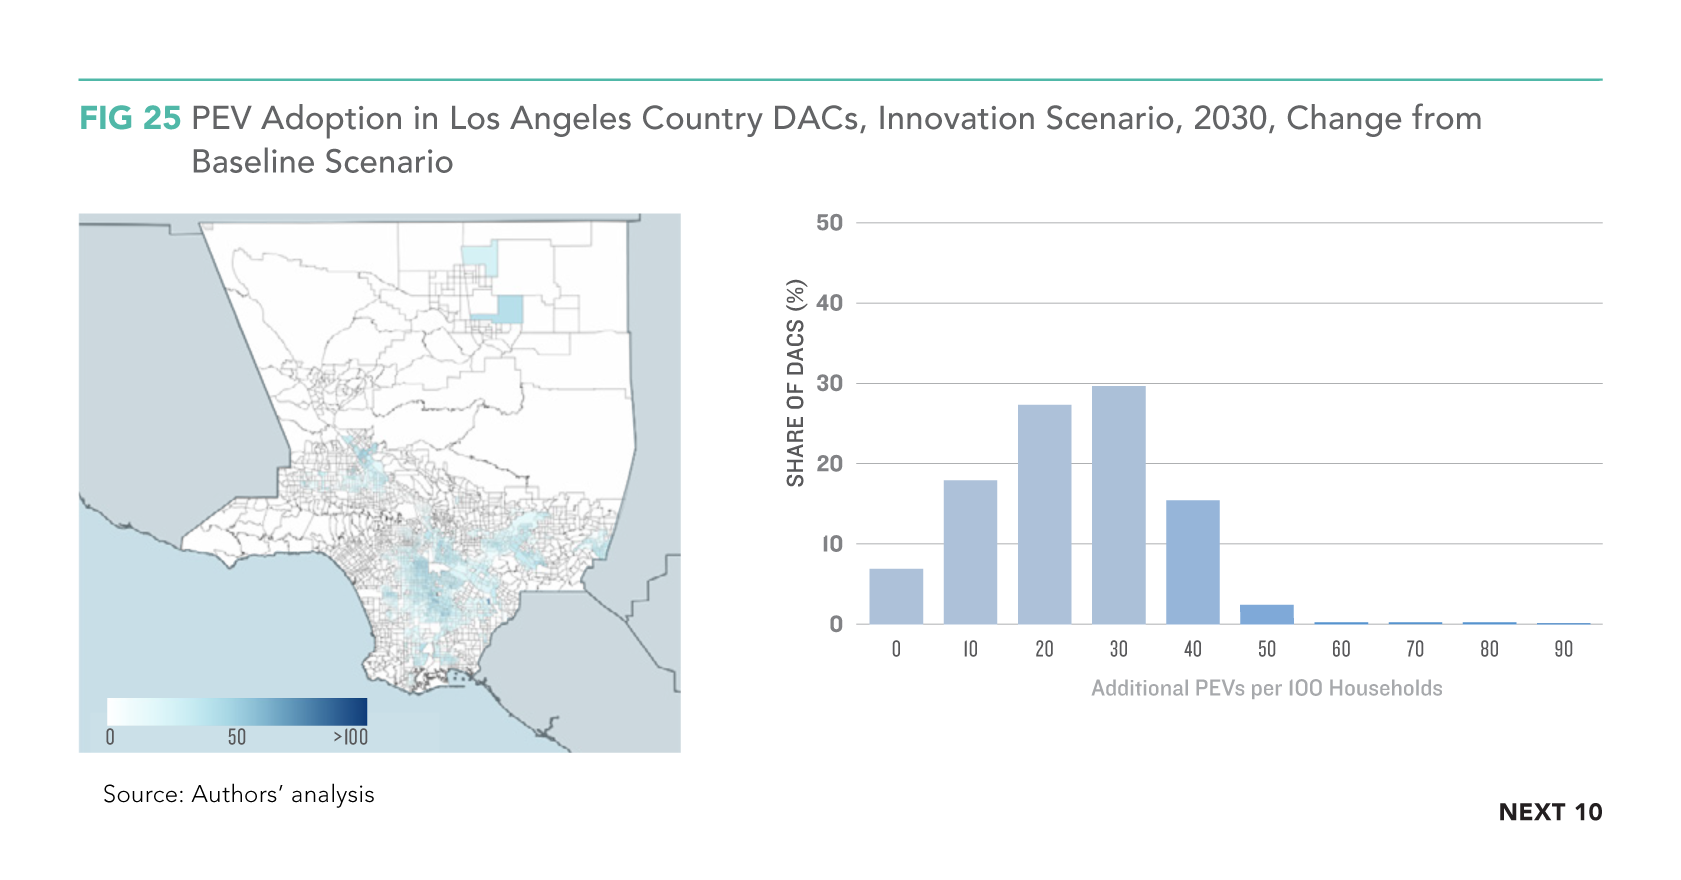
- The study focused on Los Angeles County and the Central Valley as 75 percent of the state’s DACs are in these regions.
- By 2030, more than 32,000 of the 59,000 jobs created in the Central Valley and more than half of the 161,000 jobs created in Los Angeles County are forecast to be in DACs.
- By 2050, under the Innovation scenario, DACs in both regions would see substantial incremental employment benefits—192 jobs created per DAC in Los Angeles County and 216 per DAC in the Central Valley.
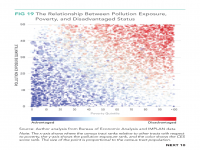
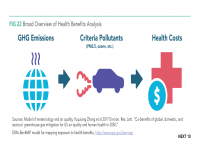
- Air pollution reductions from large-scale electric vehicle adoption also benefit DAC households more than higher-income groups.
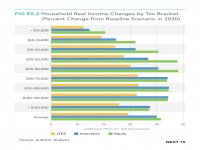
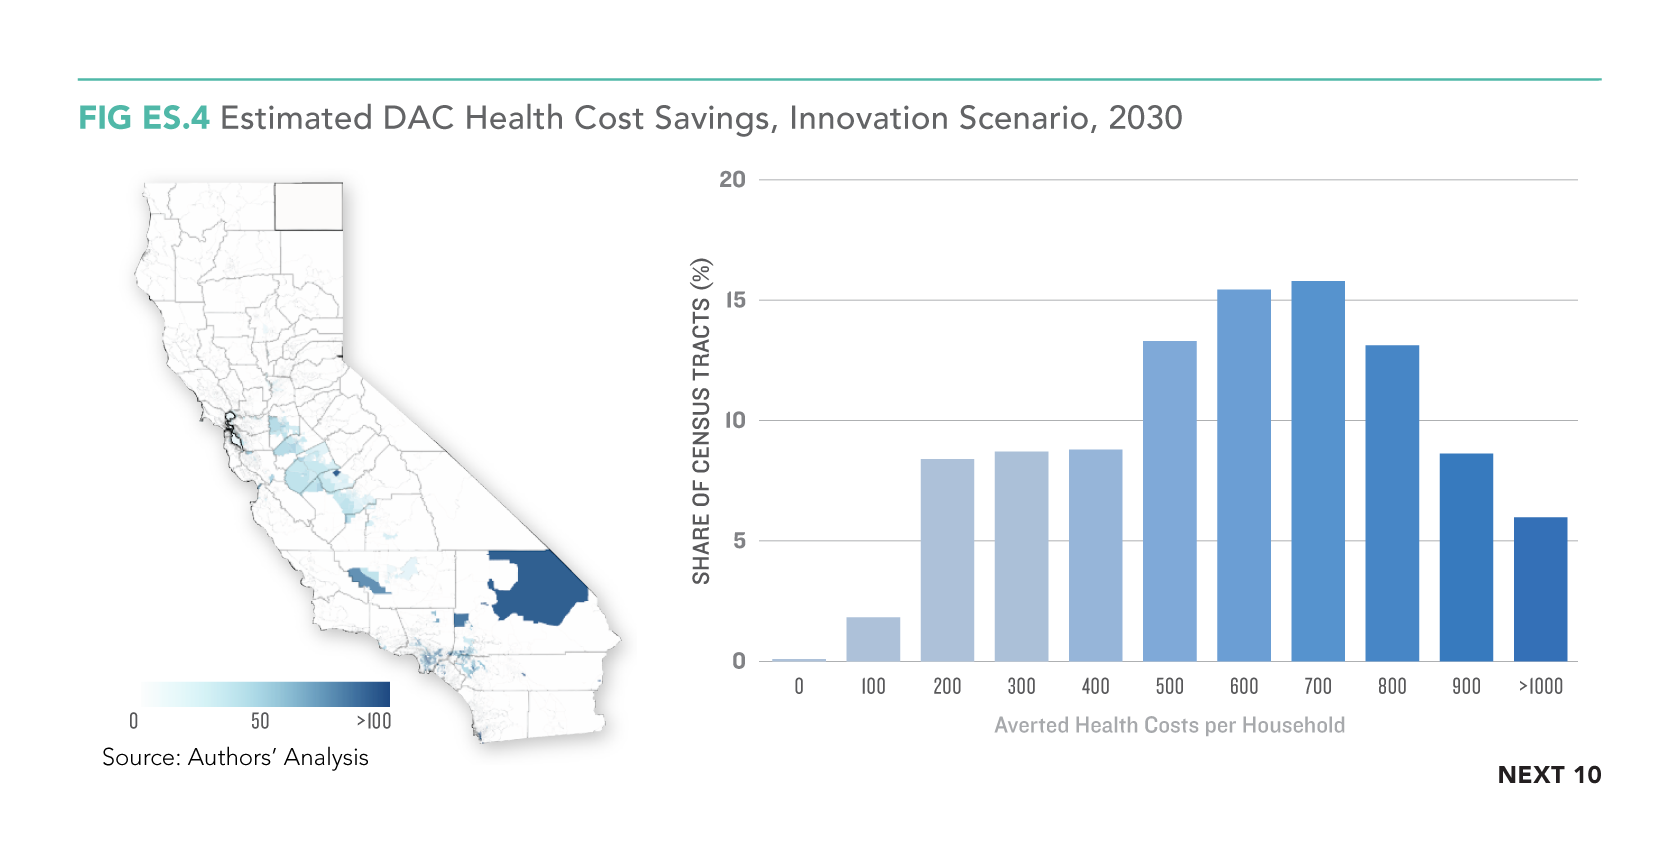
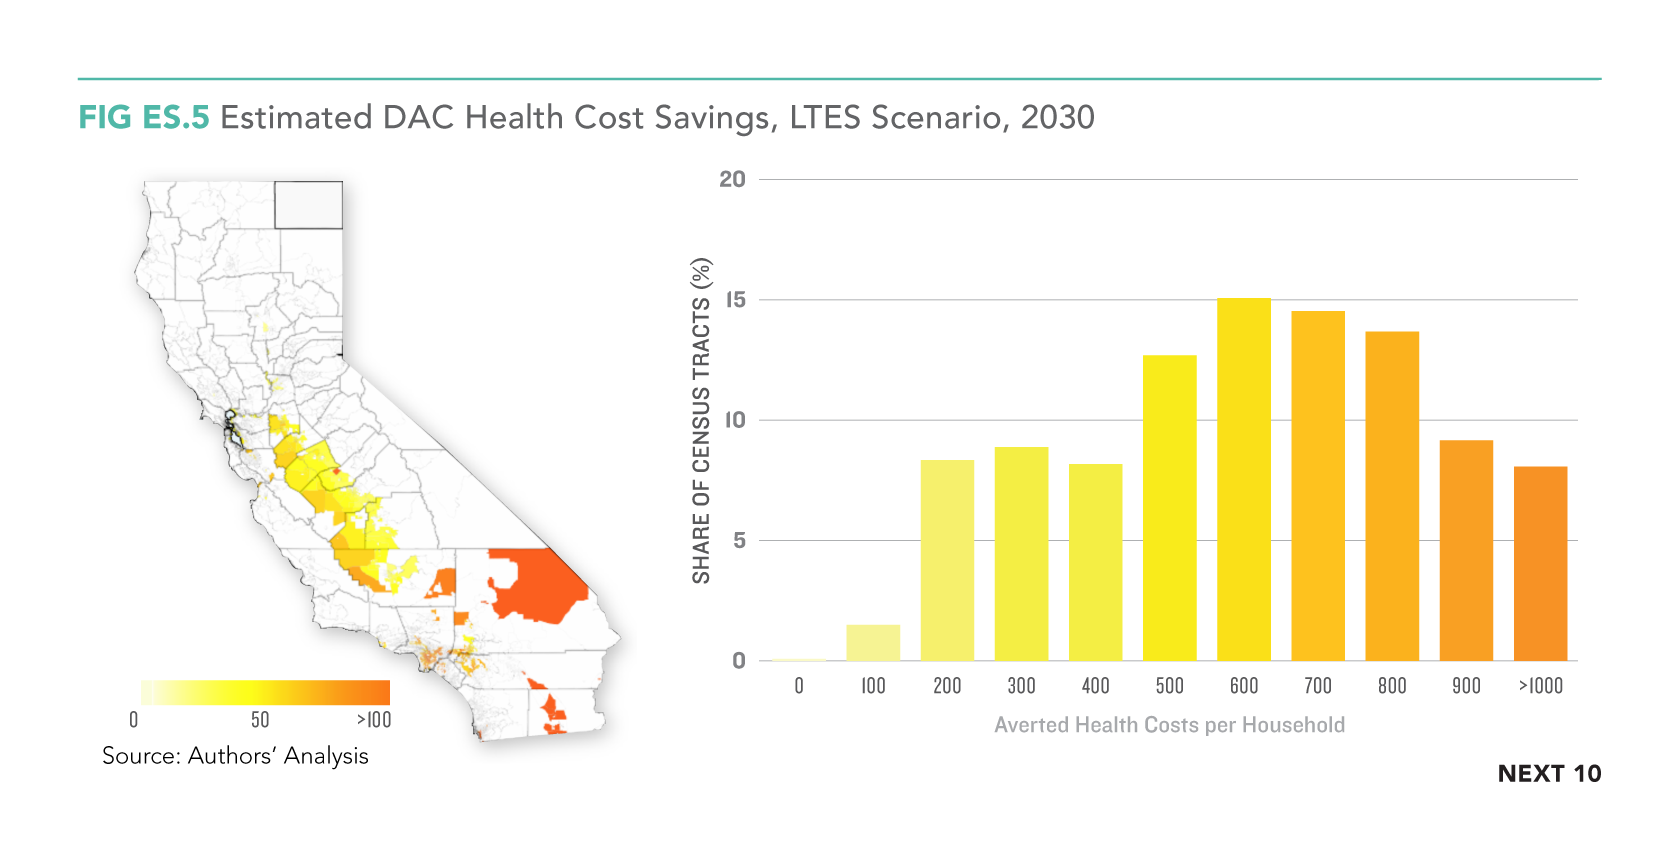
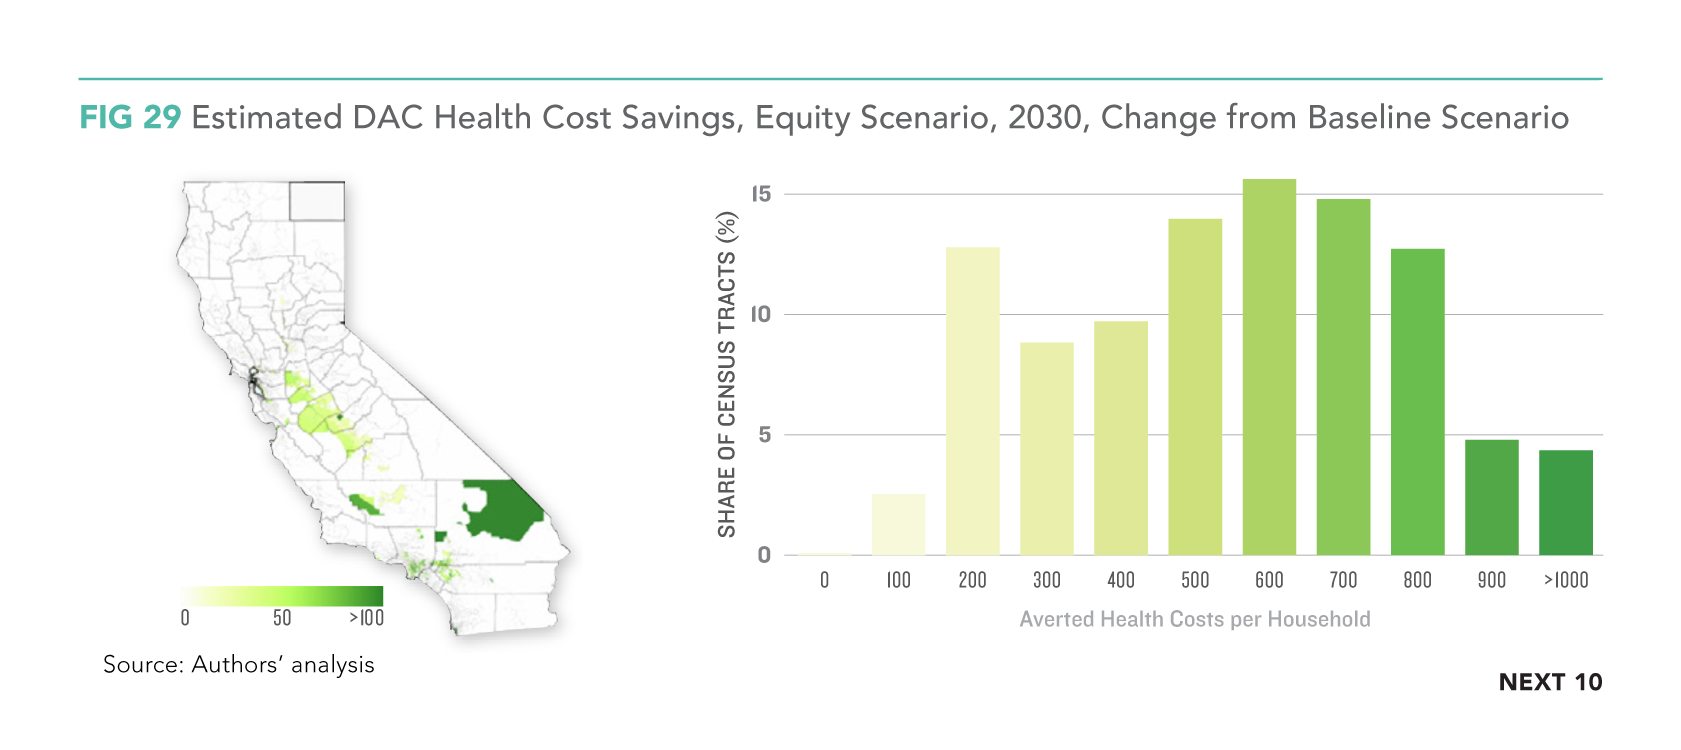
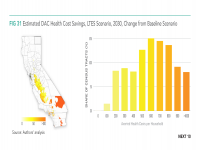
- The study found that in an Equity scenario, the economic value of health benefits from the reduction in pollution would amount to $2 billion by 2030—$800 million from avoided mortality and $1.2 billion from averted medical costs.
- The savings are higher for DAC households than non-DAC households—with $581 averted per DAC household and $494 averted per non-DAC household—and the savings represent a larger proportion of household income for DACs.
Policy Considerations:
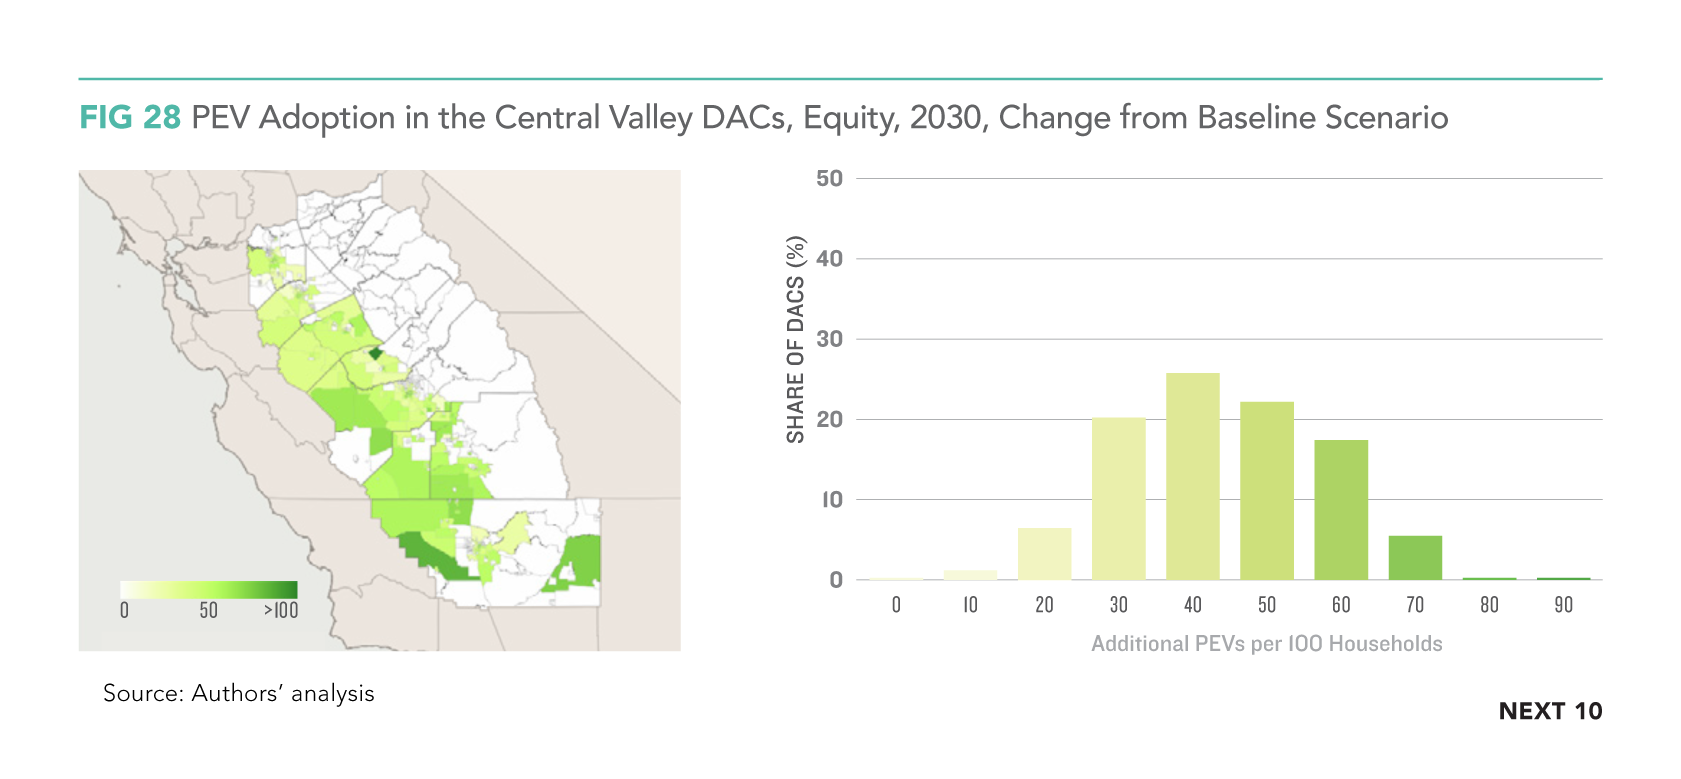
- Most of the benefits of PEV adoption occur regardless of who adopts the vehicles, but if policies can accelerate adoption in DACs, these groups will benefit more from direct savings and local pollution reduction, and California will come much closer to achieving its long-term pollution reduction goals.
- Creating a market to incubate the next generation of fuel-efficient vehicles could promote job growth across California’s economy while capturing national and global market opportunities for technology development.
- Benefits to GSP and income dwarf the amounts accruing to other policies, such as California's cap-and-trade program and the budgets thus far committed to clean vehicle incentive programs. Under any of the alternative scenarios considered, increased vehicle fleet electrification could be very lucrative to the state.
- While the current federal administration's approach toward California’s authority to regulate vehicles provides some uncertainty, the fiscal authority to offer economic incentives is much more secure. The state could consider pursuing and expanding incentives more aggressively to optimize net benefits, such as reduced GHG emissions and a variety of economic and health co-benefits that are discussed in this study.
Next 10 cannot grant permission to use graphics from this publication; additional permissions may be required from the copyright holder. Please view our Terms of Use policy for more information or contact Next 10 at info@next10.org with any questions.