Publications
2016 California Green Innovation Index
Eighth annual California Green Innovation Index find explosive growth in solar generation and clean technology hotspots in unexpected places.
This year's California Green Innovation Index tracks key economic and environmental indicators at the regional, state, and international level.
Solar generation and zero emission vehicle (ZEV) adoption rates have increased dramatically in California - 1,378 percent in just 5 years for solar generation, and 244 percent in two years for ZEV registrations - signaling major market disruption as clean energy technology hotspots take root across California, and not just in traditional innovation hubs. For example, the state's top region for commercial and residential solar power is Riverside-San Bernardino-Ontario, while Fresno is number one for industrial solar power.
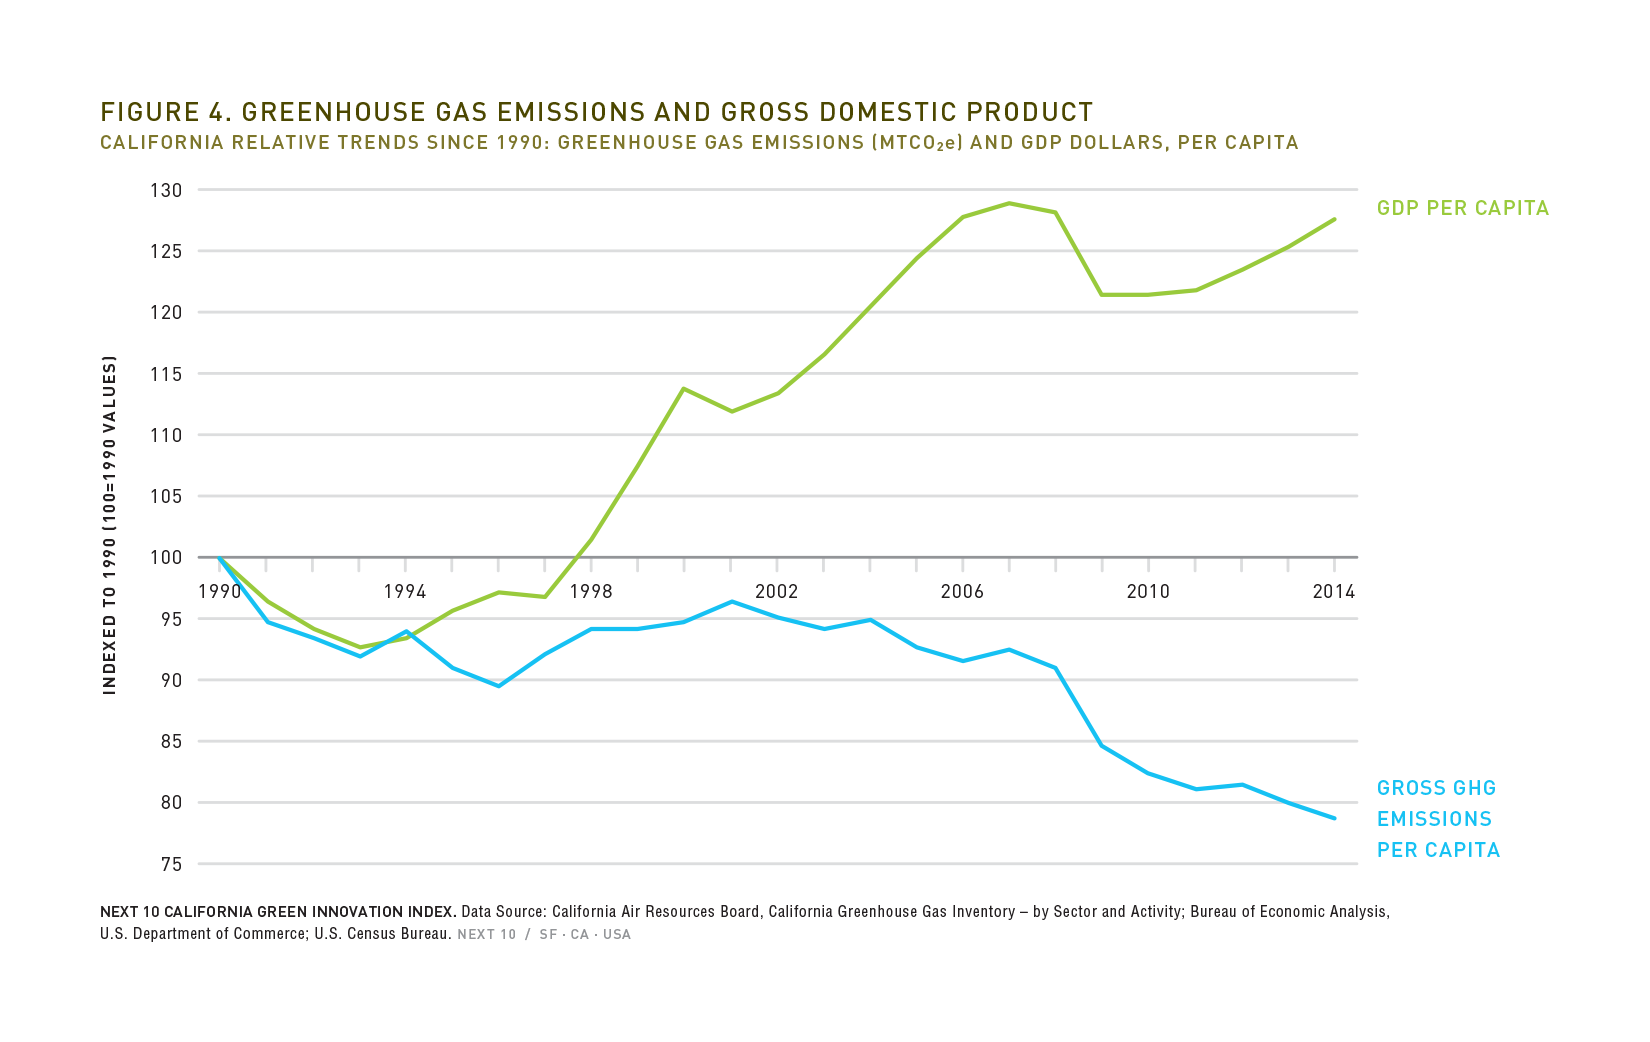
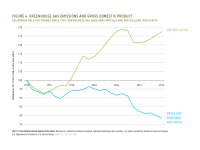
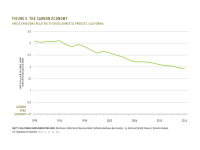
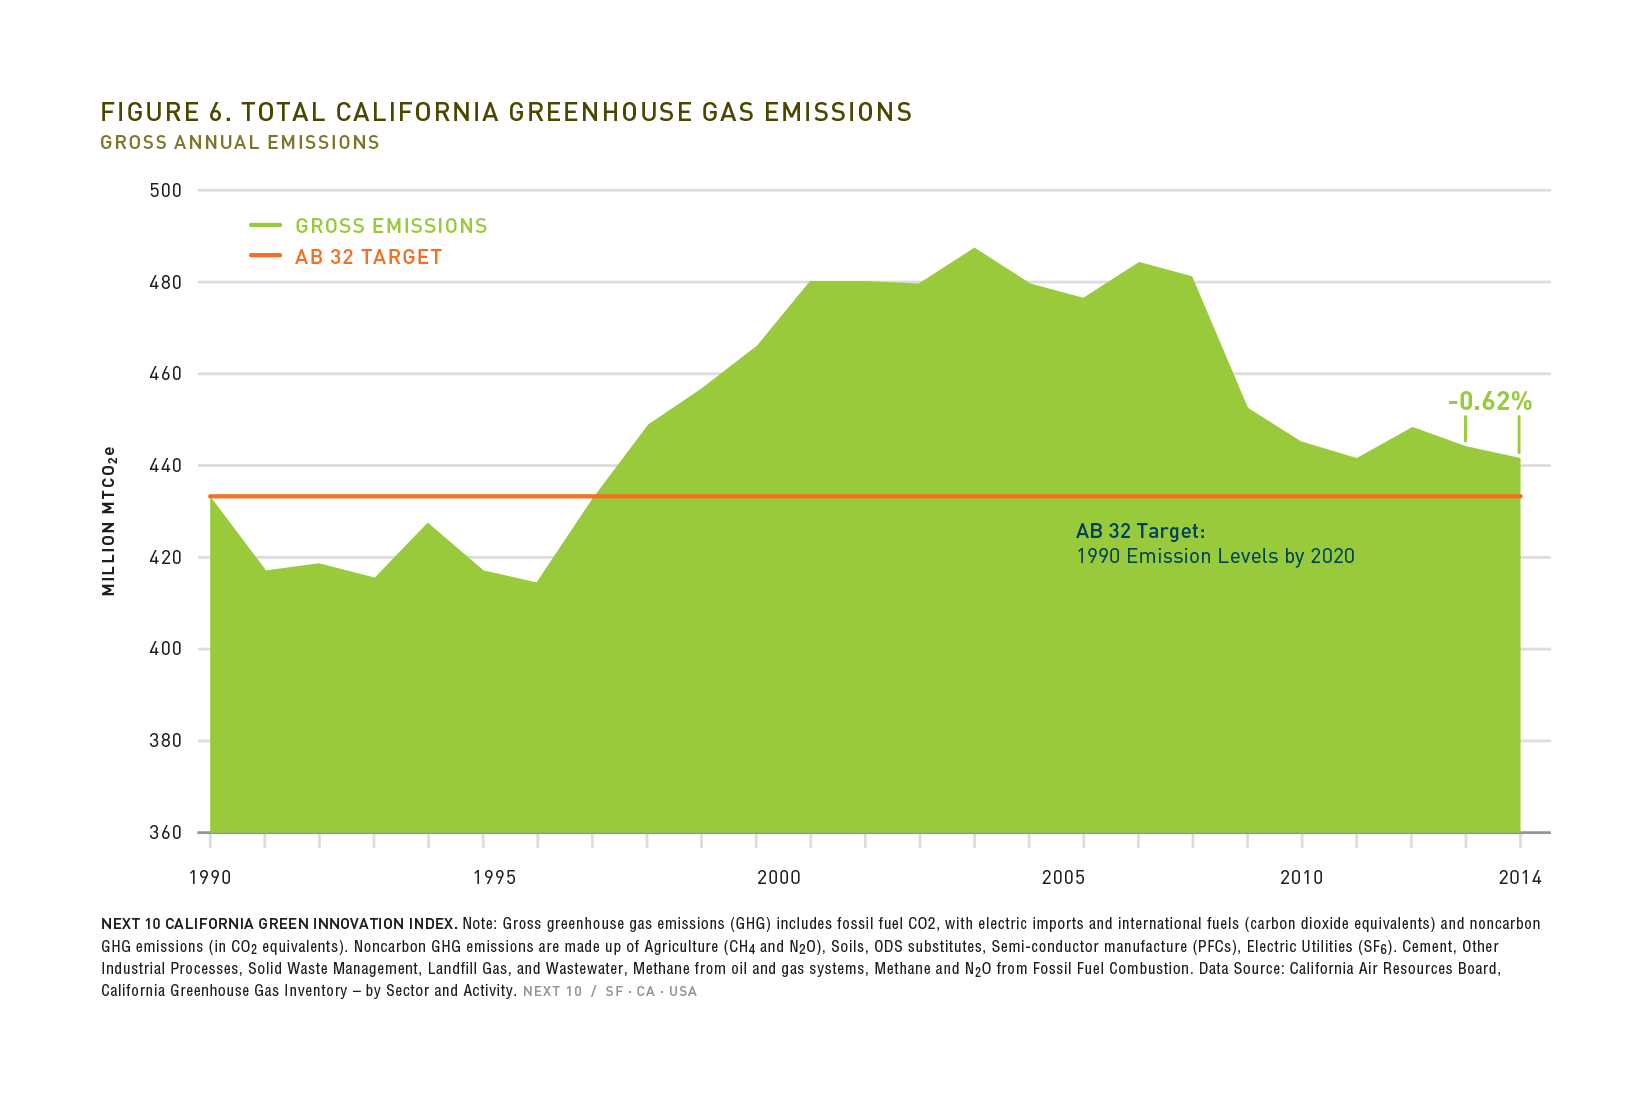
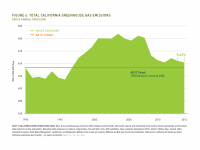
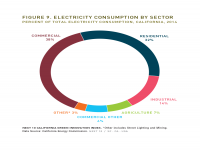
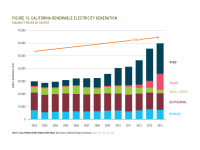
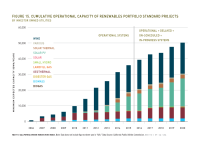
As of 2014, renewable energy sources served 25 percent of California's retail electricity sales, and generated 20.1 percent of California's total electricity, up from 12 percent in 2009. Internationally, California maintains its ranking as 4th in the world for the share of electricity generated from renewable sources. In 2014, California's total state greenhouse gas emissions fell 0.62 percent compared to 2013.
Next 10 owns the rights to this publication. Any usage of content from this publication is subject to our Terms of Use.
Solar:
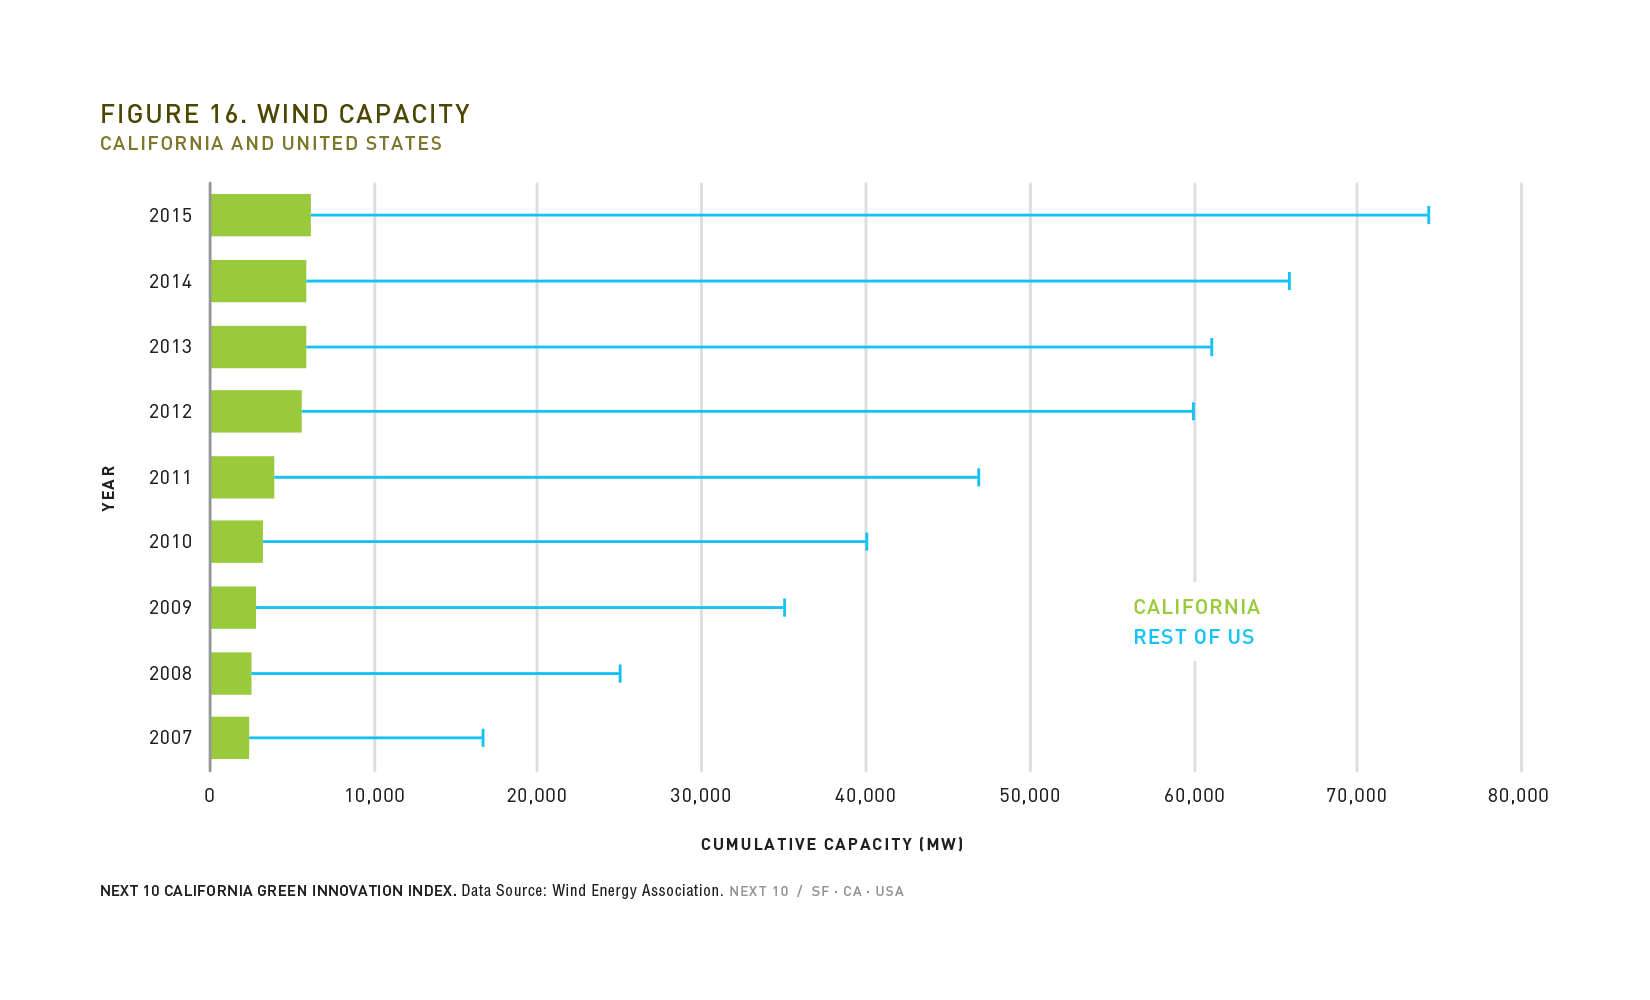
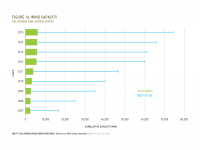
- Solar energy generation increased 1,378 percent between 2009-2014, while wind generation increased 155 percent and biomass increased 10 percent over the same period.
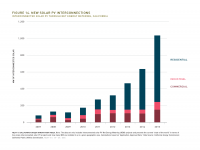
- California installed 3,266 megawatts (MW) of solar photovoltaic (PV) in 2015 alone, more than any other state in the U.S., bringing the state's total to 13,243 MW.
- Grid-connected, utility-scale solar provided 15,592 GWh in 2015, up from only 1,000 GWh in 2011.
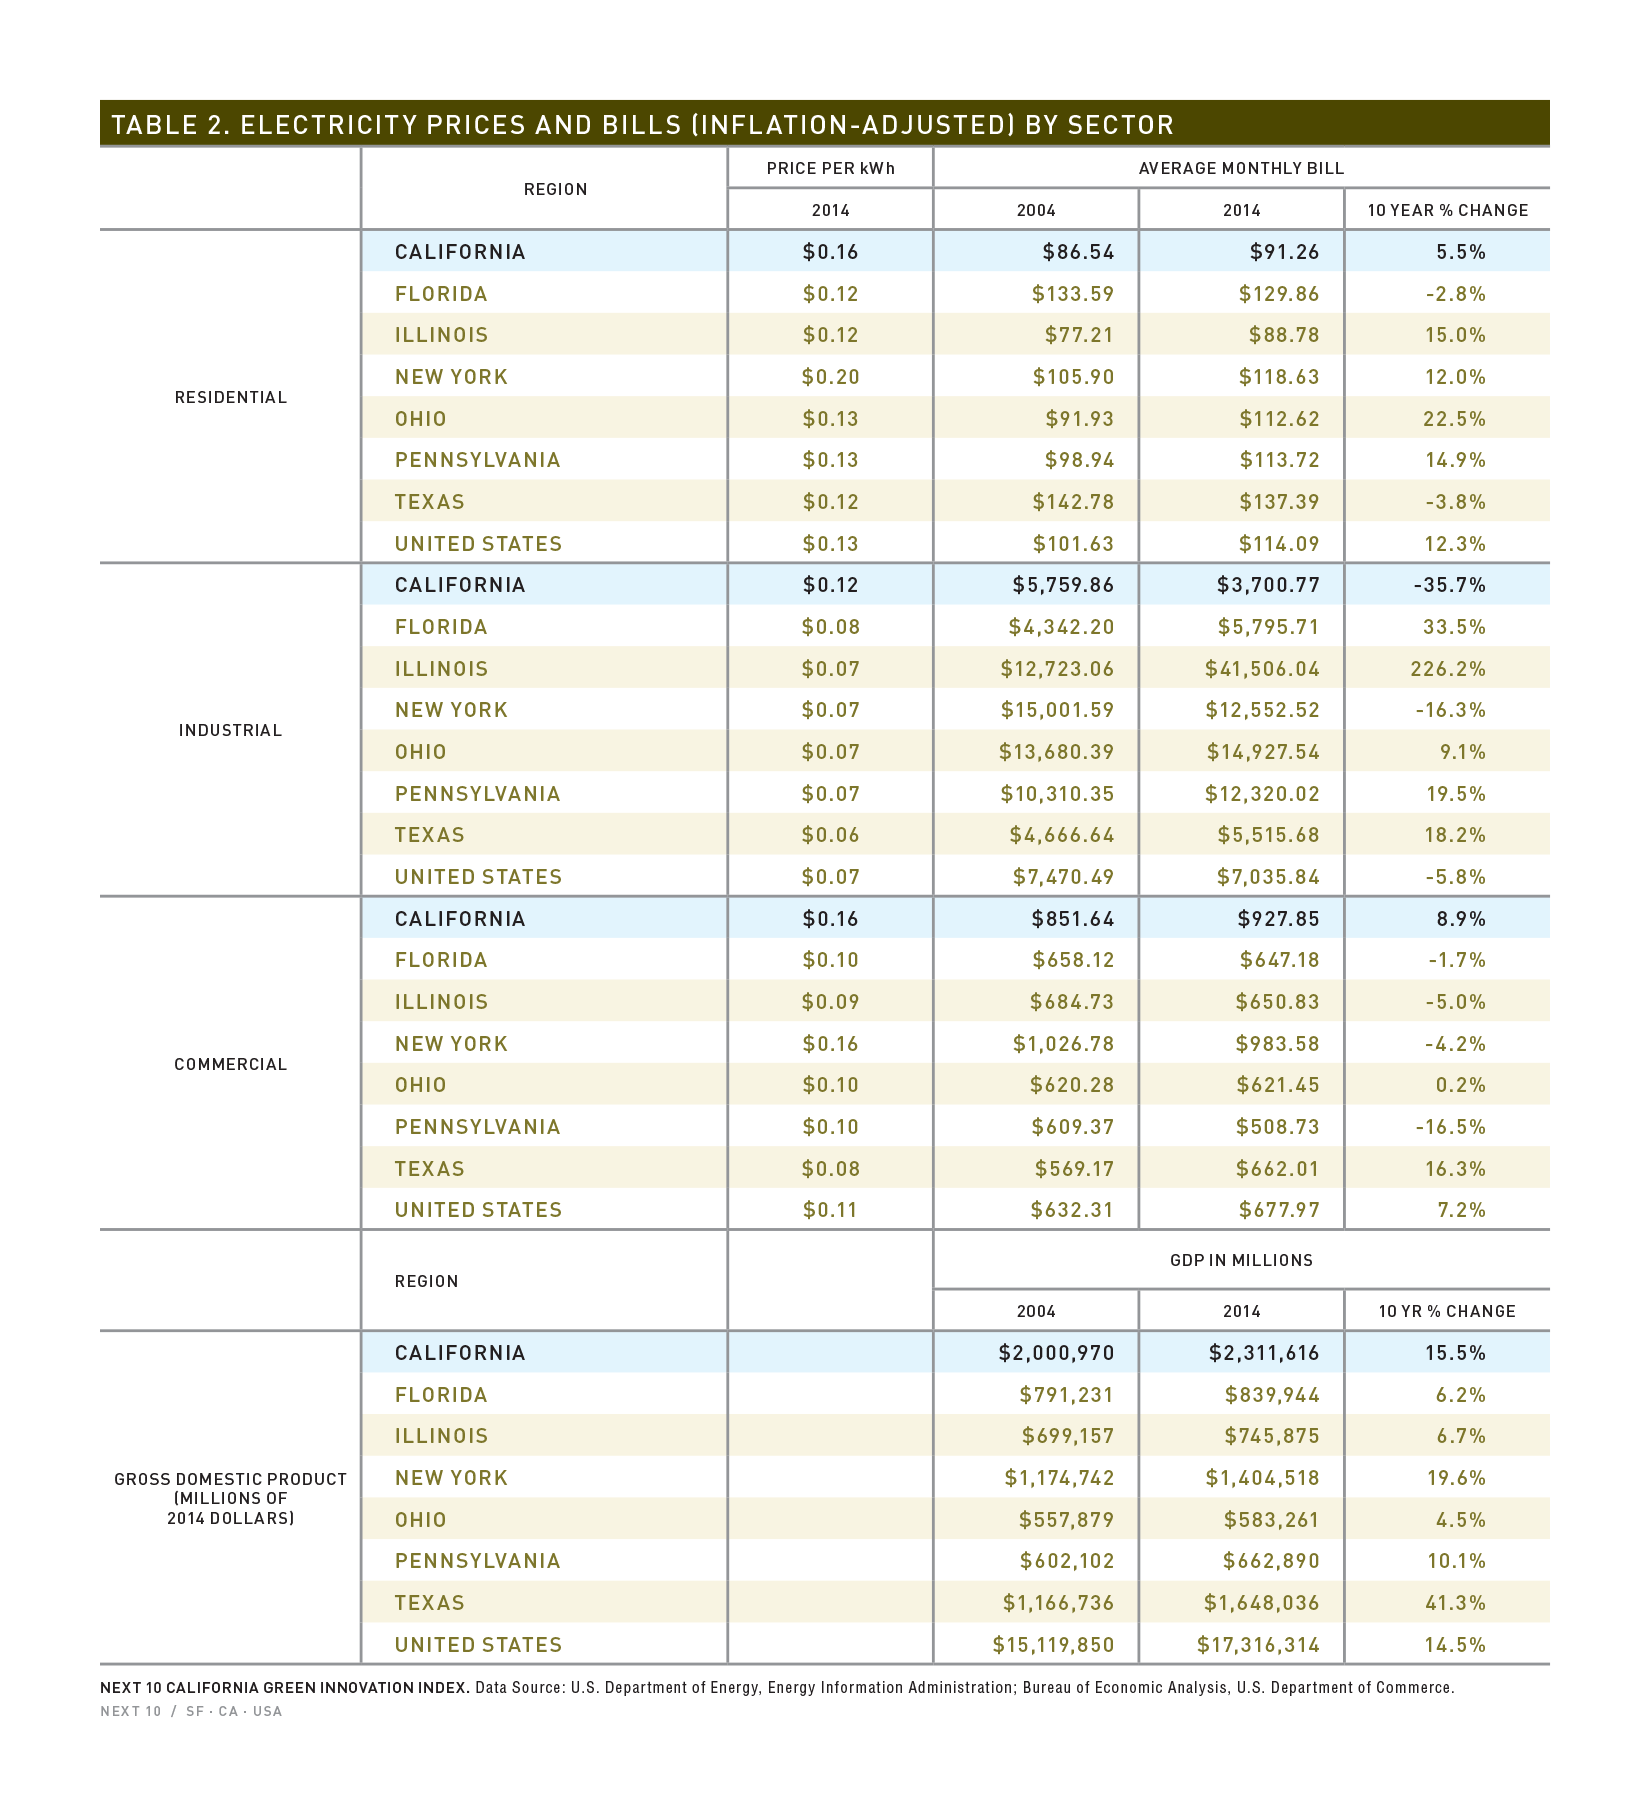
Energy Productivity/Electricity:
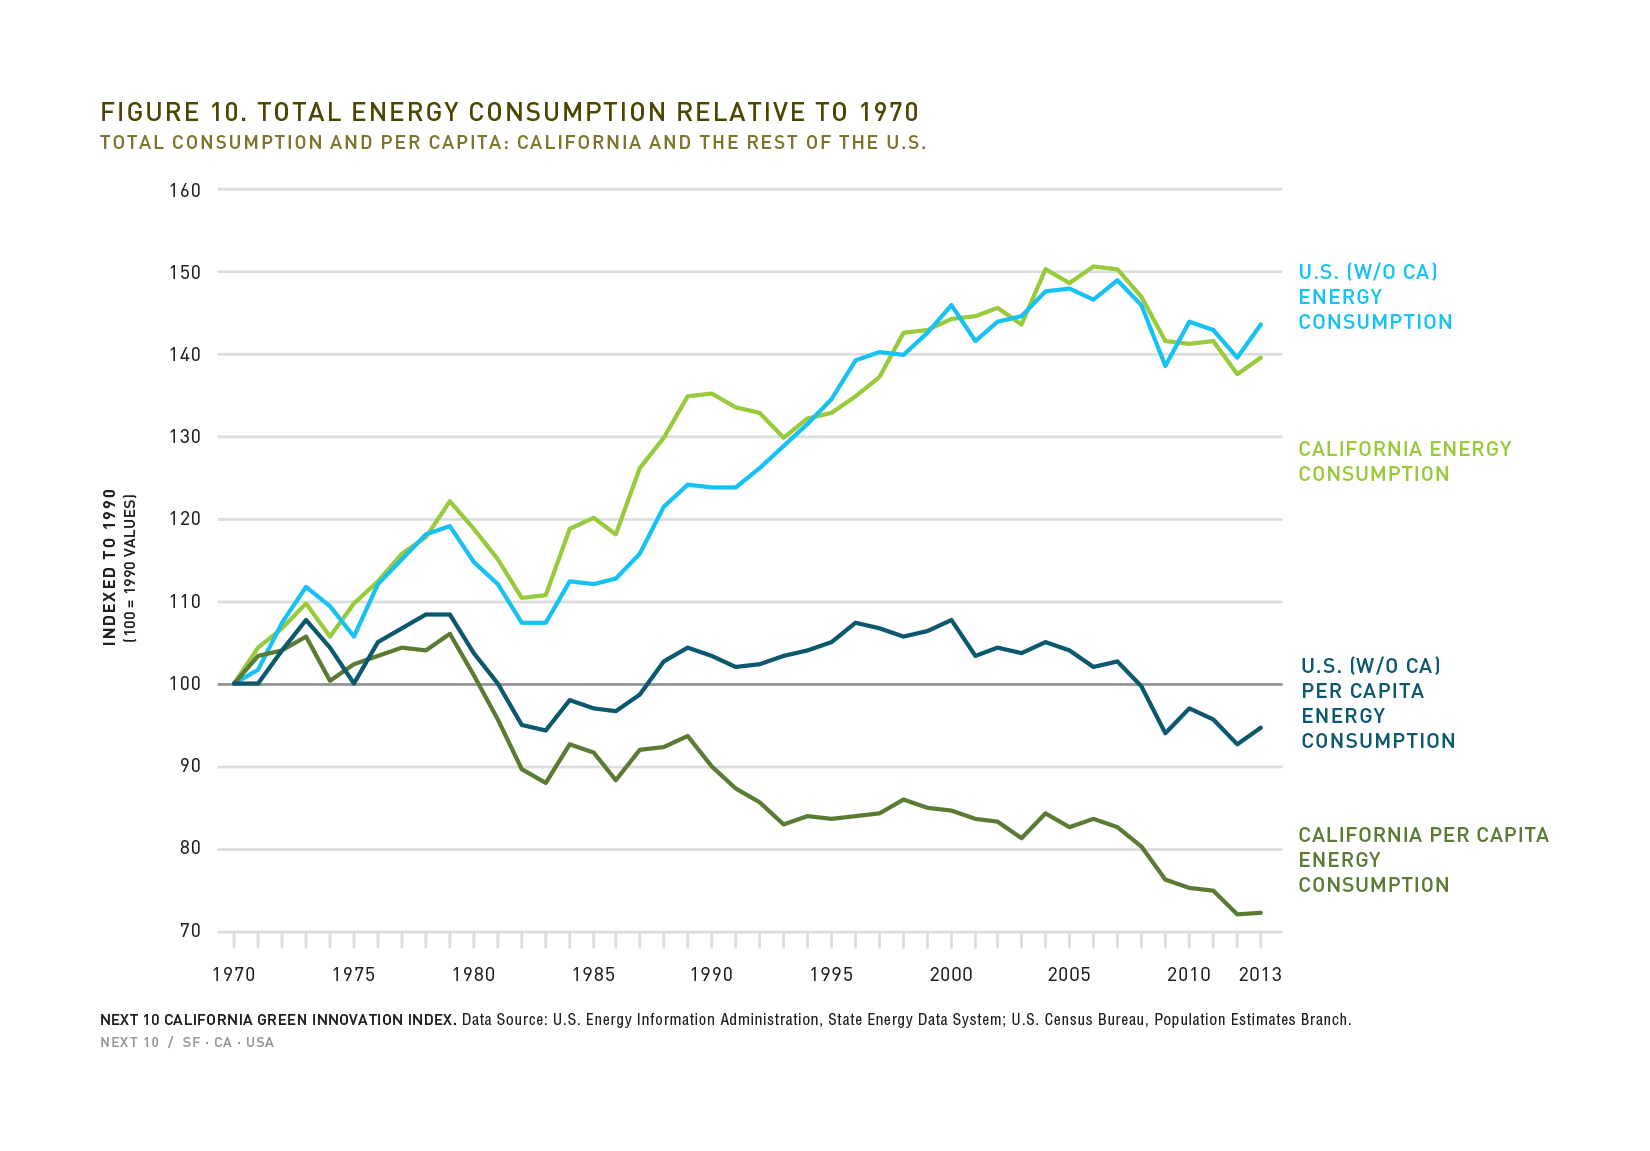
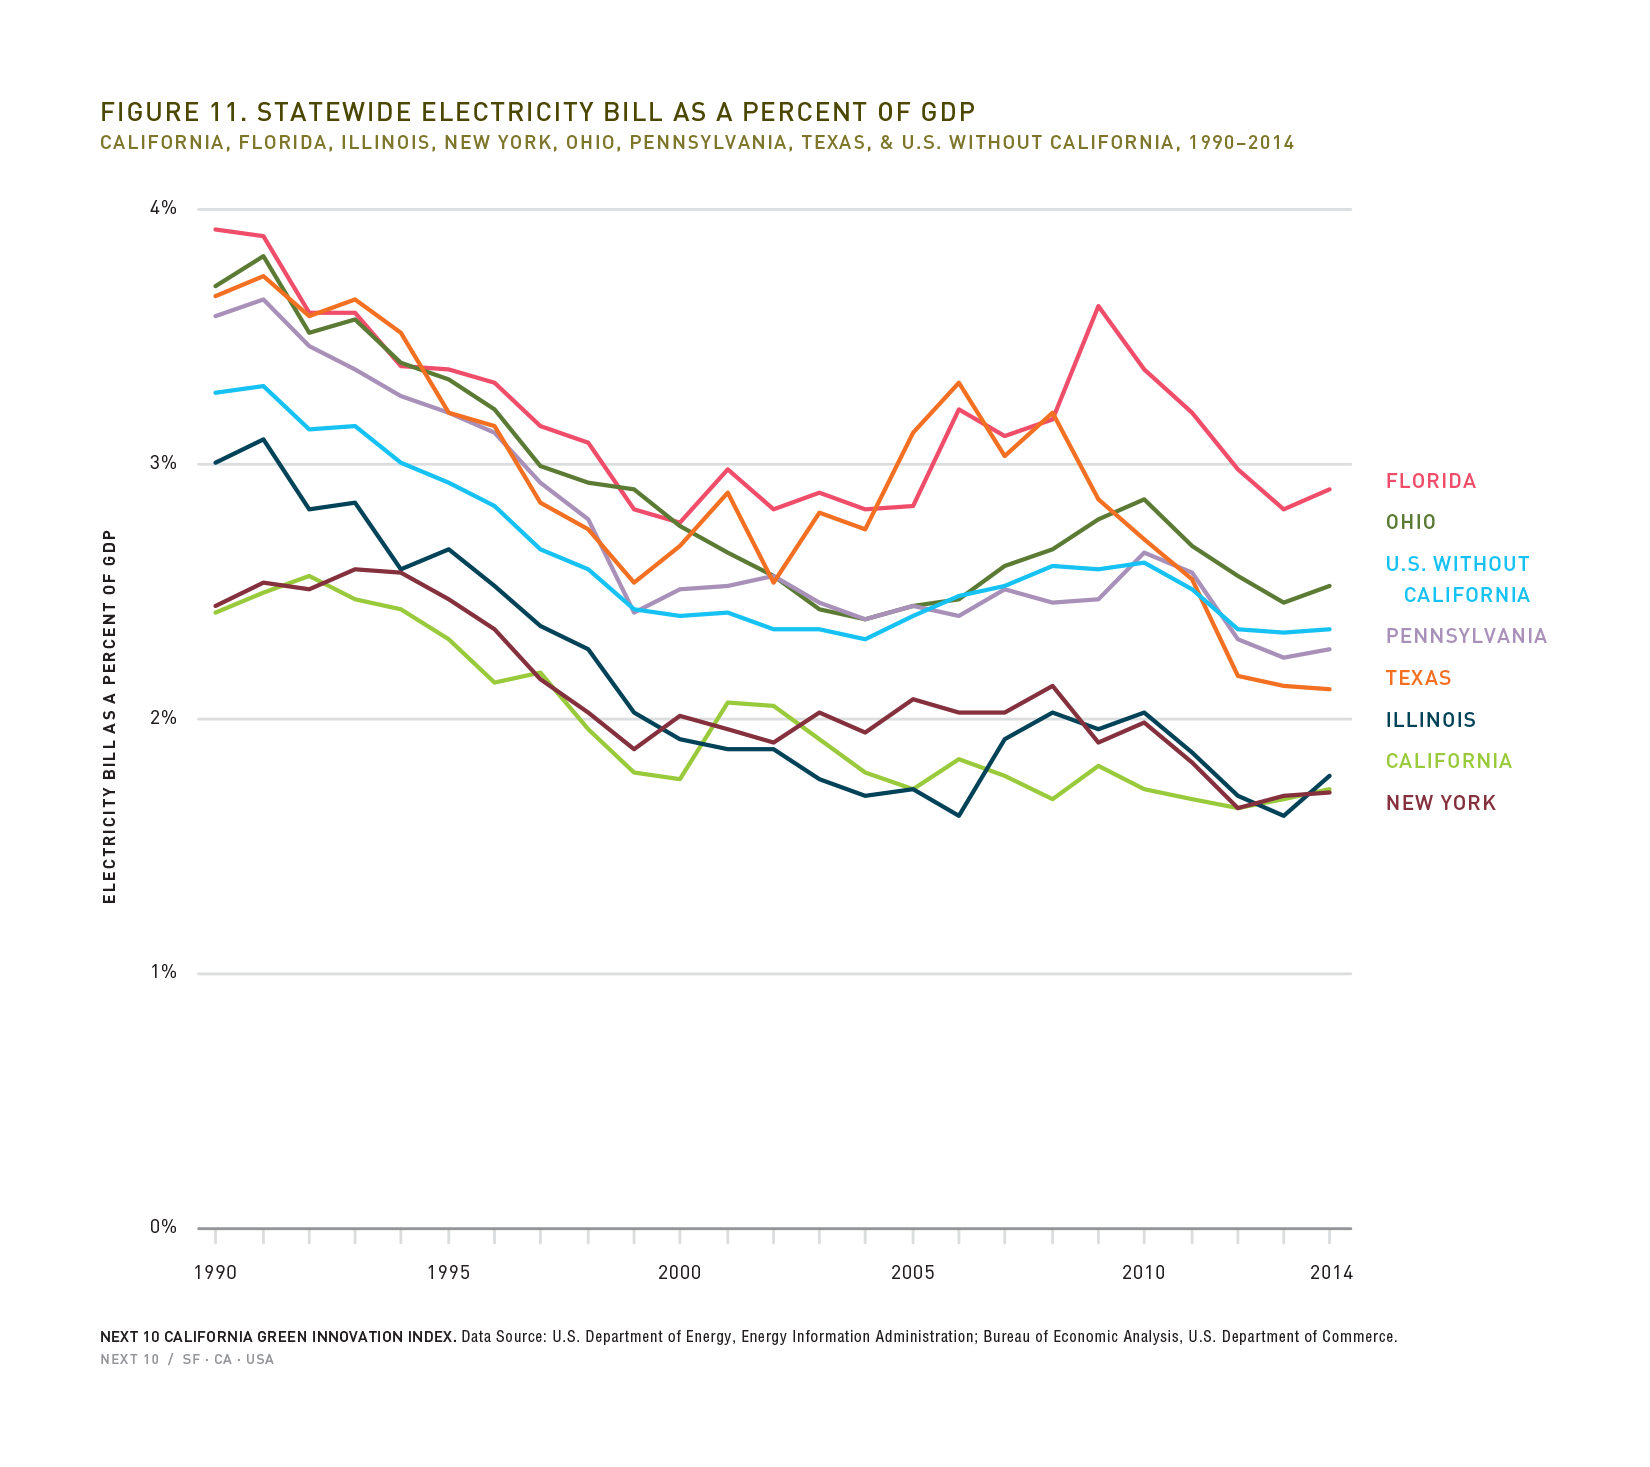
- In 2014, California's average monthly residential electricity bill was 20 percent lower than the U.S. average due to higher levels of energy efficiency.
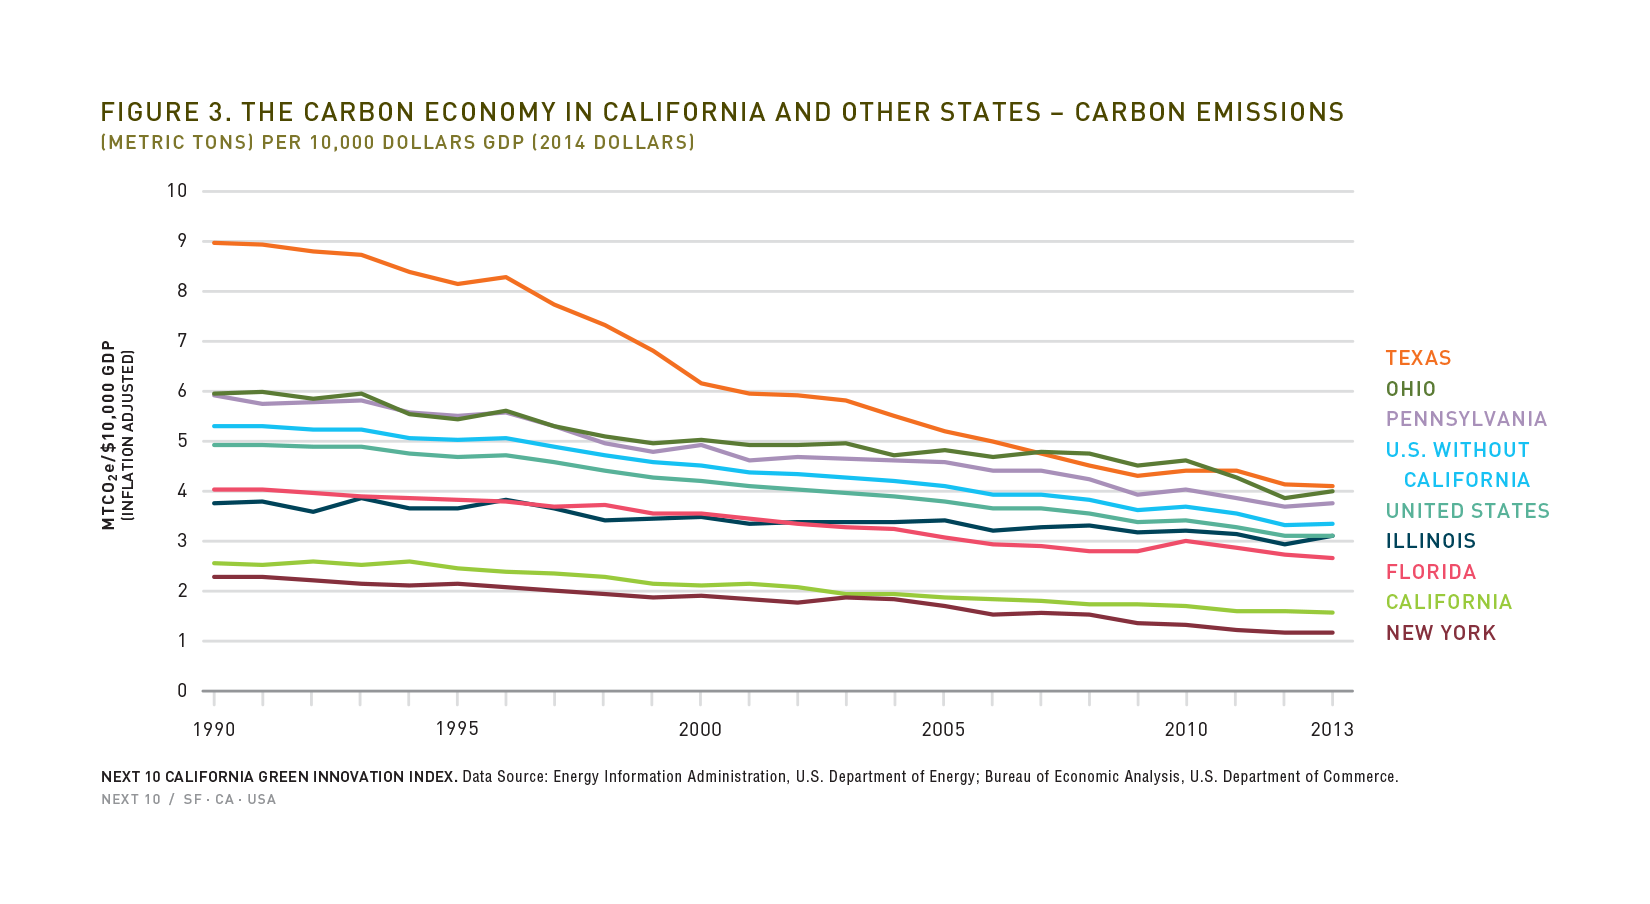
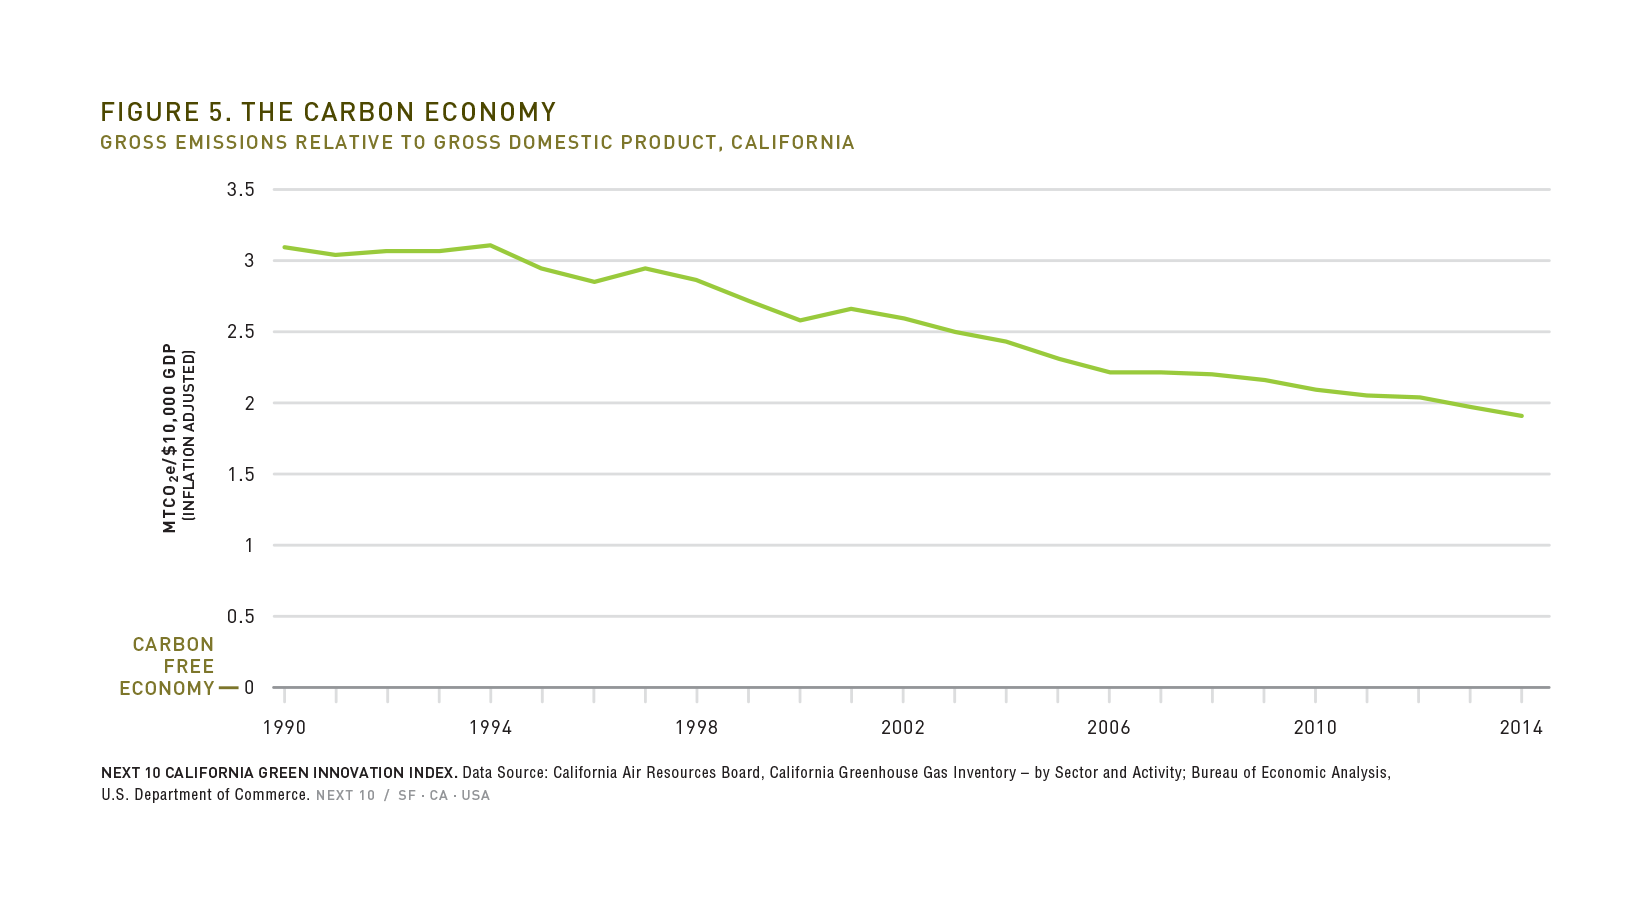
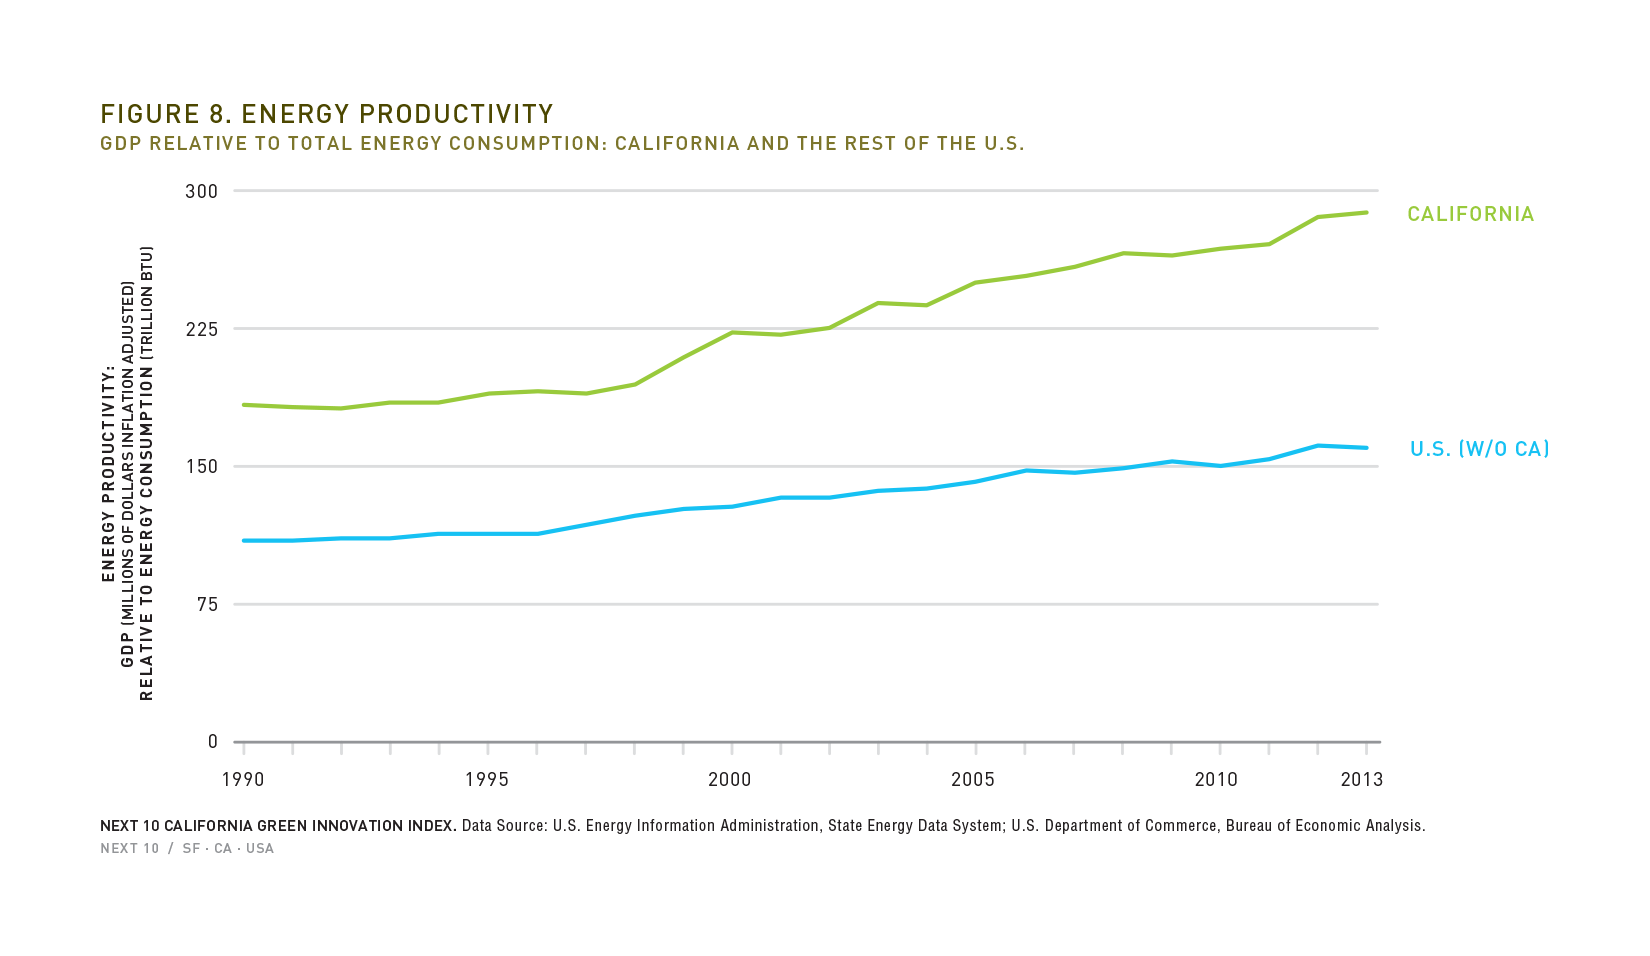
- In 2013, California produced $2.93 of GDP for every 10,000 BTUs, compared to $1.64 of GDP for every 10,000 BTUs in the rest of the nation (given the same amount of energy, California had 1.8 times as much economic activity as the rest of the country).
- While U.S. energy productivity improved 5.6 percent between 2010 and 2013, California's improved by 7.4 percent.
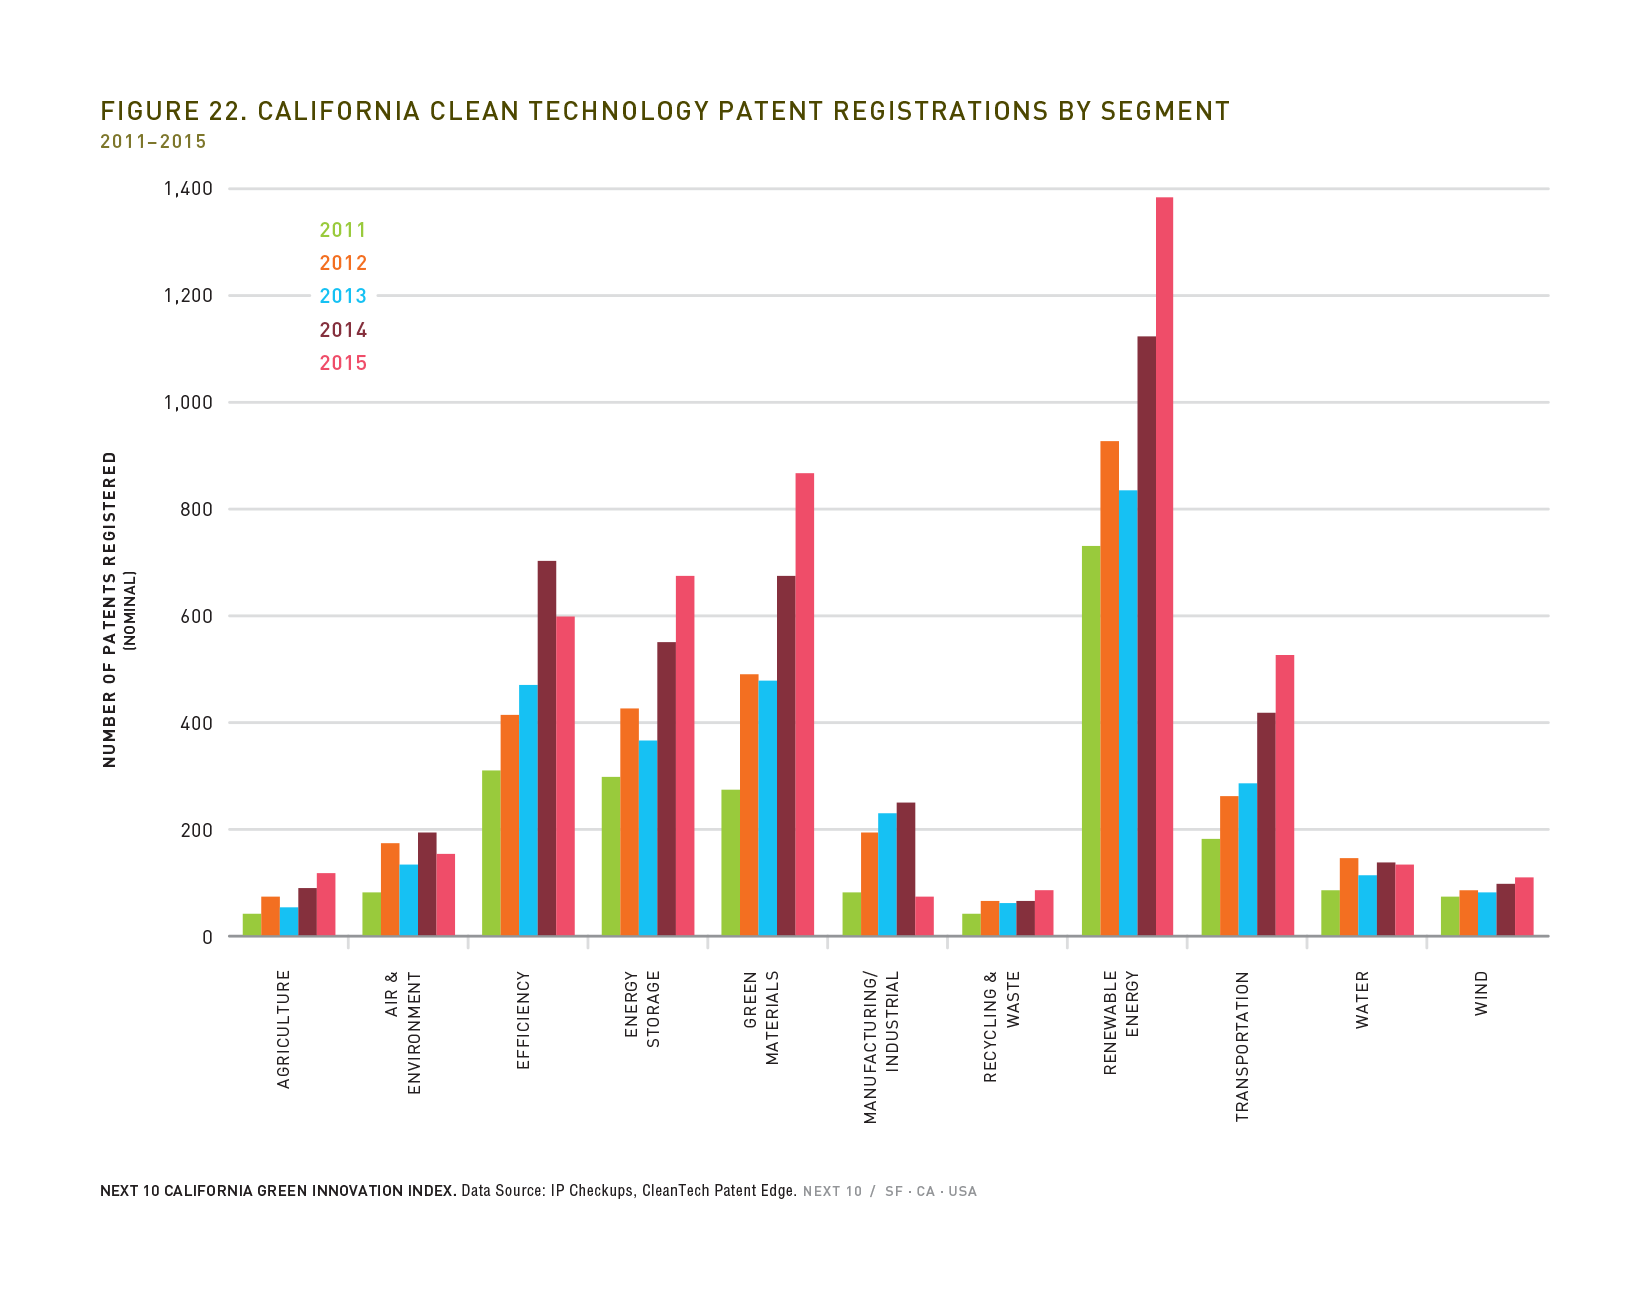
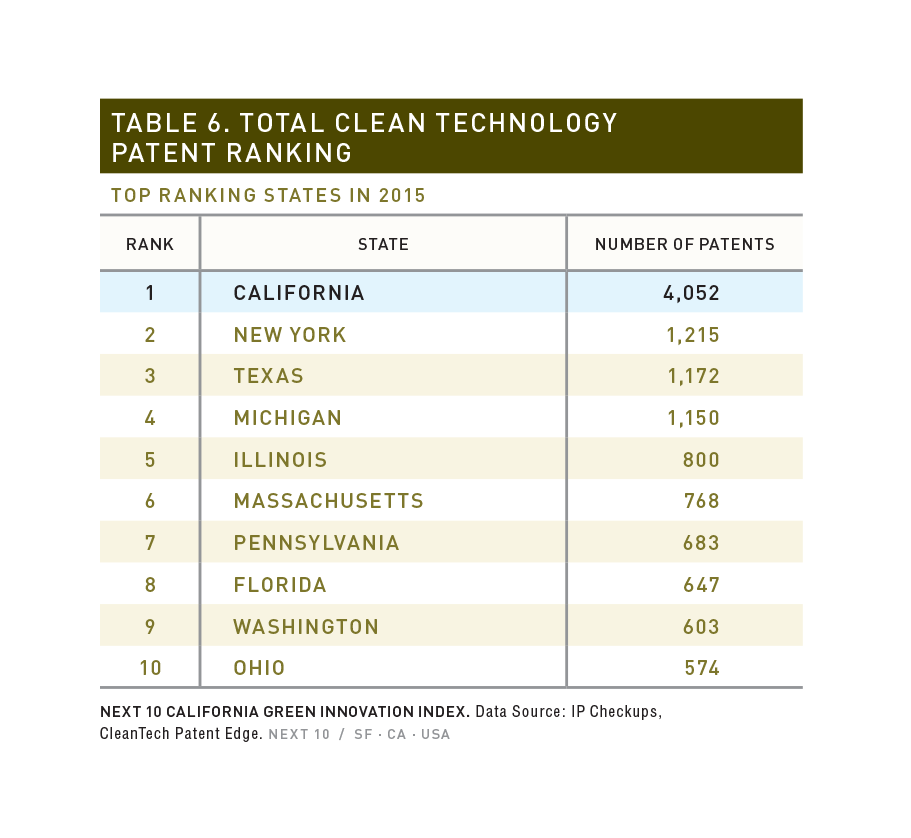
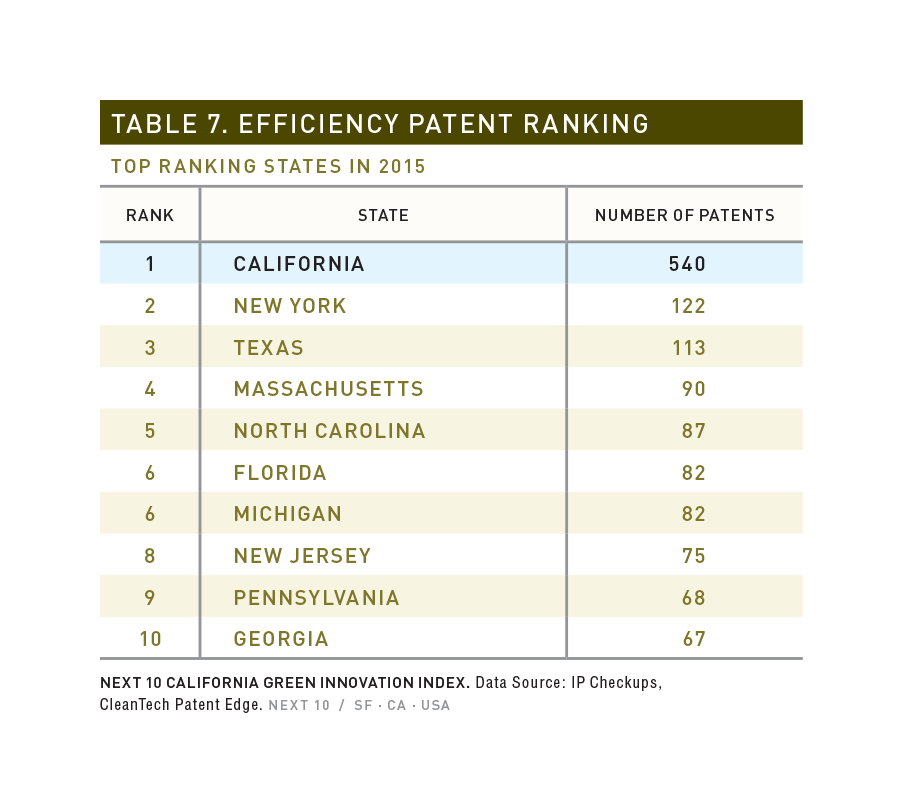
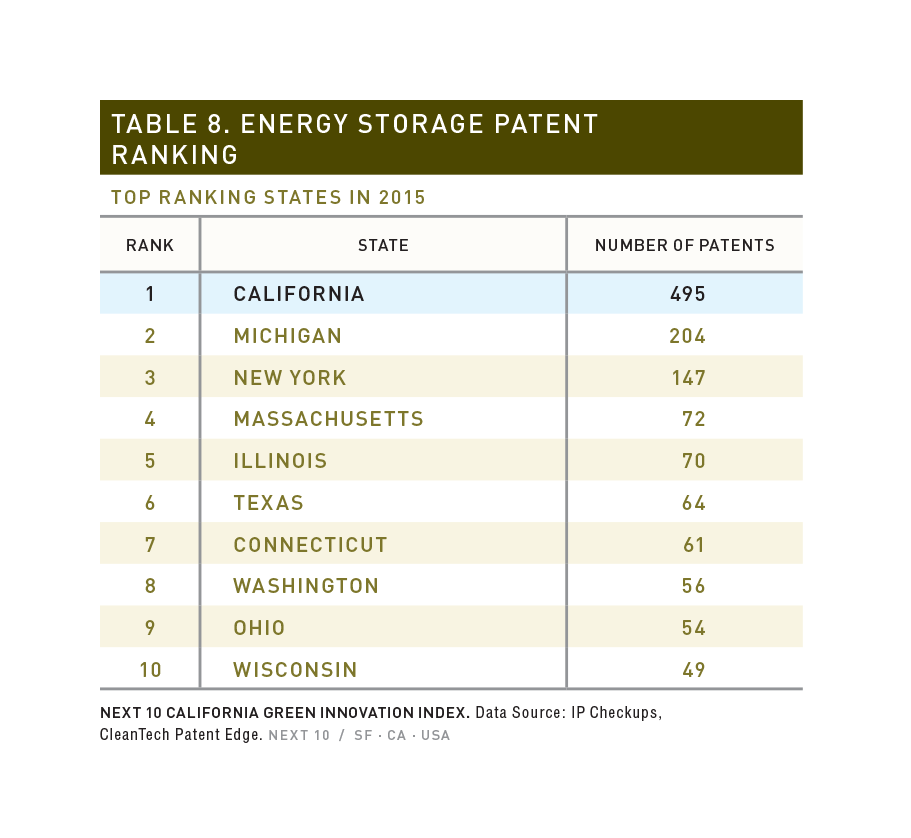
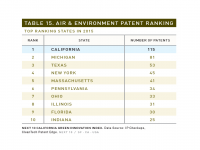
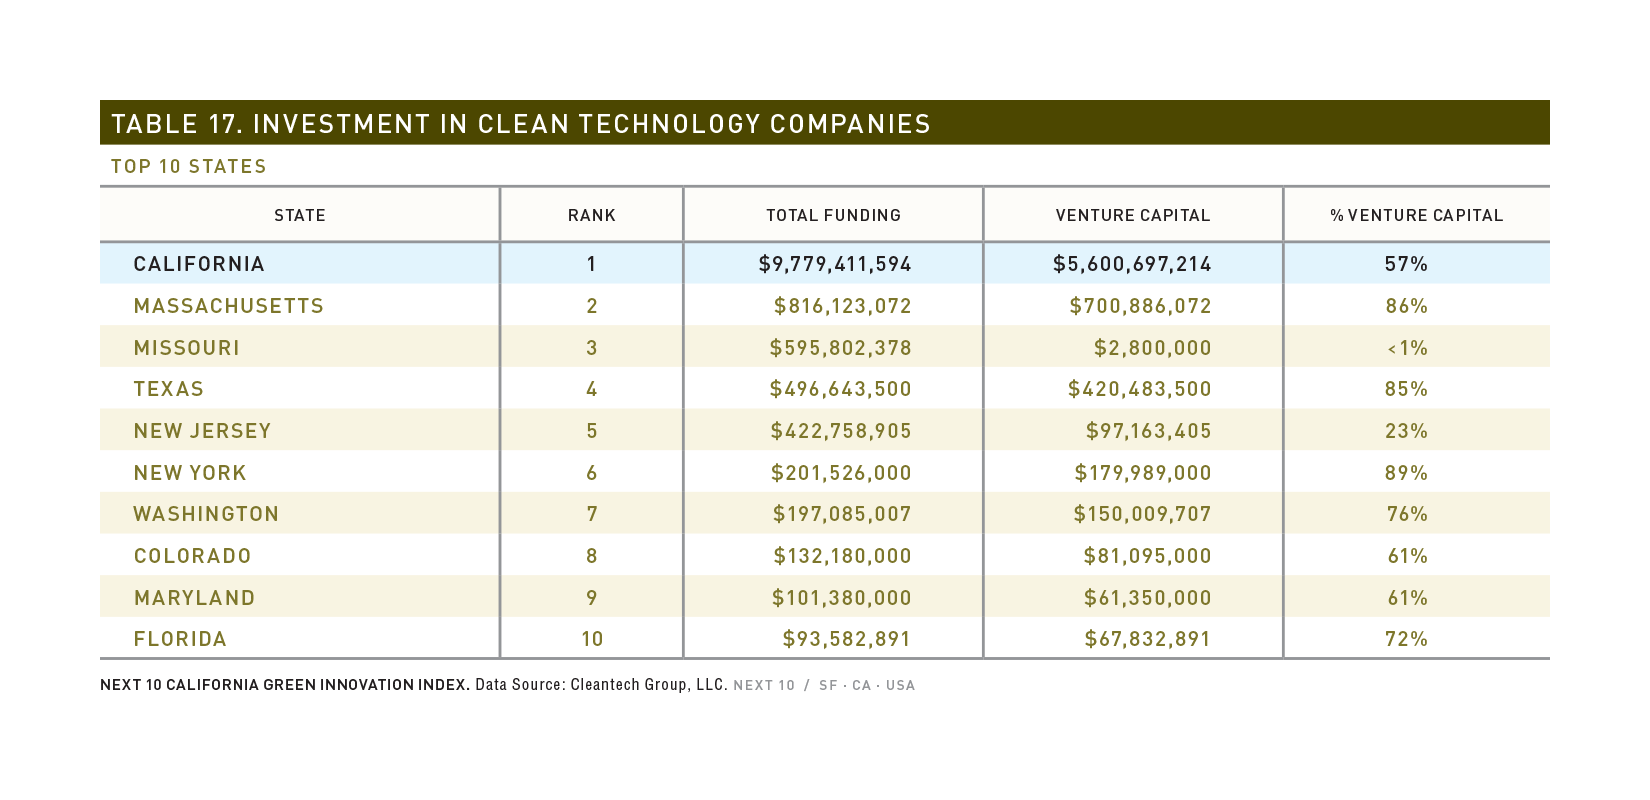
Clean Tech Patents/Investment:
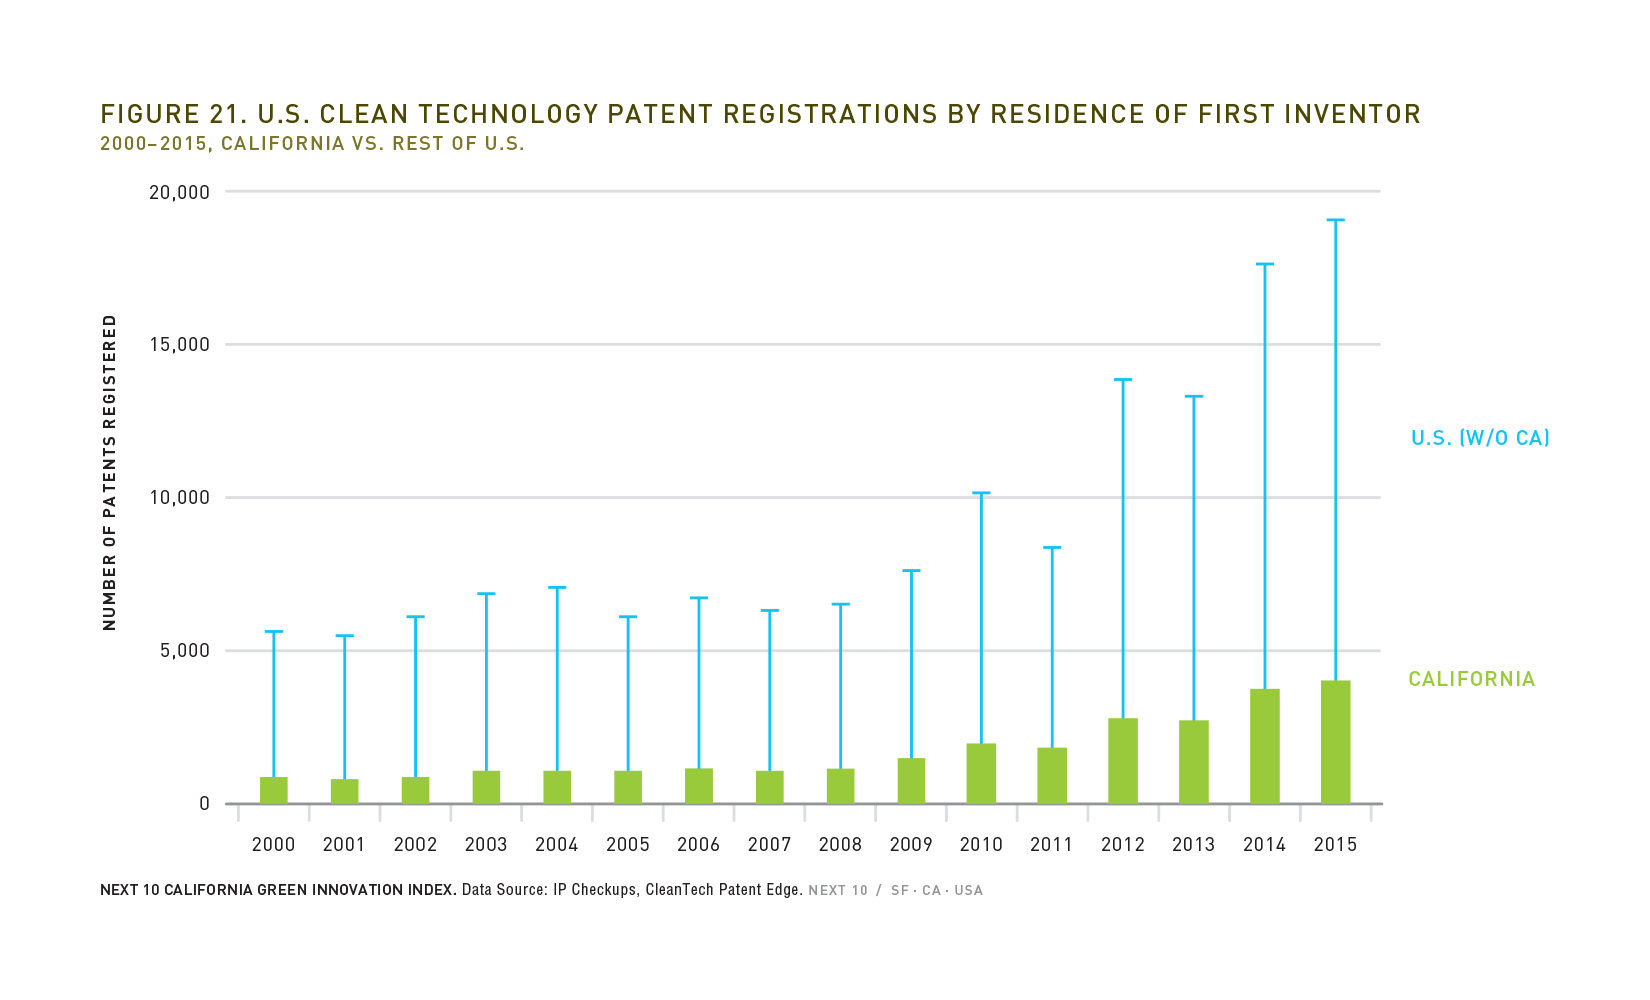
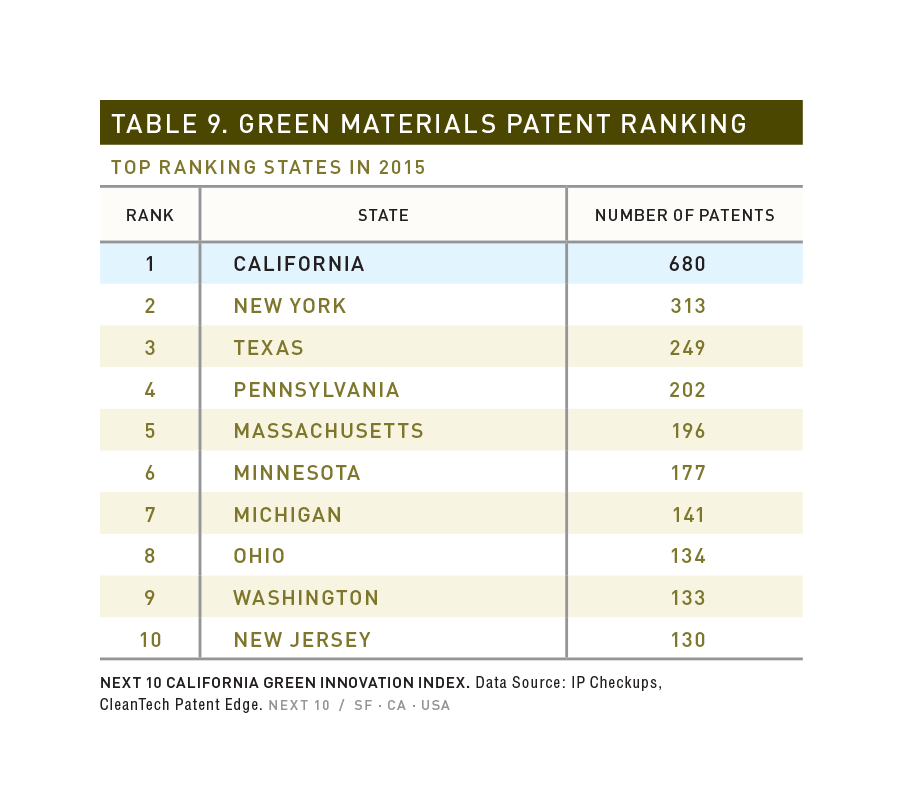
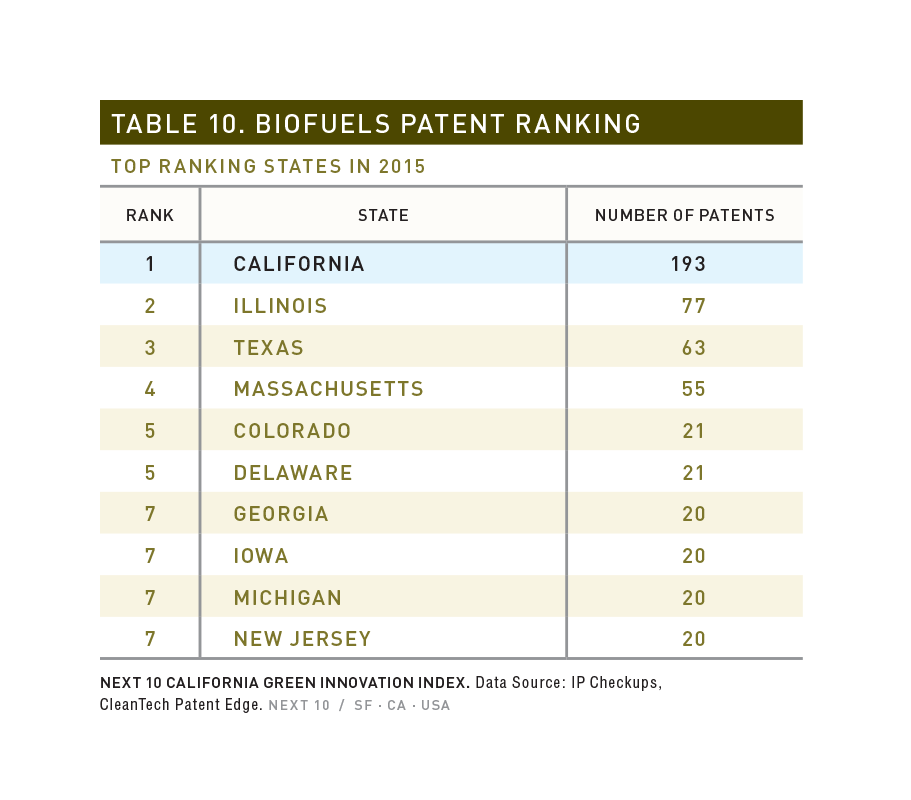
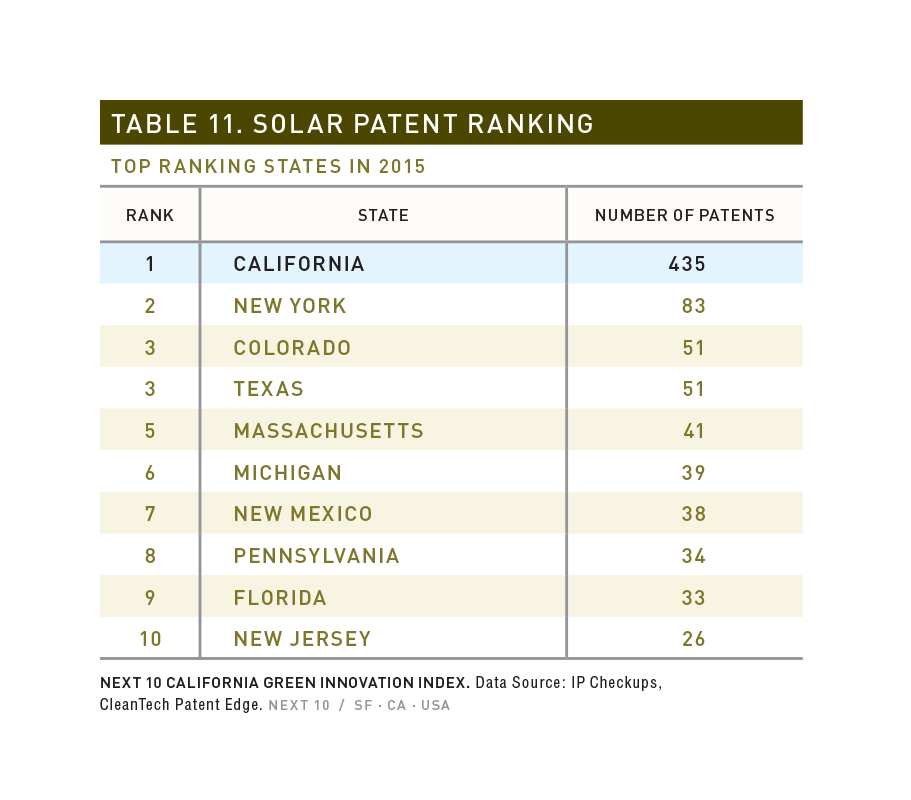
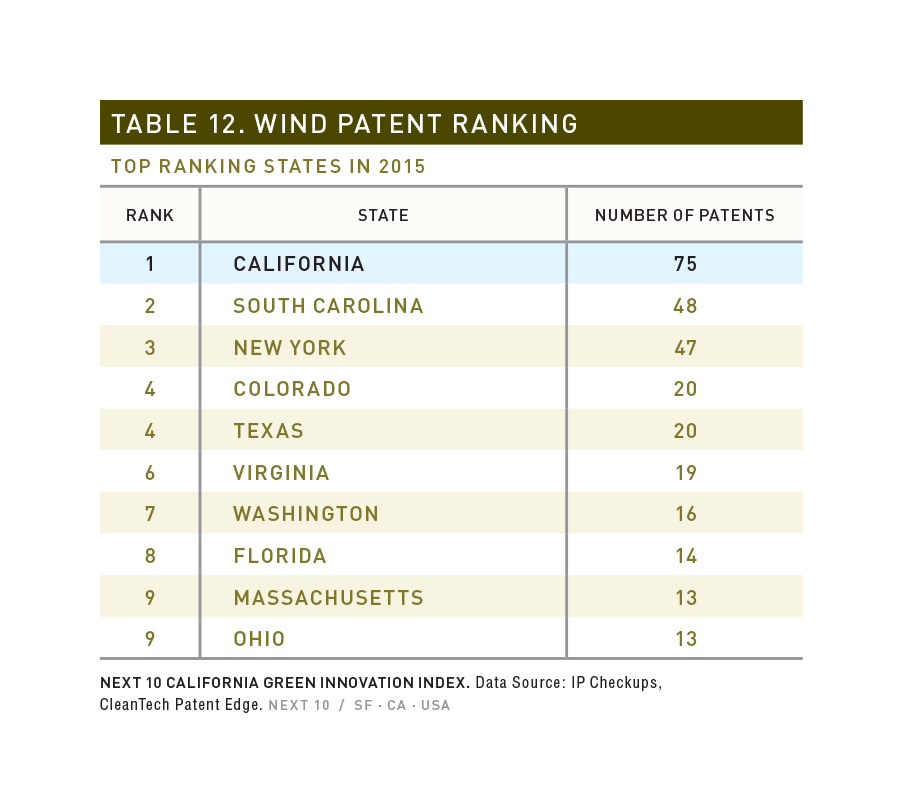
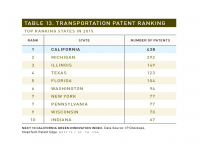
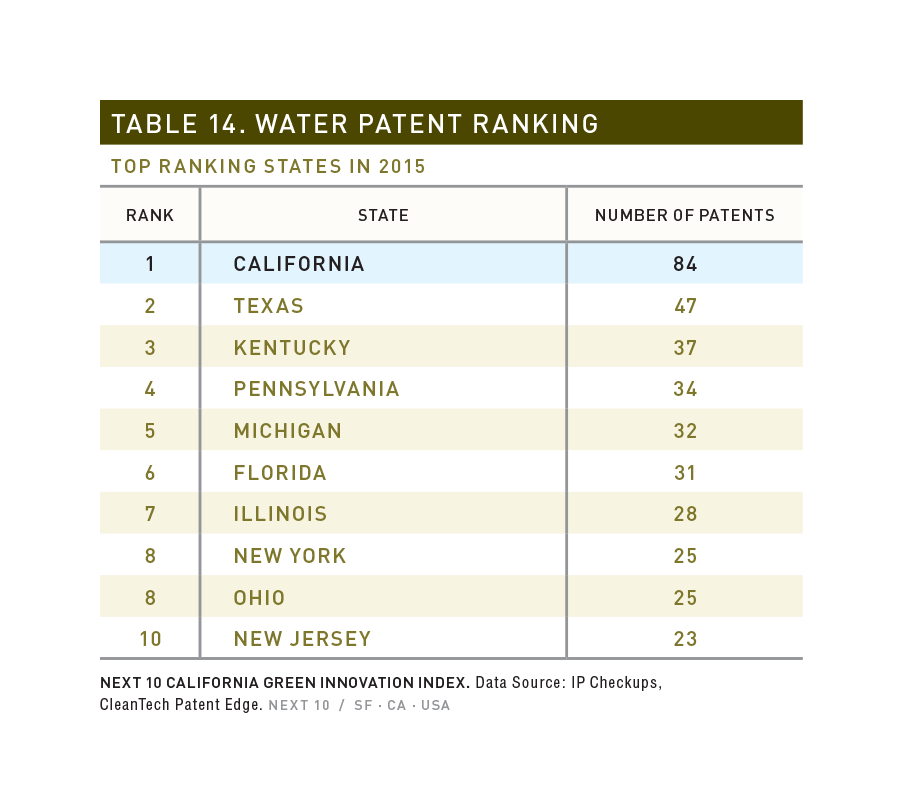
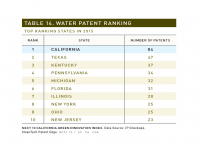
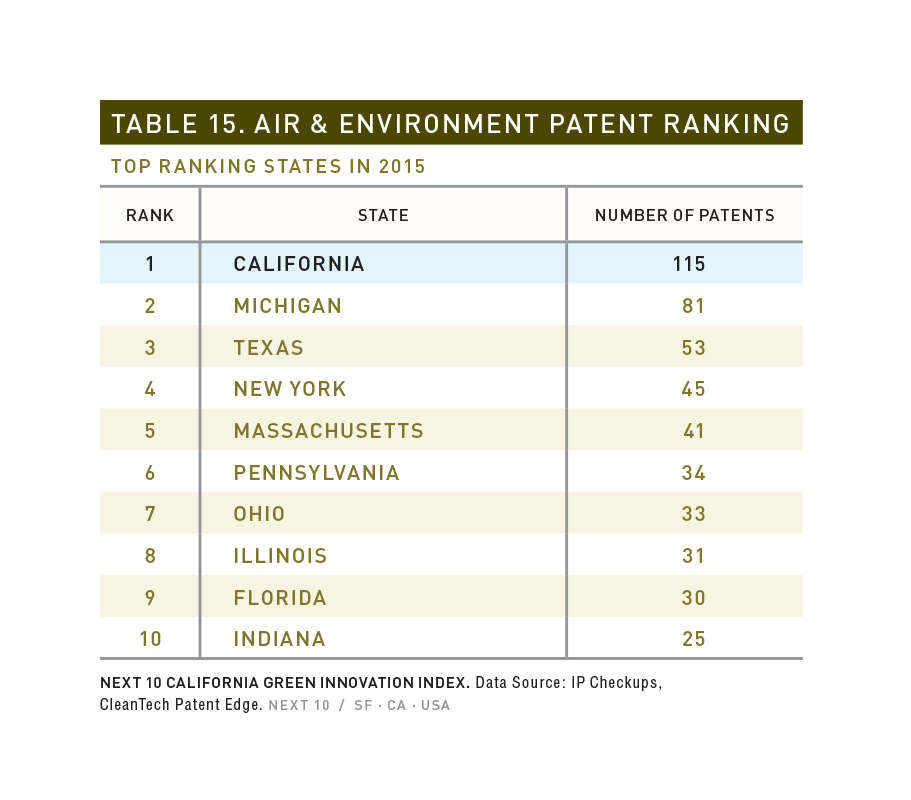
- In 2015, California patent registrations topped the nation in all major clean technology categories, registered more than five times the solar patents than the 2nd ranked state (New York), and generated over 25 percent of all energy efficiency patents in the U.S.
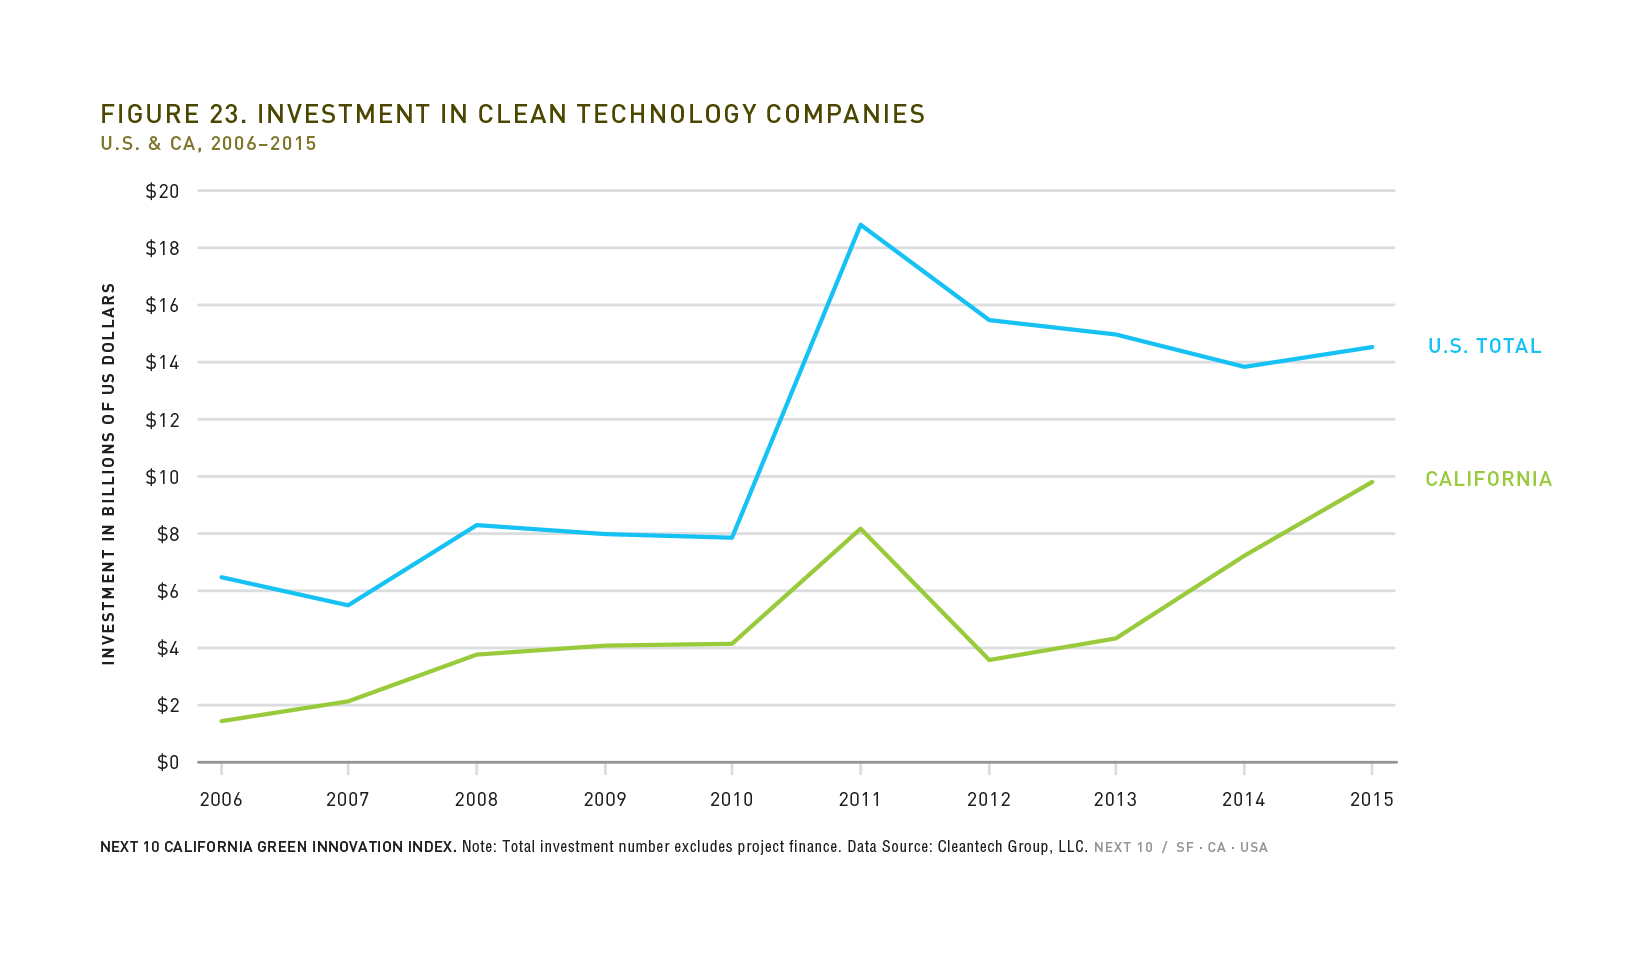
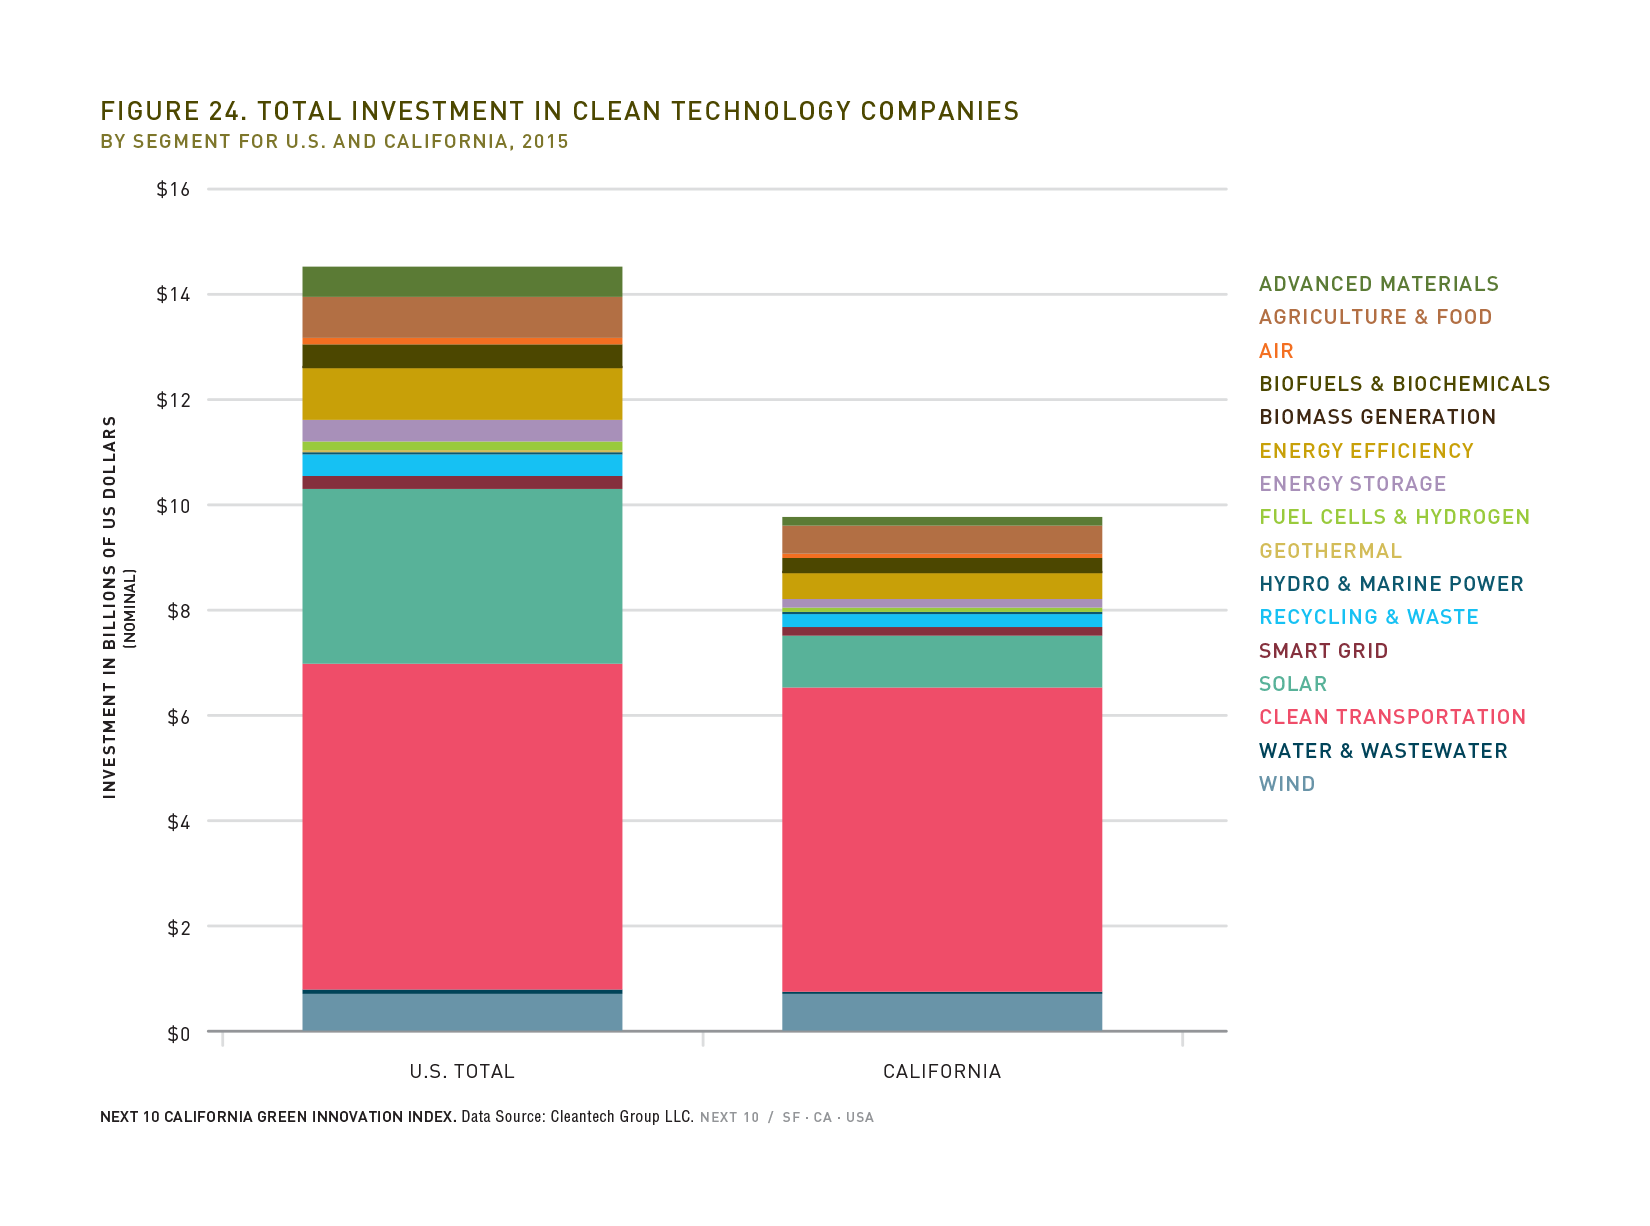
- California clean tech companies received 68% ($9.8 billion) of total US clean tech investment ($14.5 billion) in 2015.
- Clean transportation was the hottest sector for venture capital investment in California, bringing in $3.4 billion in 2015. This was 90.5 percent of all clean transportation venture capital investment in the nation.
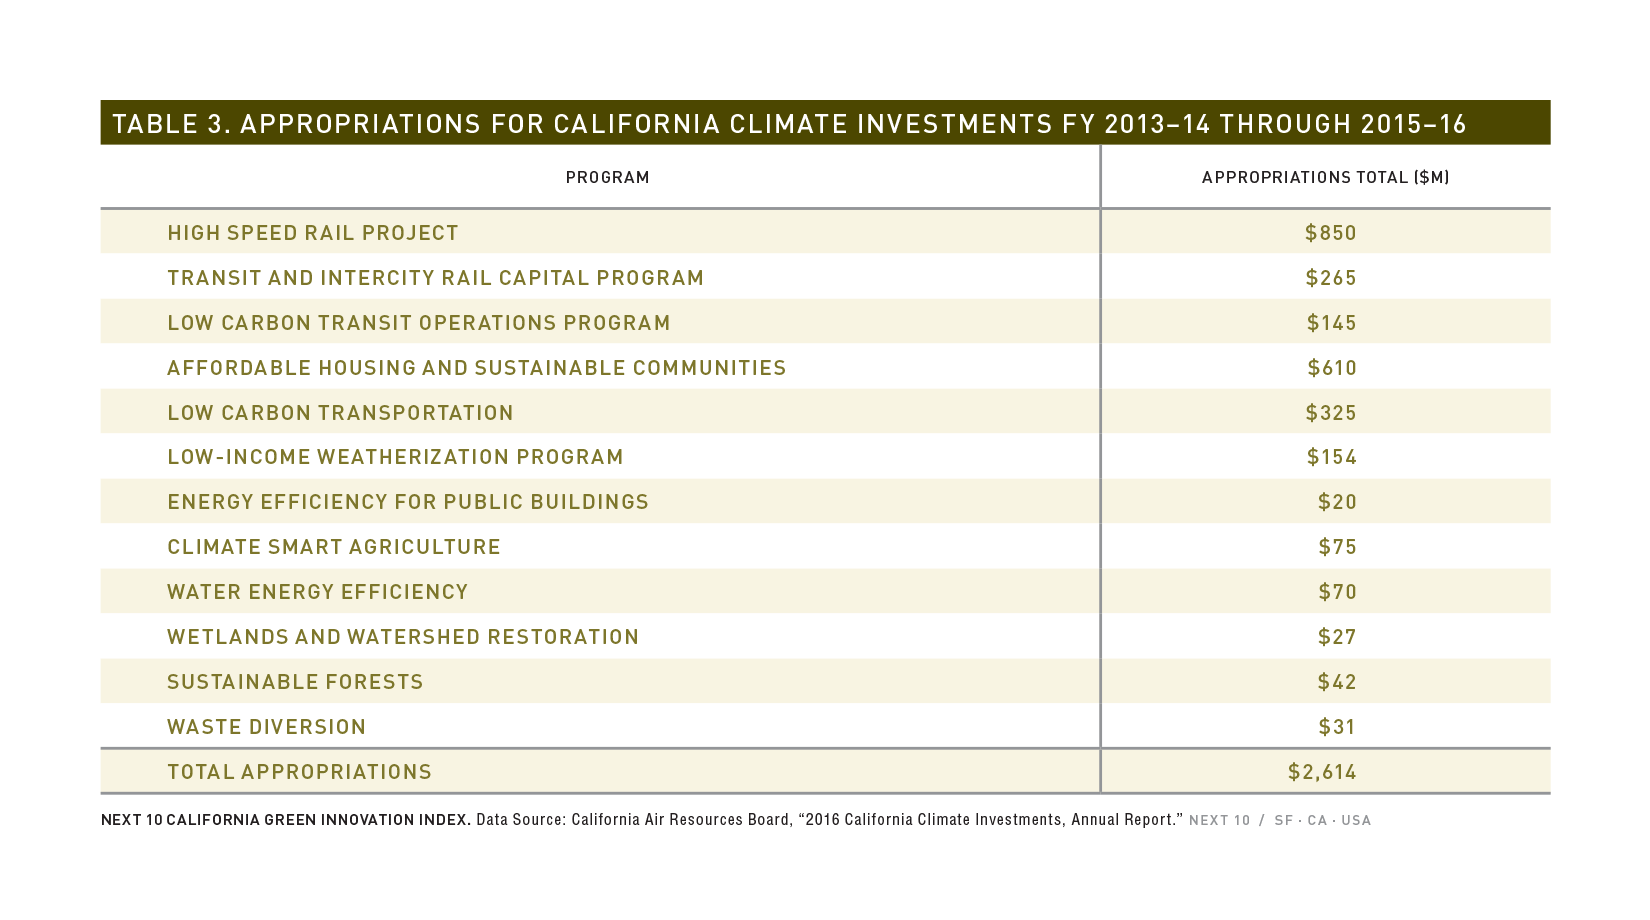
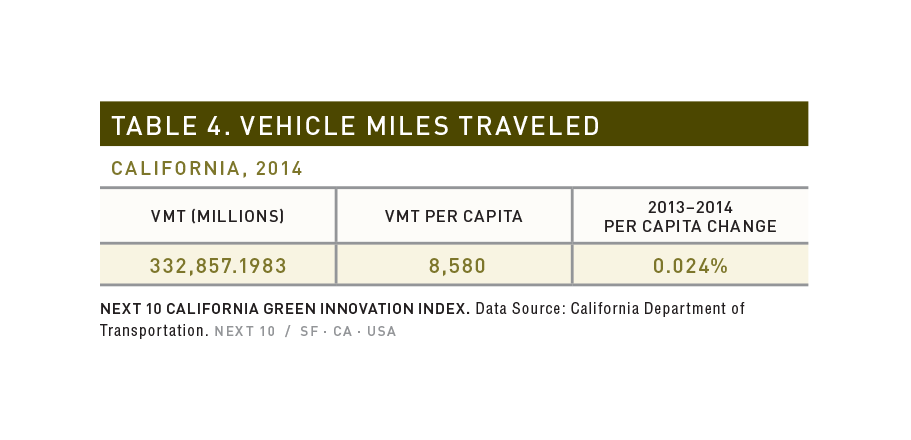
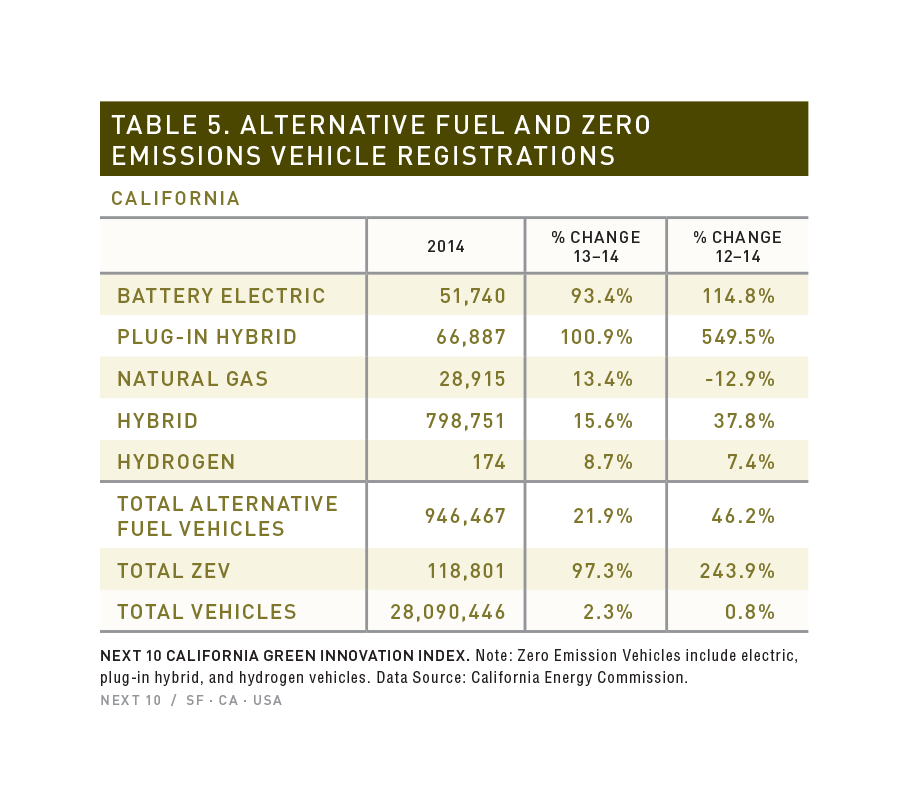
Transportation:
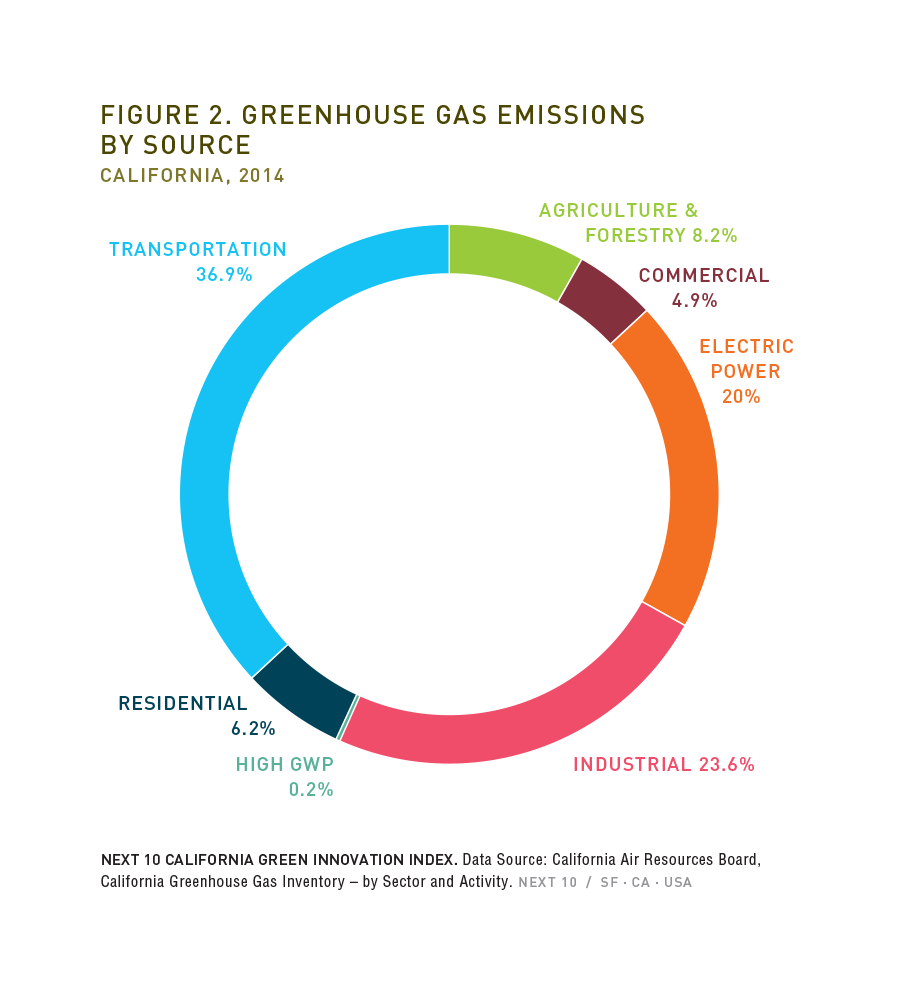
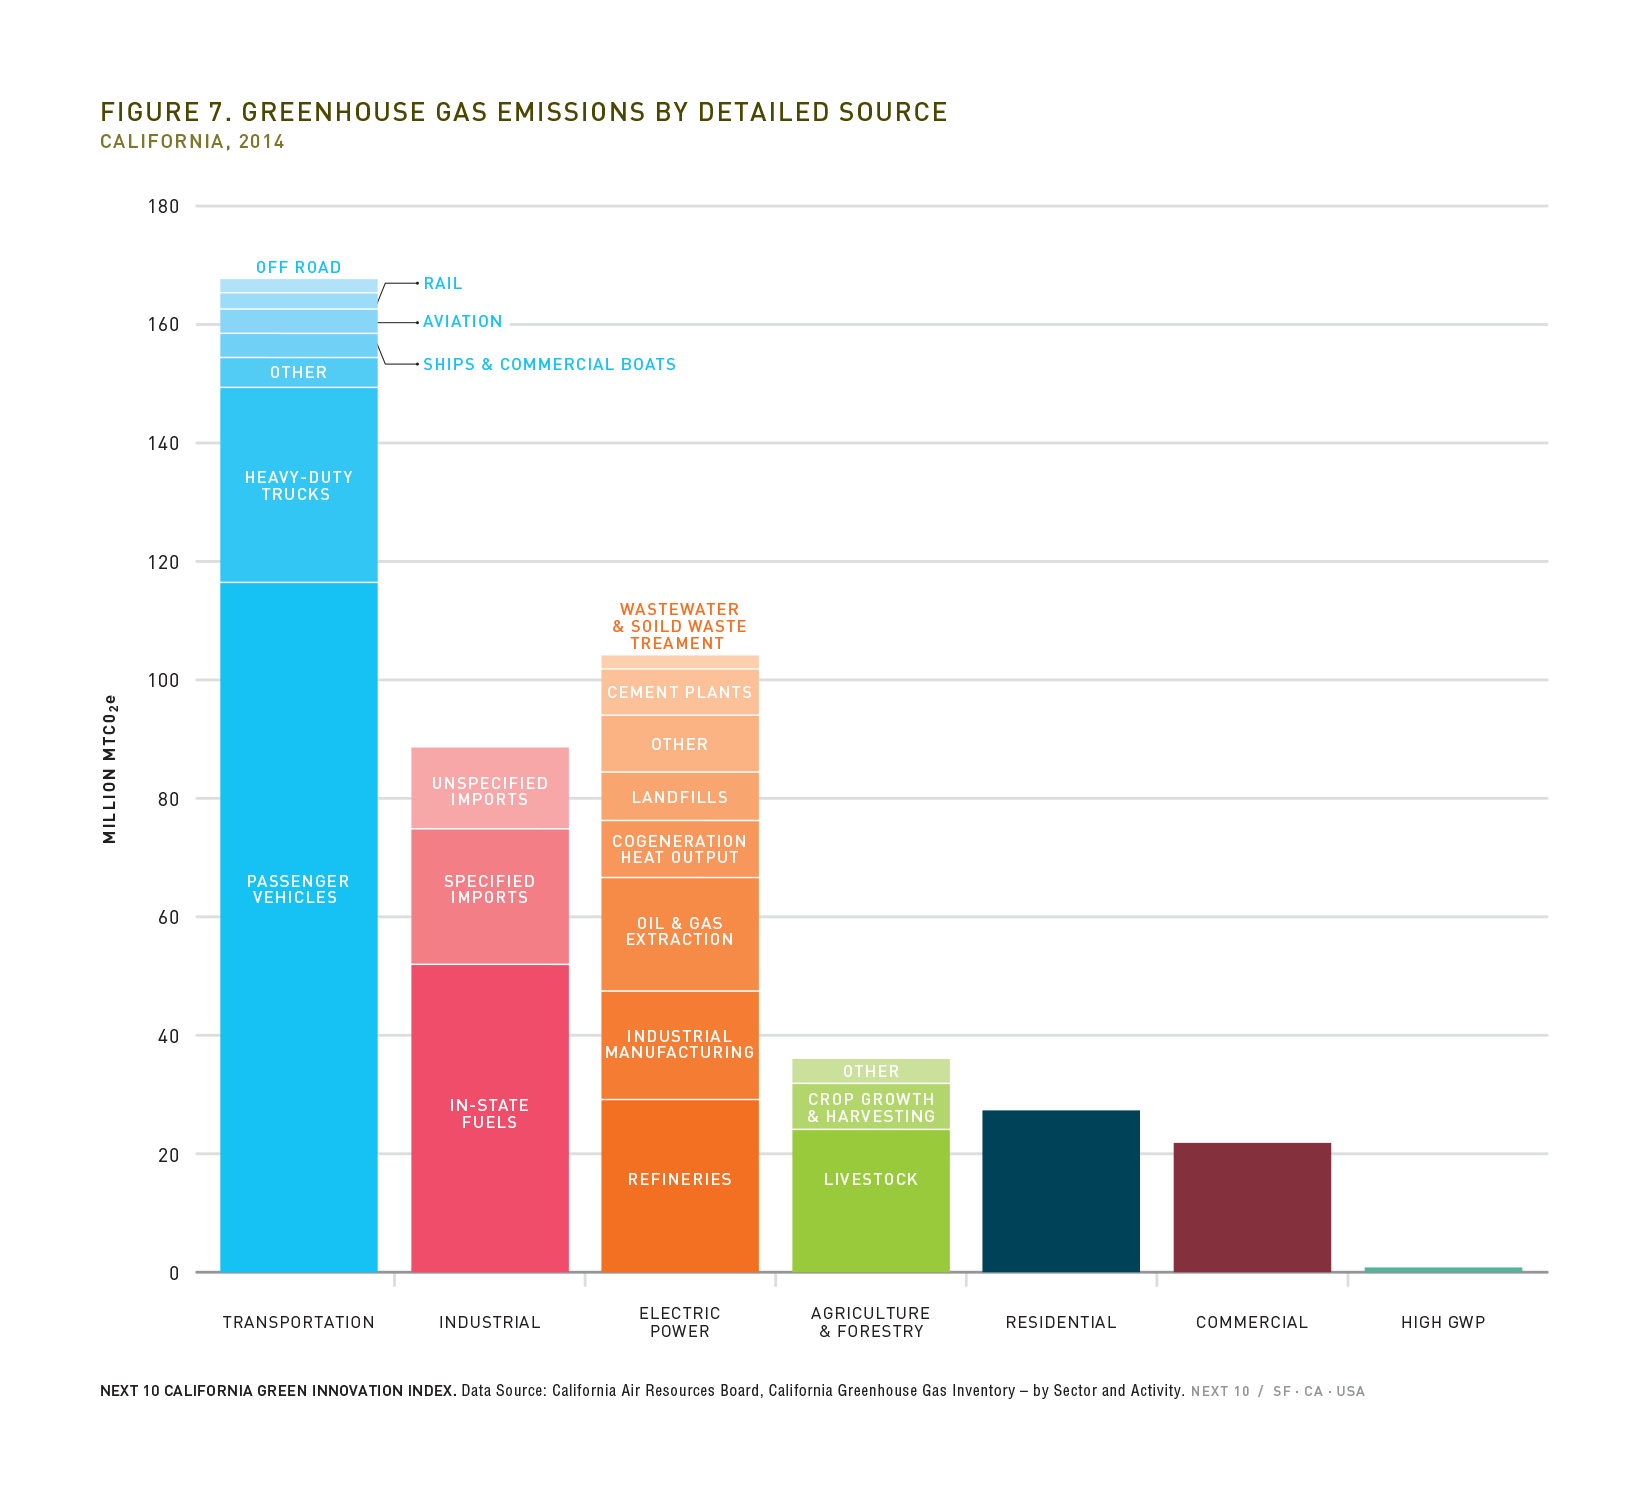
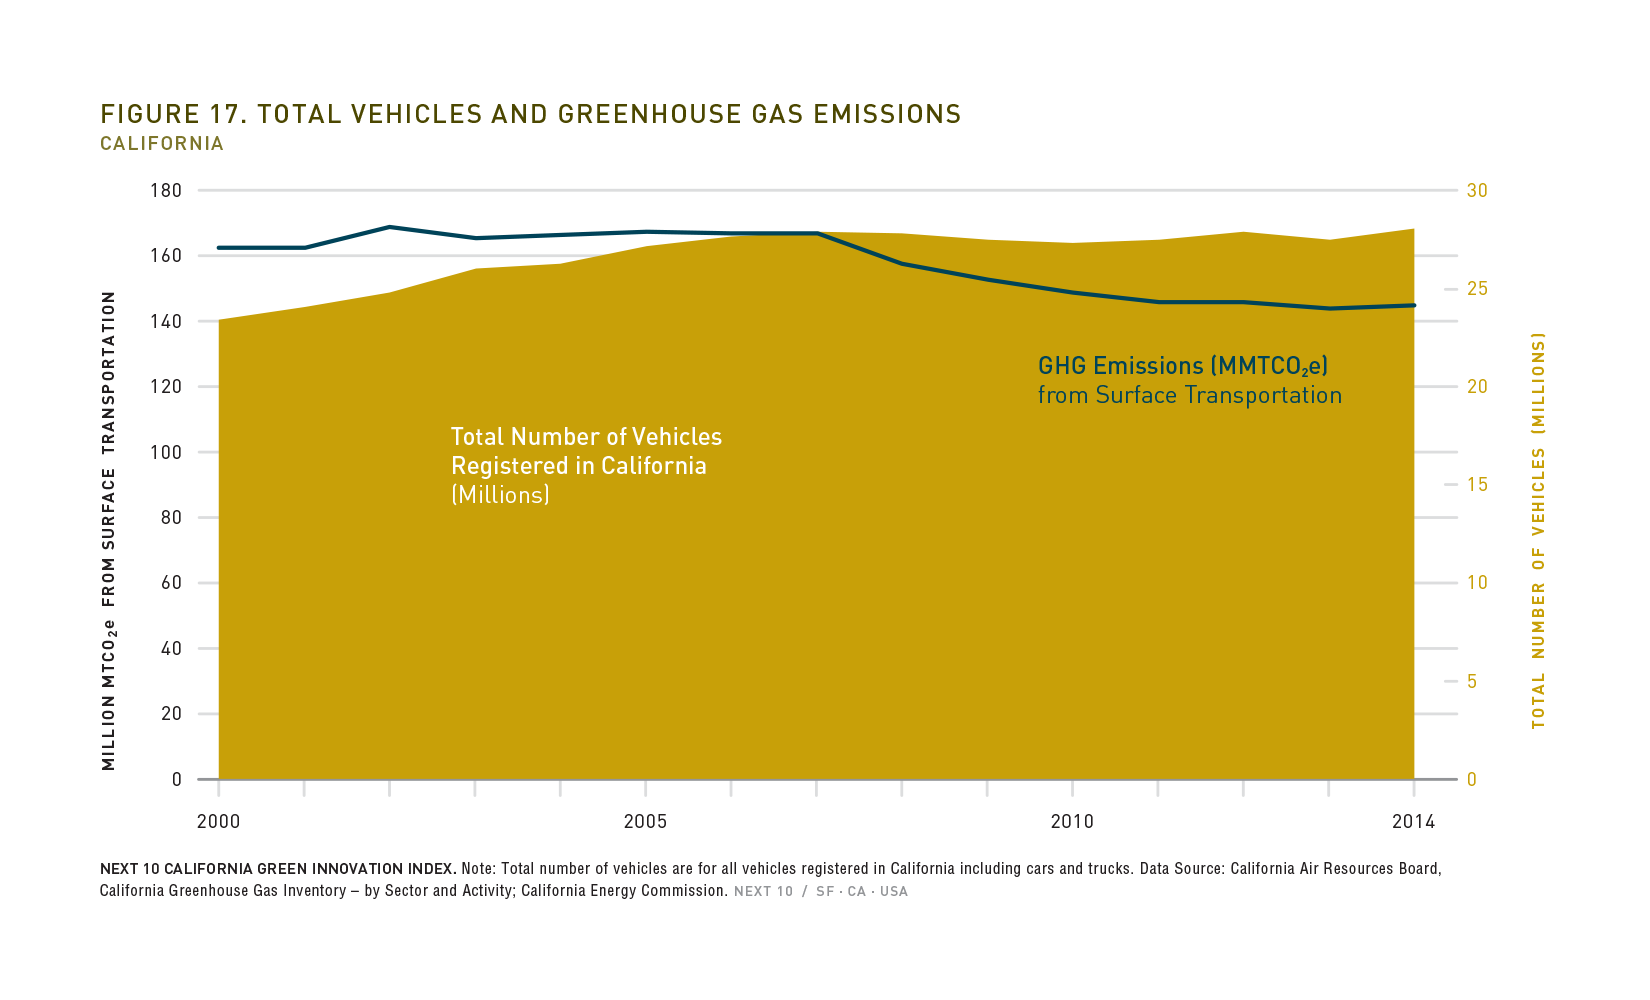
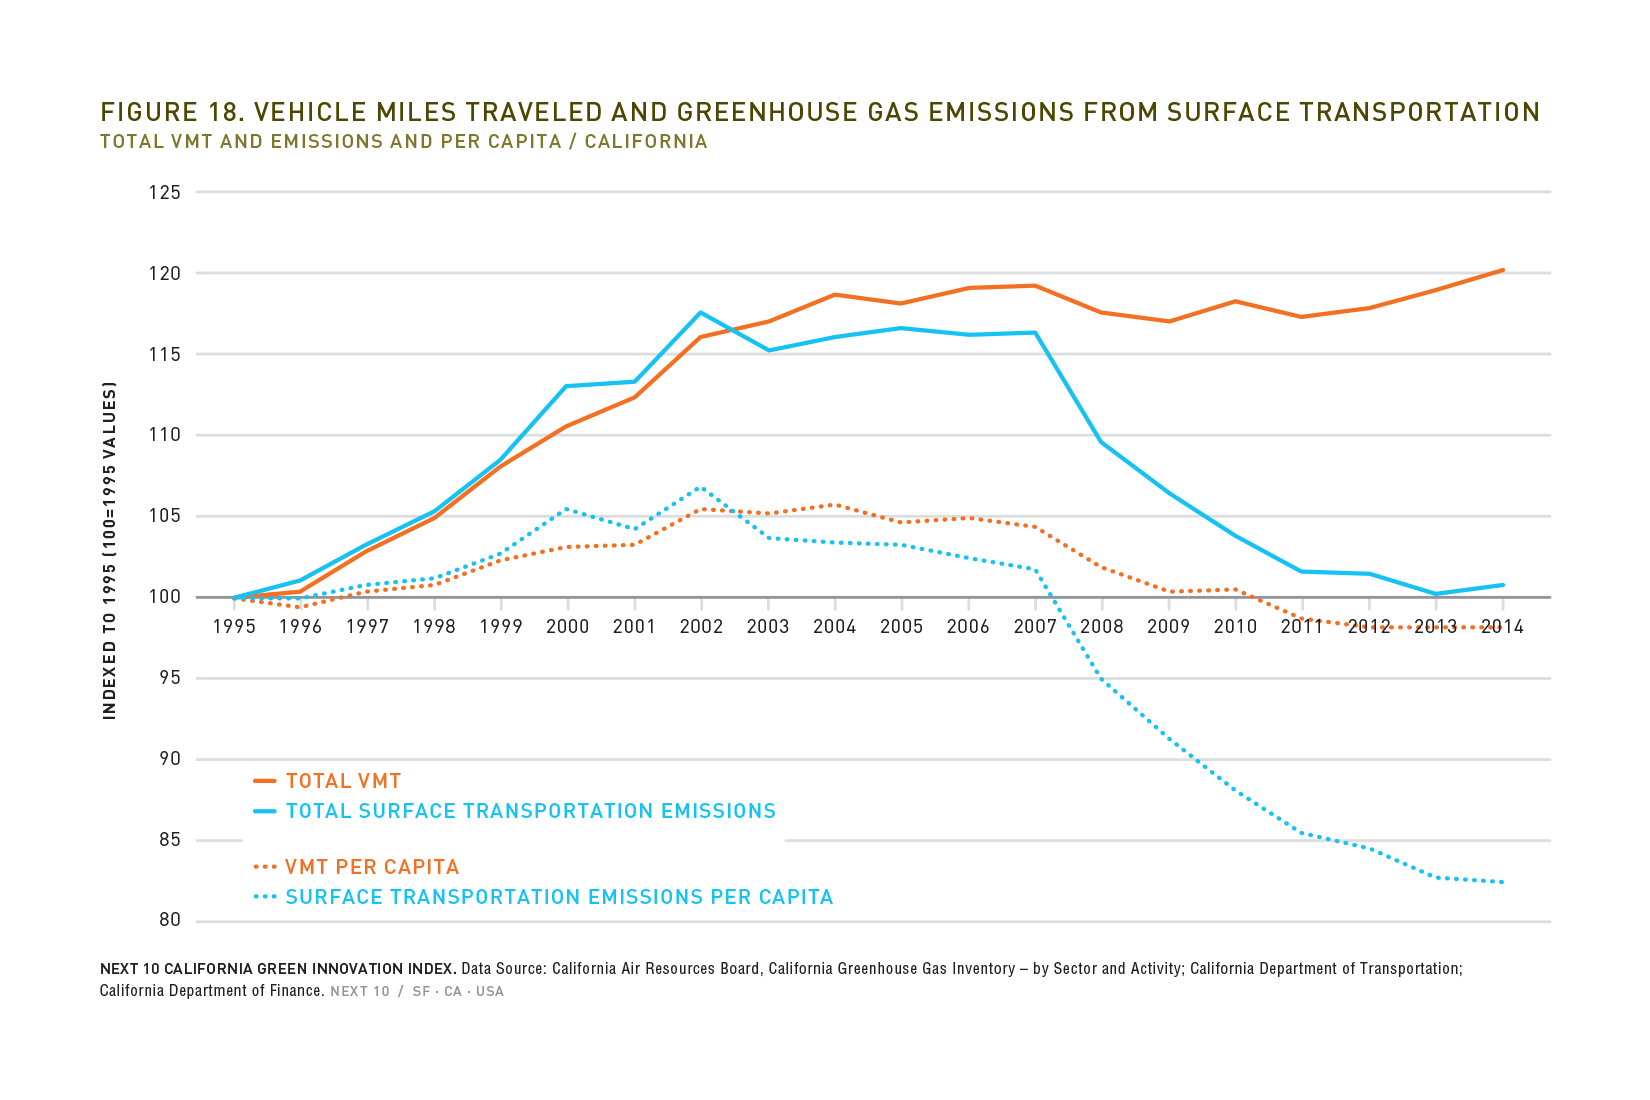
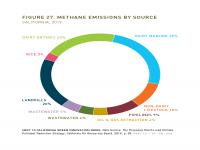
- Transportation remains the largest producer of California's greenhouse gas emissions at 36.9 percent for 2014.
- The total number of vehicle registrations in California increased 2.2 between 2011 and 2014, yet greenhouse gas emissions from surface transportation actually decreased .8 percent over the same period. The reduction in surface emissions since 2011 means California drivers have avoided emitting the equivalent of 126 million gallons of gasoline, equal to taking 236,582 passenger vehicles off the road for one year.
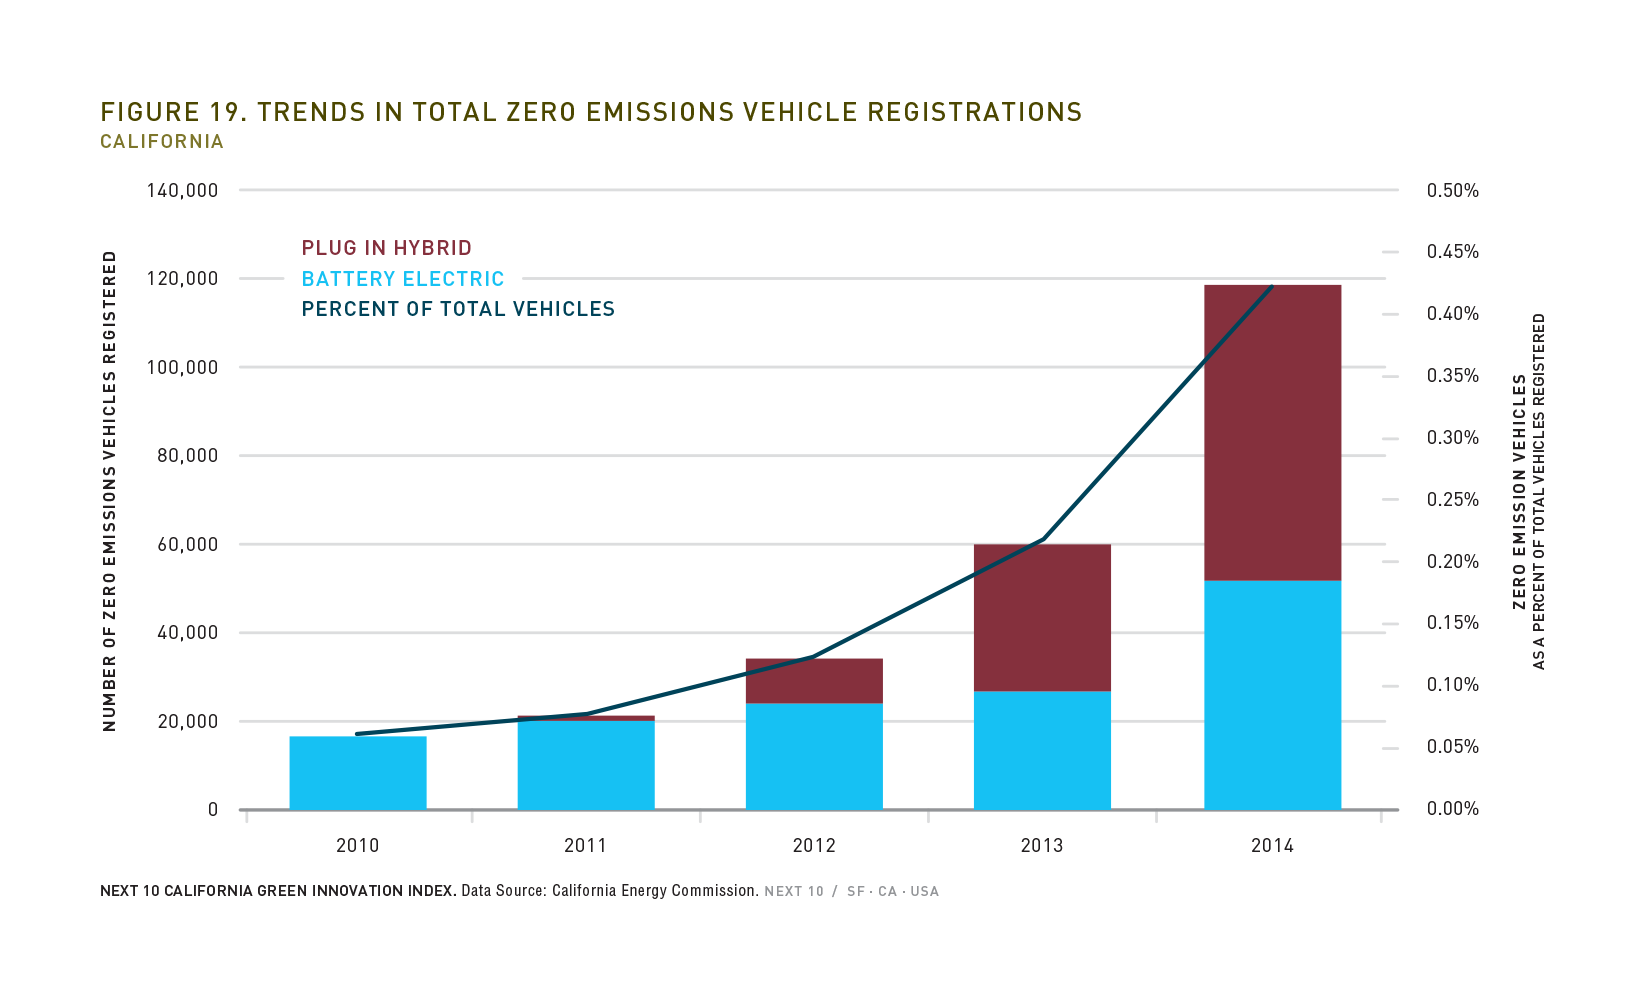
- Zero emission vehicle registrations increased by 244 percent between 2012 and 2014, driven by a 115 percent increase in all-electric vehicles and a 550 percent increase in plug-in hybrid vehicles.
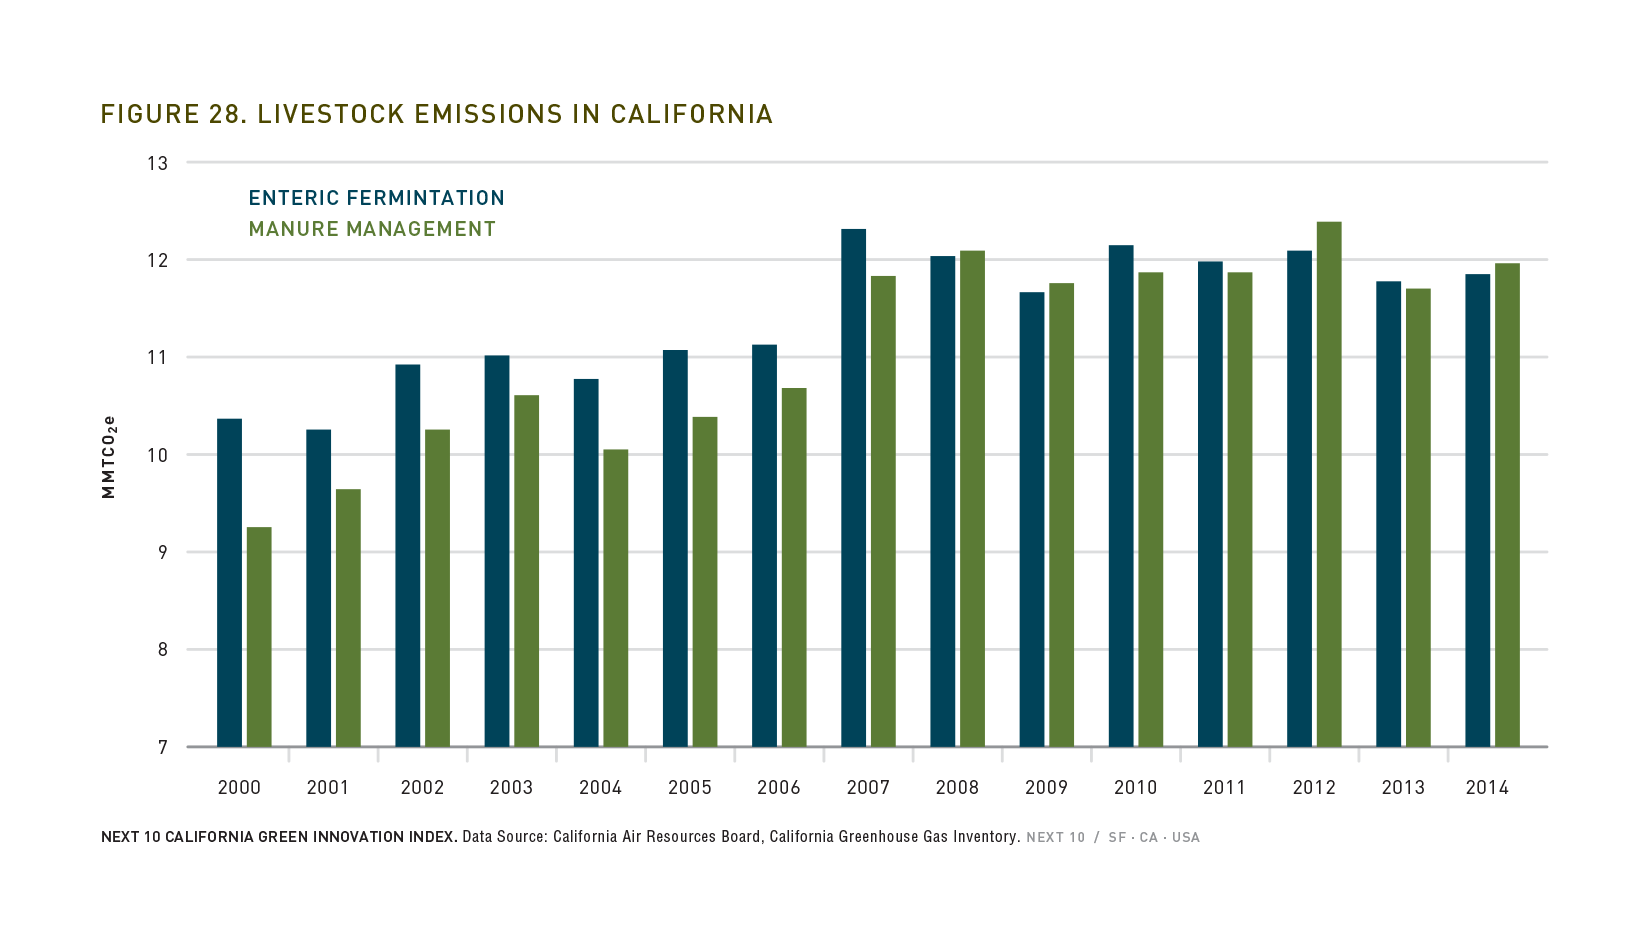
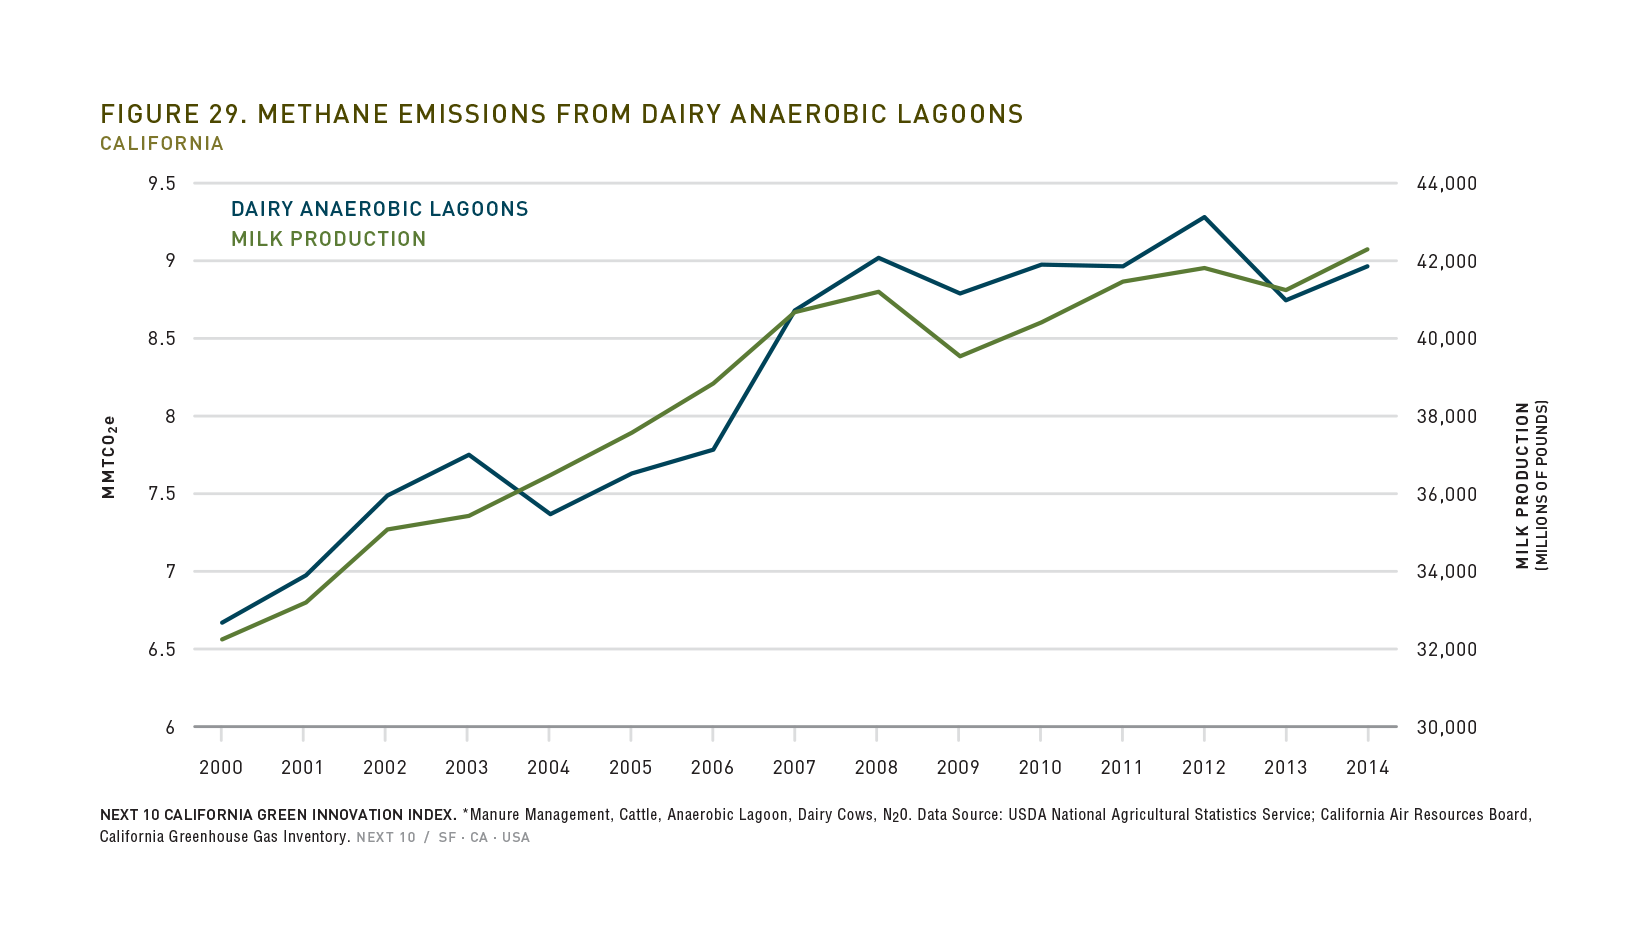
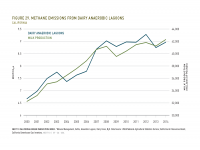
Agriculture:
- From 2000 to 2014, GHG emissions attributed to livestock manure management increased 22.6 percent, while emissions from dairy anaerobic lagoons increased 34.3 percent.
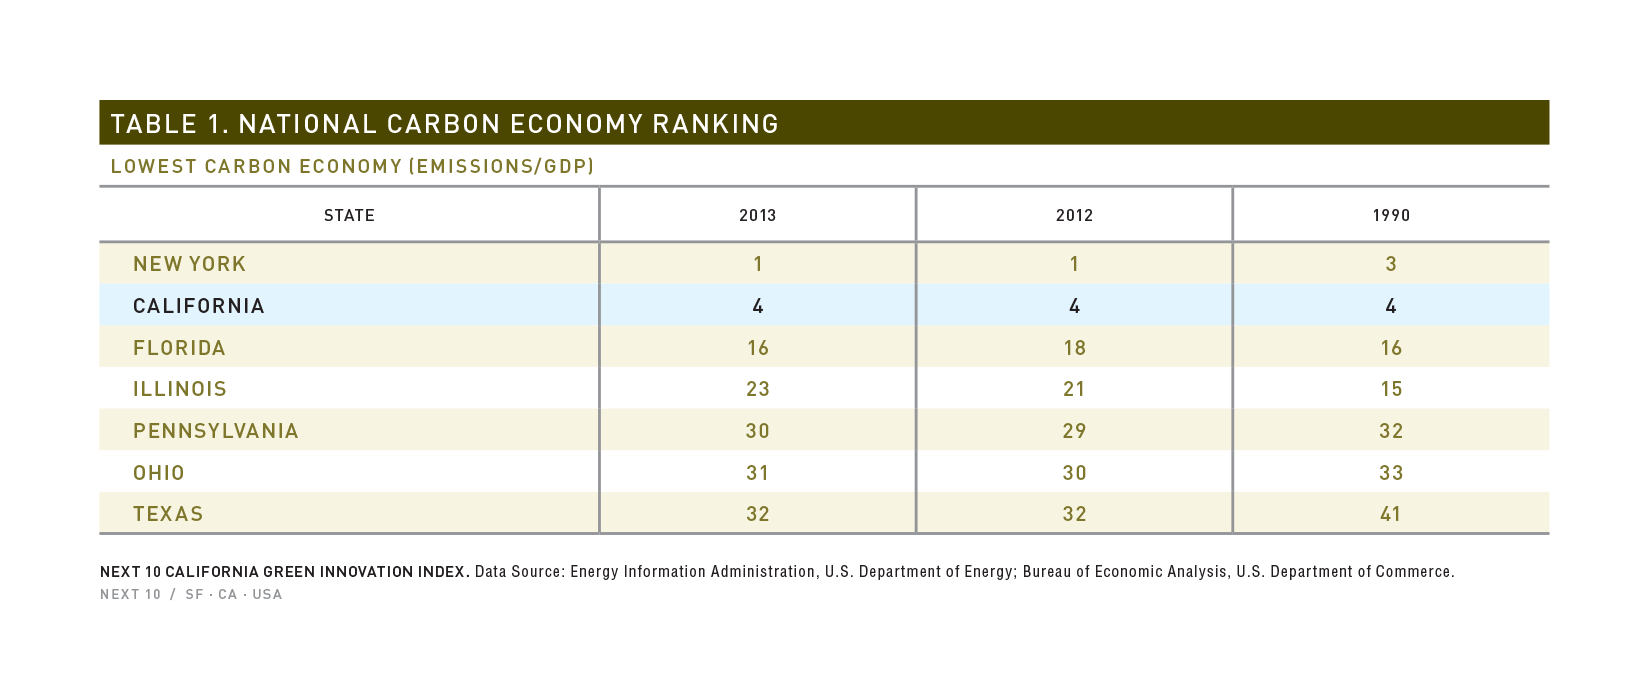
International Rankings:
- If California were a country, it would rank 4th in the world for energy productivity in 2013, climbing from 5th place in 2012.
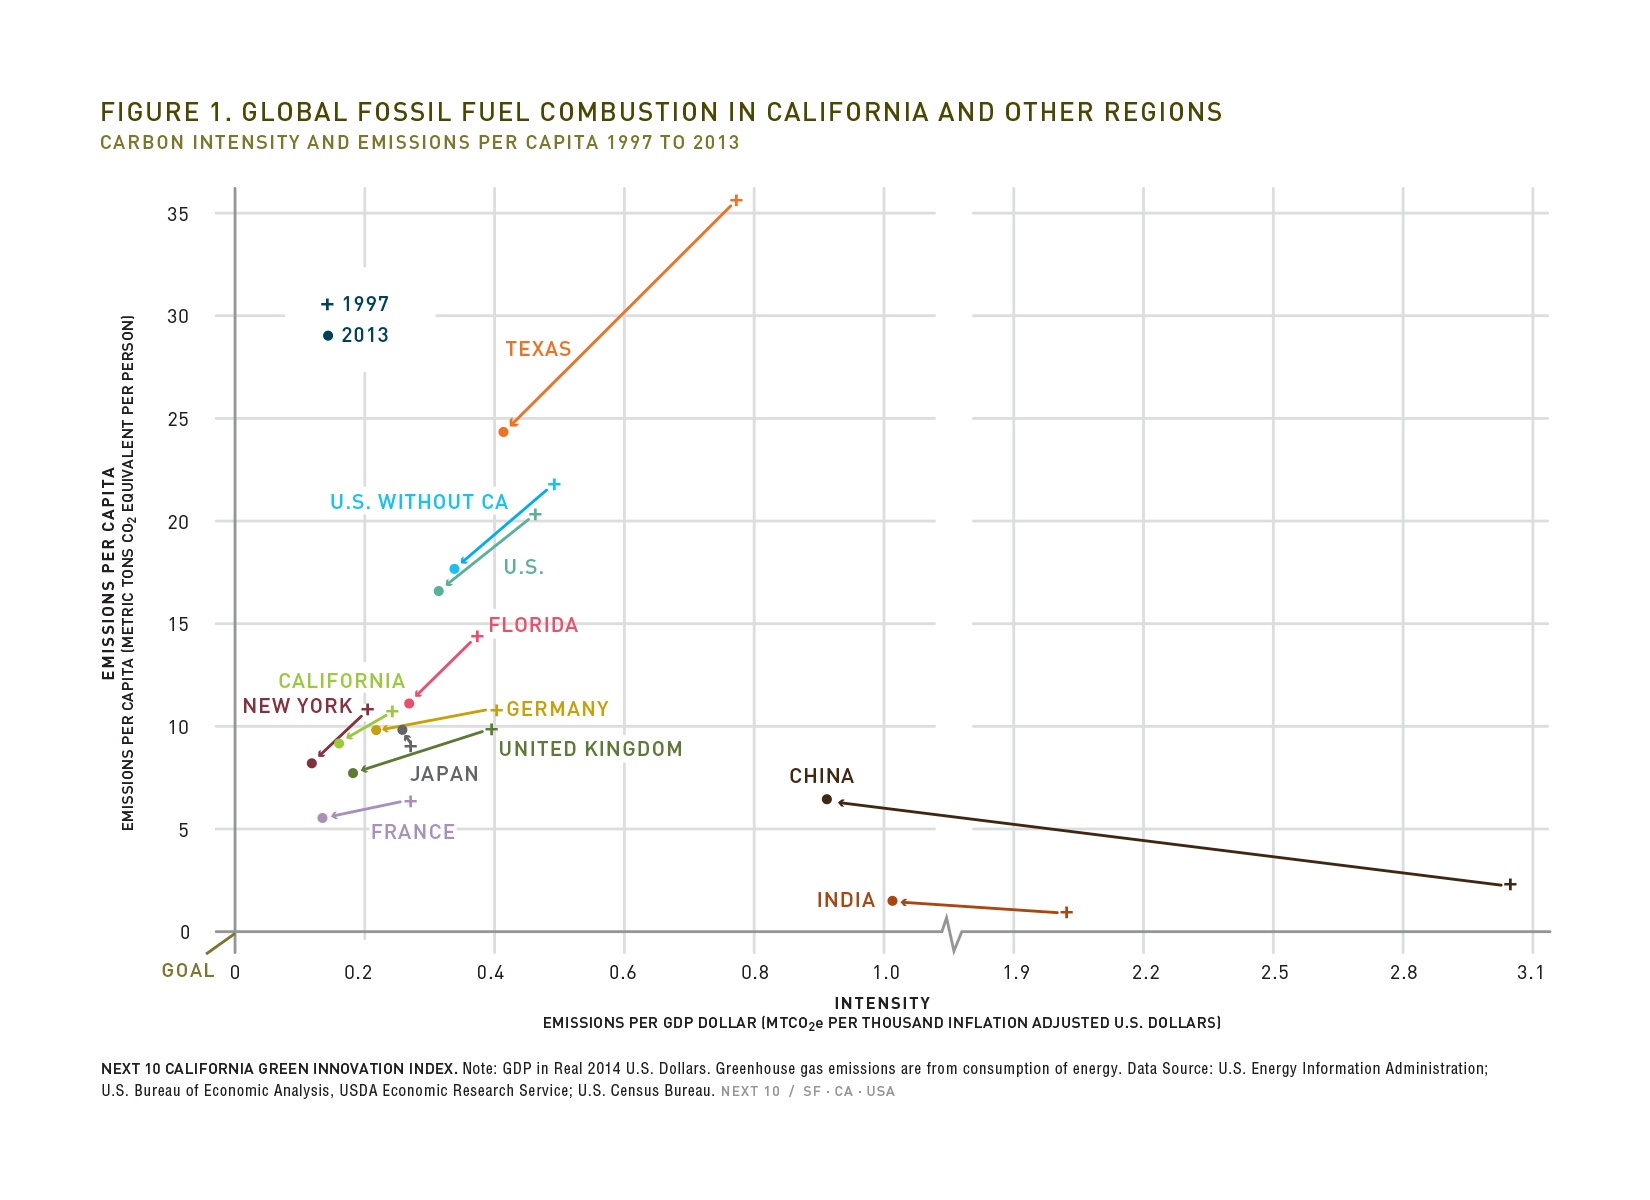
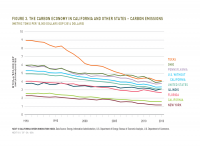
- The world's three least carbon intensive economies (France, California, and Italy, respectively) held their spots in 2013 while continuing to reduce their carbon intensity.
- California fell from the number eight spot in 2012 to the number nine spot in 2013 for total renewable electricity generation, as global renewable energy generation increased.
Next 10 owns the copyright to all graphics in this section, and they are available for download and limited use, subject to our Terms of Use. Please contact Next 10 at info@next10.org with any questions.