Publications
2019 California Green Innovation Index
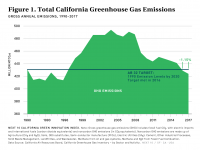
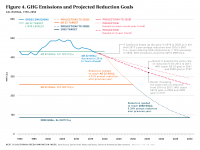
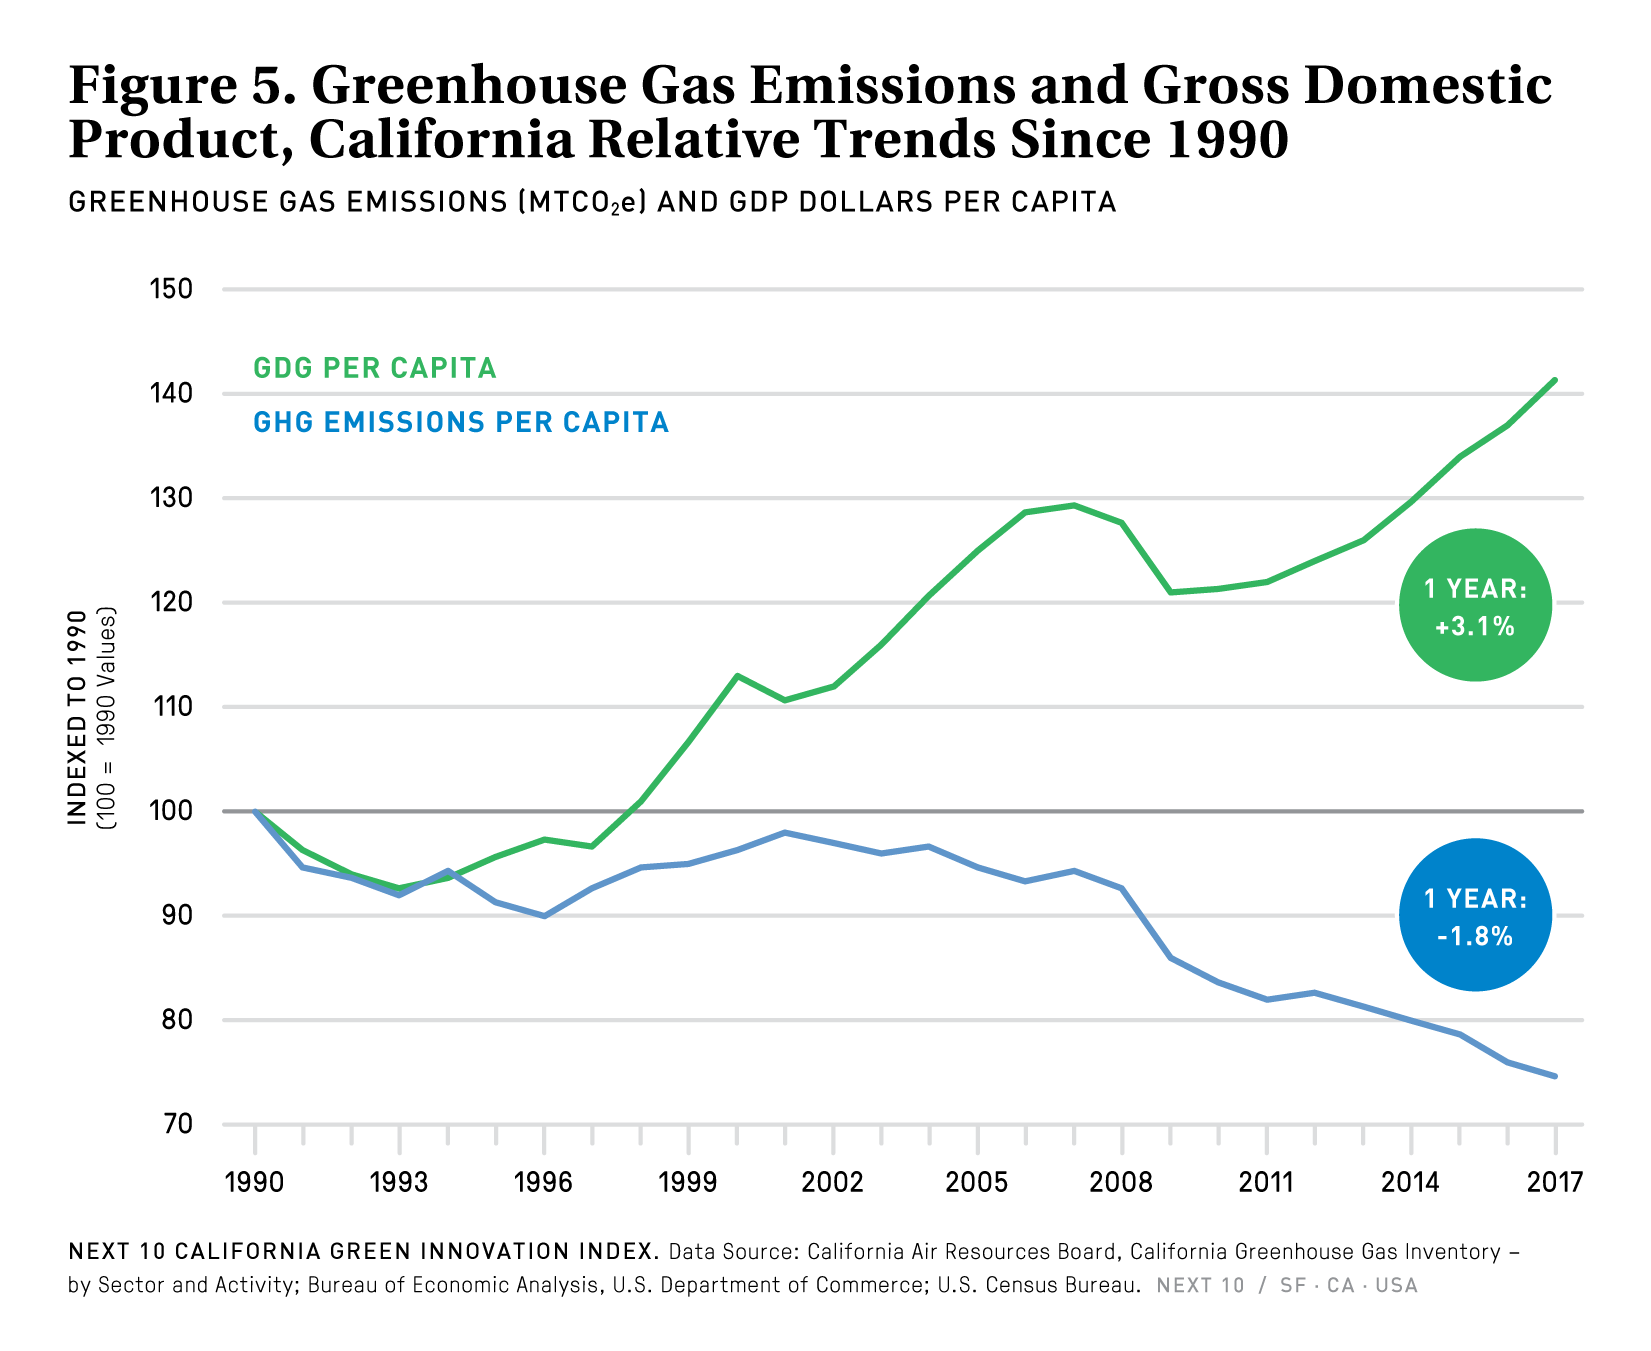
The 11th annual California Green Innovation Index finds California will meet its 2030 climate targets more than three decades late—in 2061—and could be more than 100 years late in meeting its 2050 target if the average rate of emissions reductions from the past year holds steady. The report finds that the state needs to reduce emissions by an average of 4.51 percent annually—a three-hold increase over the 1.15 percent reduction seen from 2016 to 2017—to meet the requirements of SB 32, which raised the state's emissions reduction goal to 40 percent below 1990 levels by 2030.
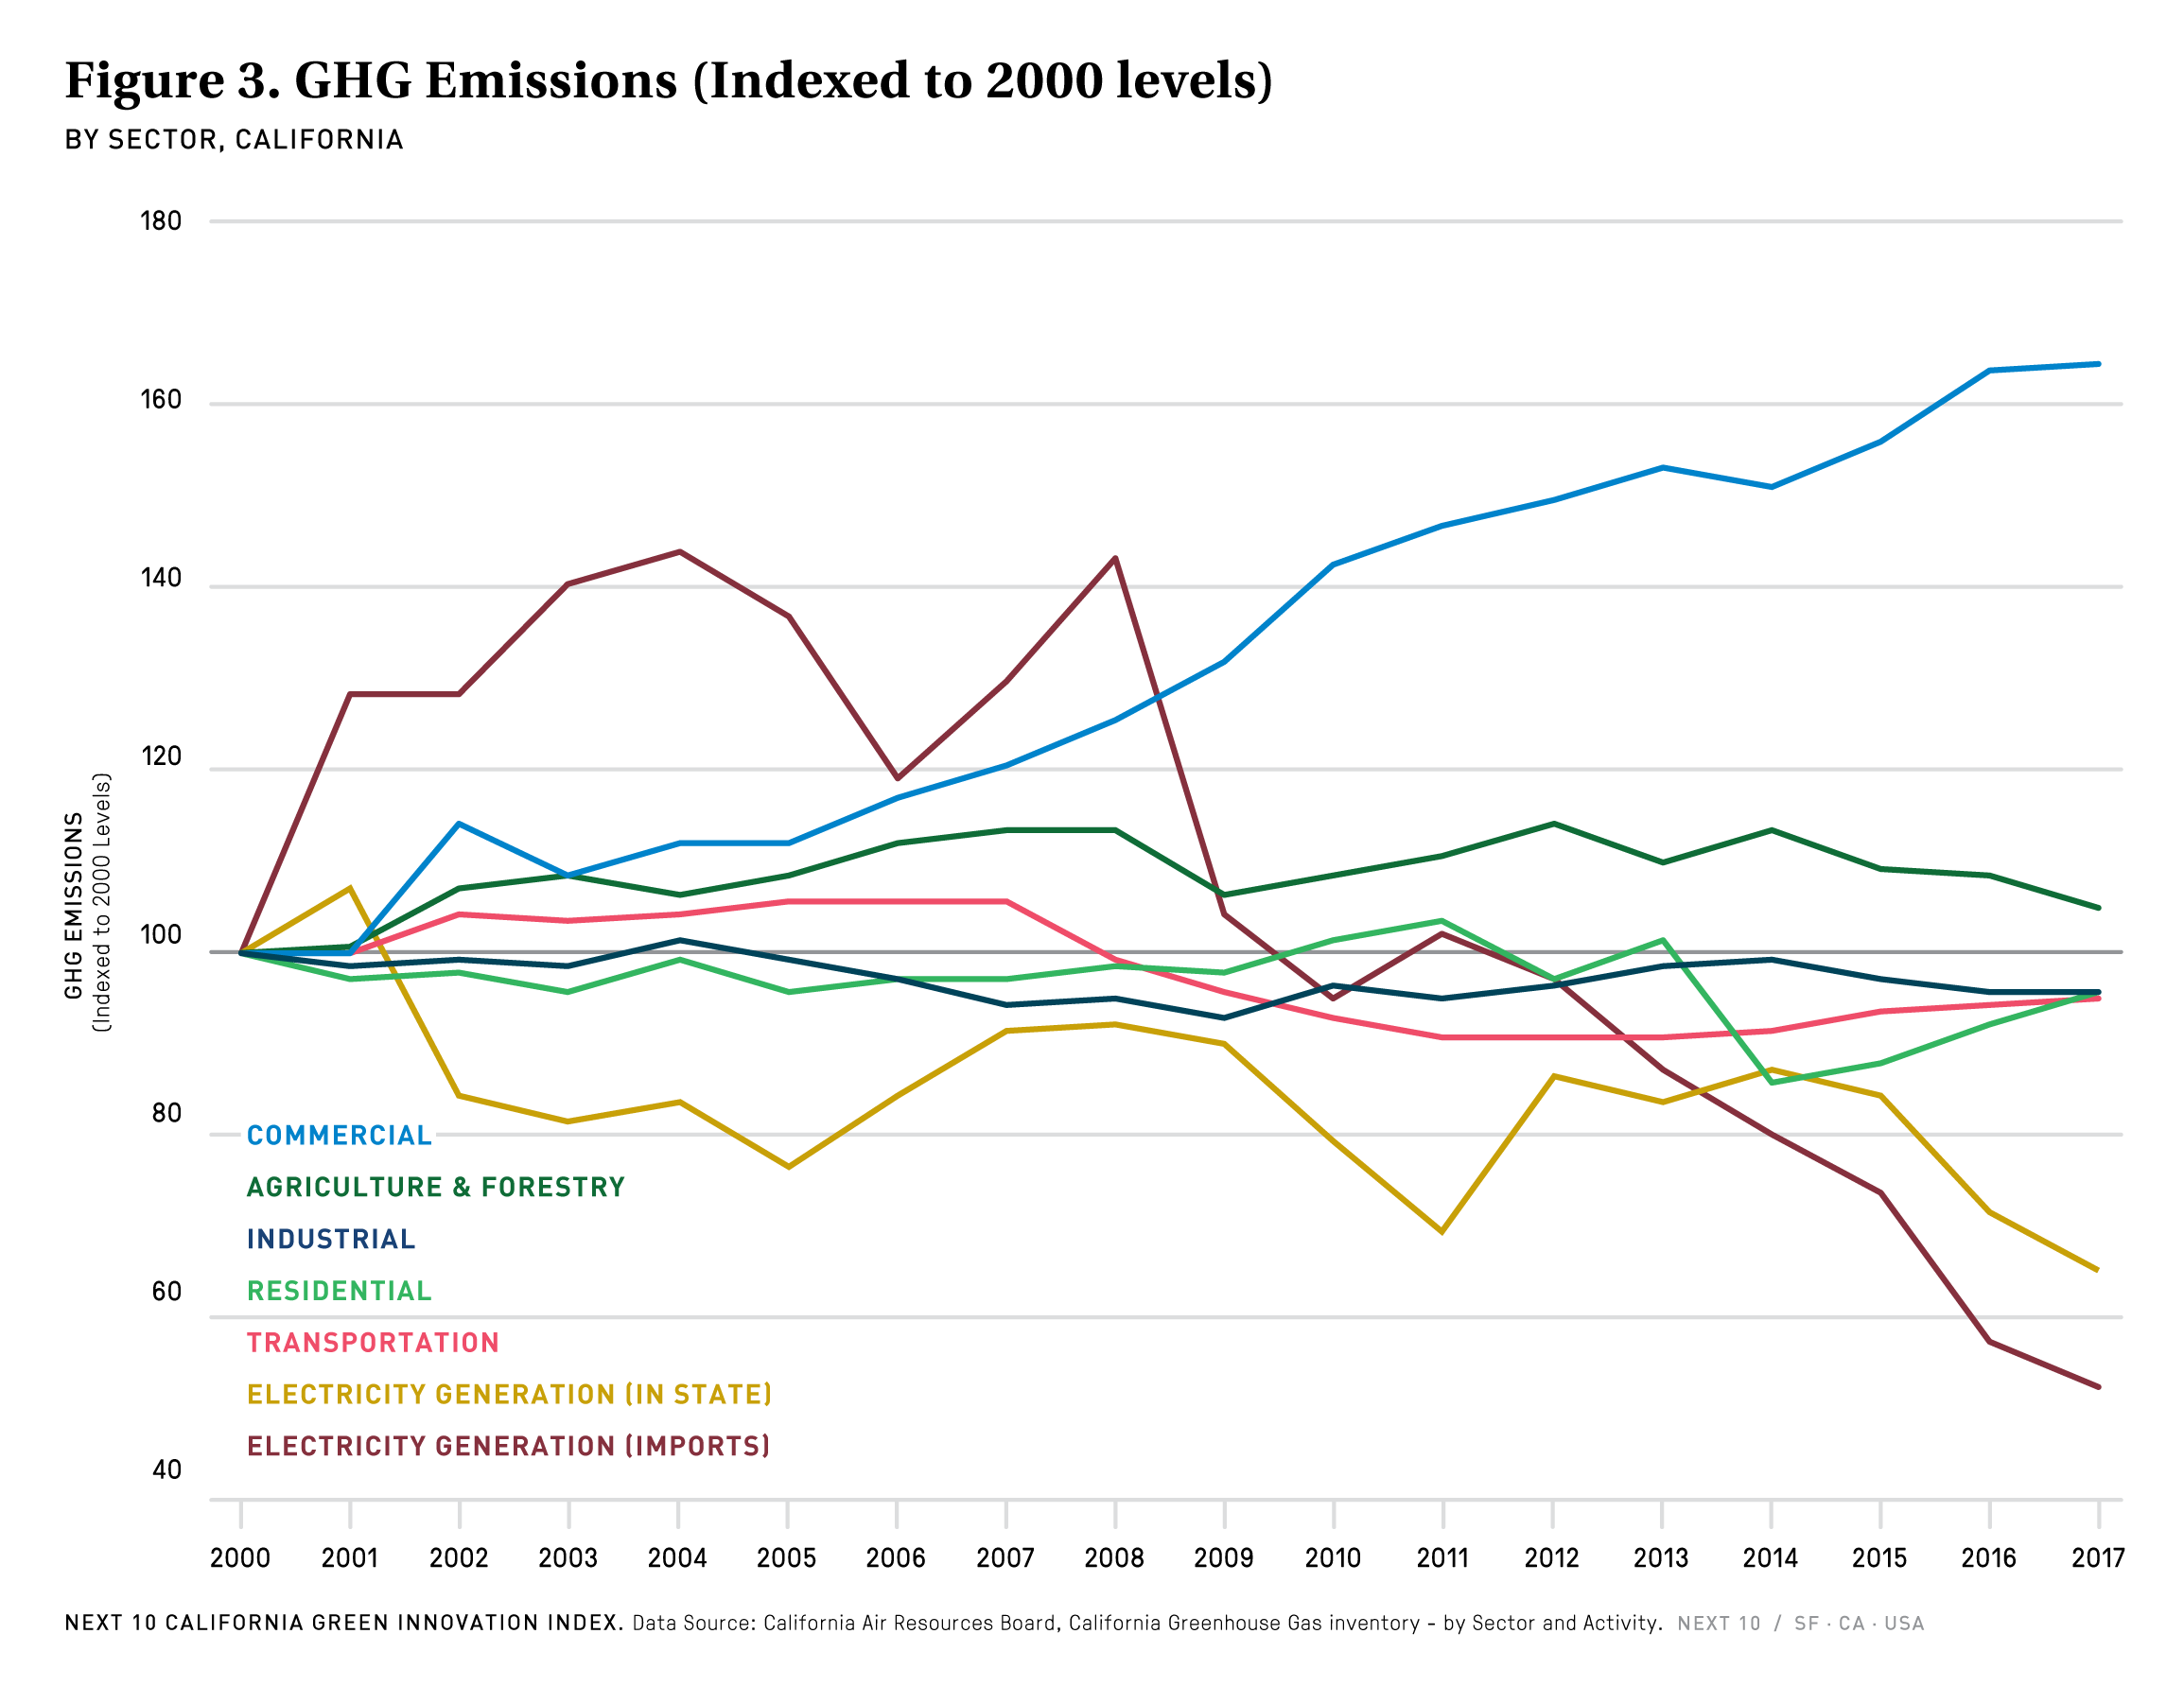
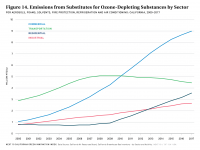
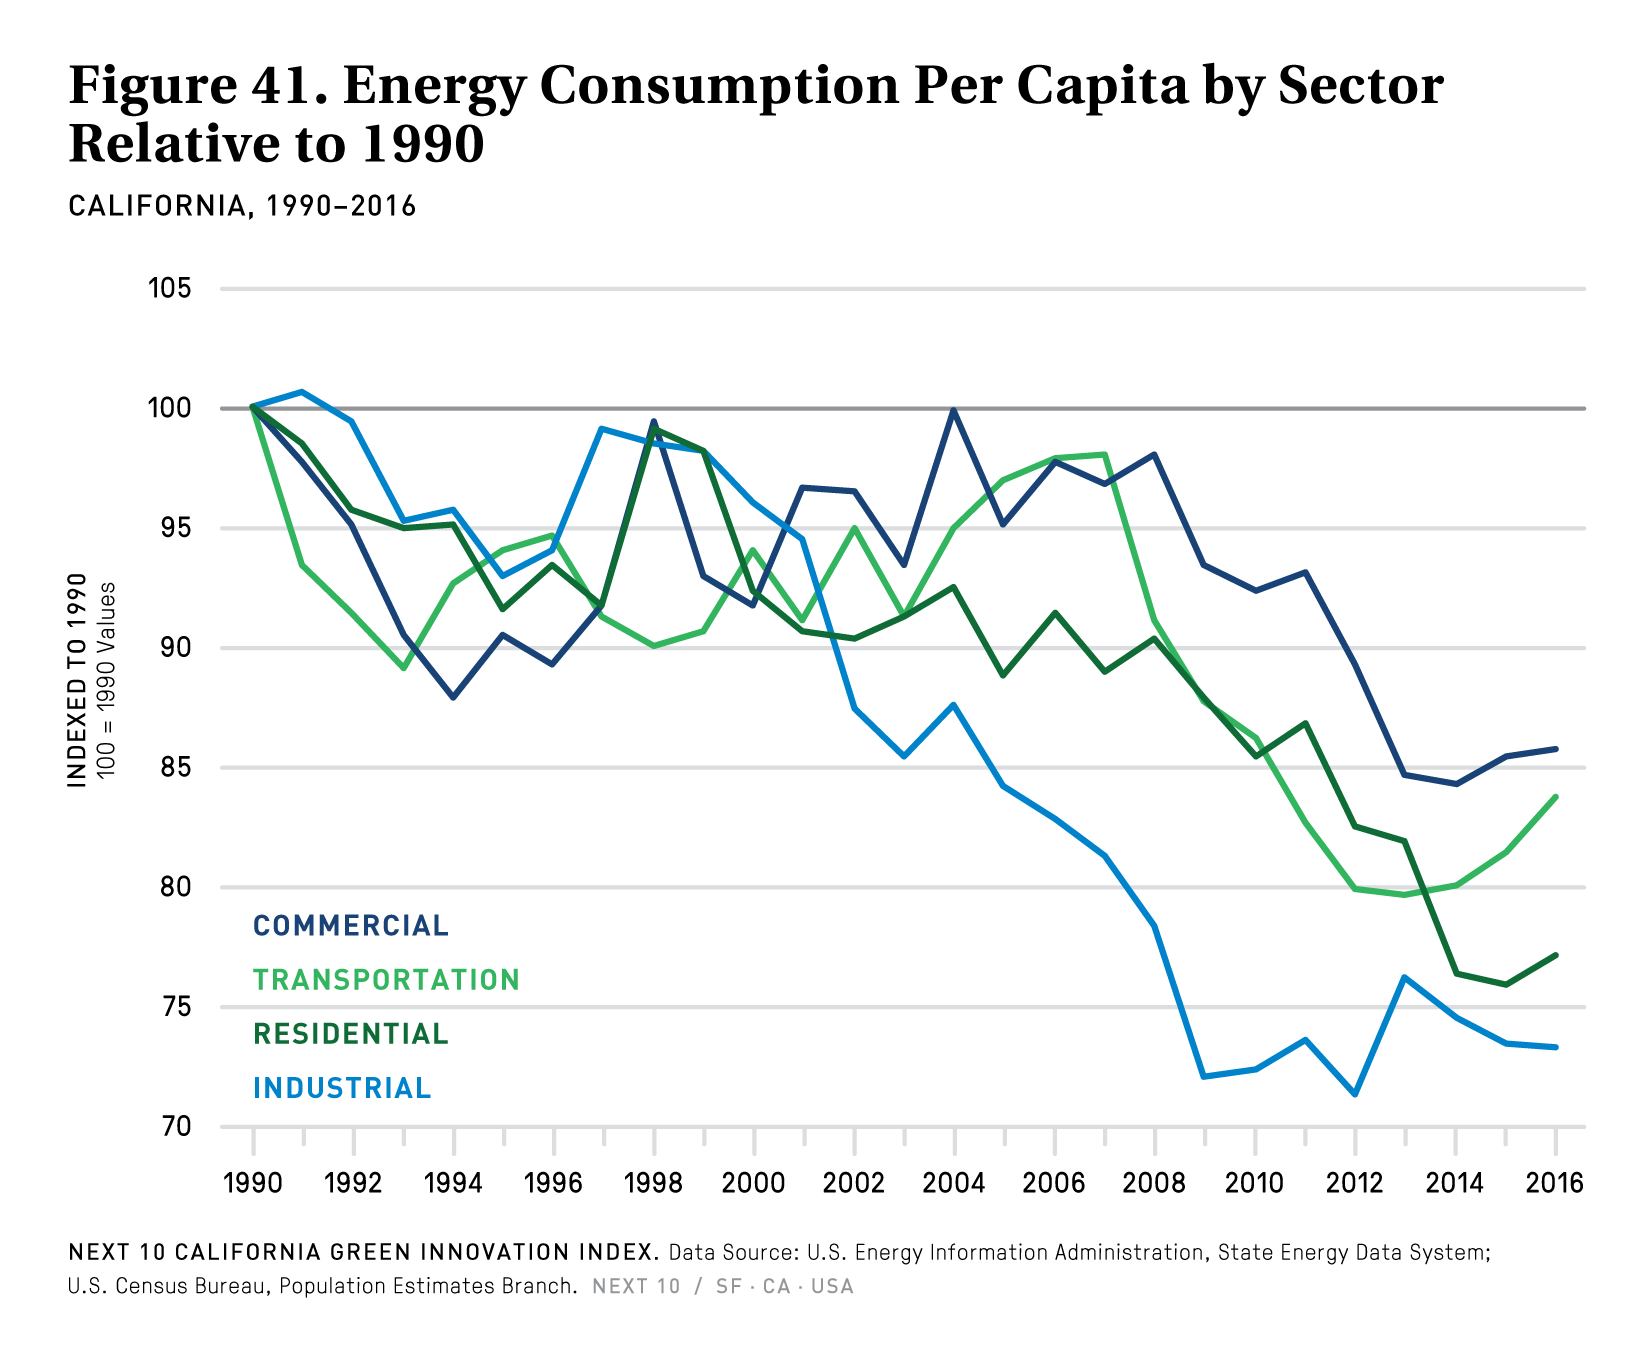
The findings follow last year's announcement that California had hit its 2020 emissions reduction goal four years early. Yet since 2000, electricity generation has been the only economic sector that has seen continuous and significant improvements in reducing greenhouse gas (GHG) emissions. The industrial, residential, and transportation sectors have only seen small declines over the same time period, while California’s commercial sector is moving in the opposite direction—with emissions increasing more than 64 percent.
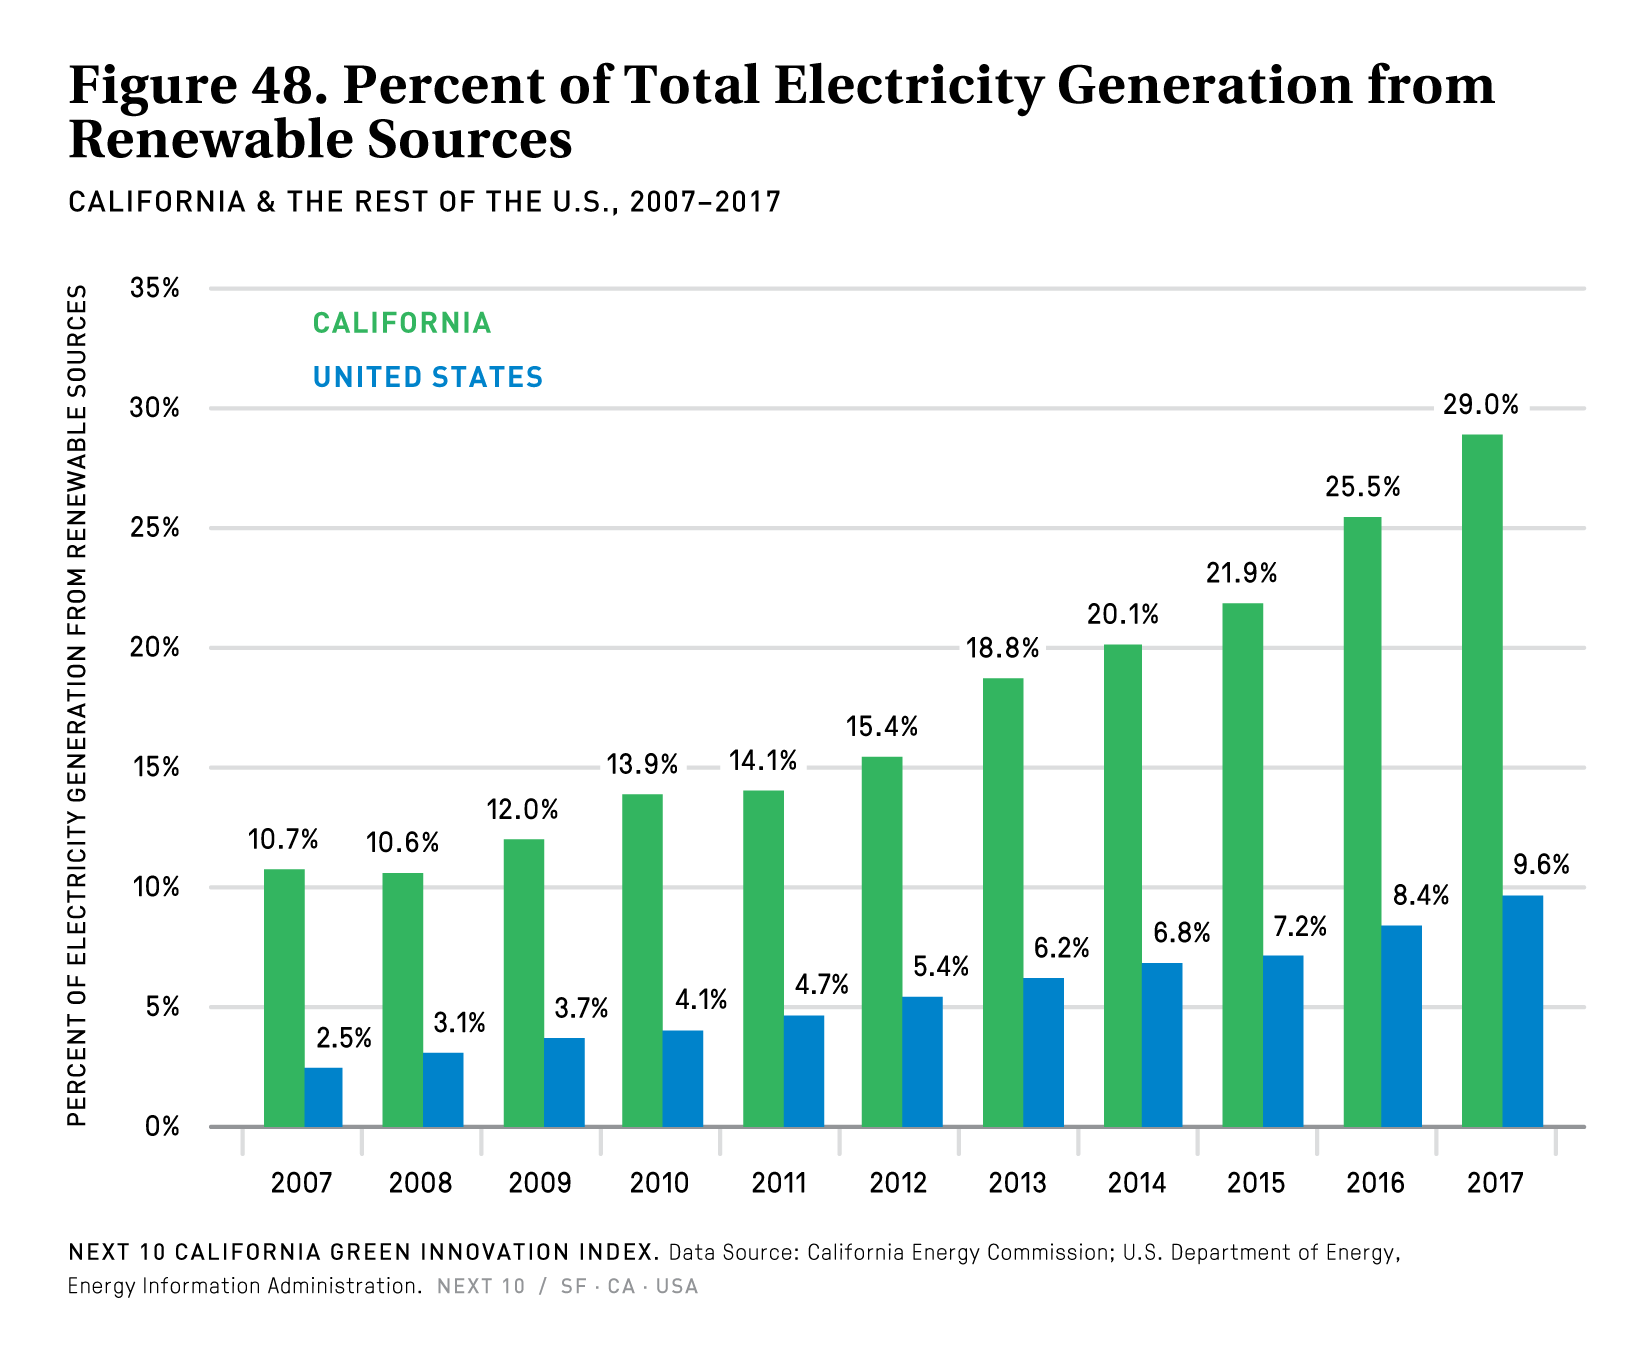
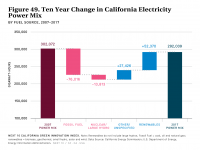
It's not all bad news—the Index finds that 2017 marked the first time that a greater portion of California's power mix came from renewable sources like wind and solar than from fossil fuels. Compared to the rest of the nation, California has the second-lowest rate of energy-related carbon emissions per capita, and its economy's carbon intensity is 54.3 percent lower than the rest of the U.S.
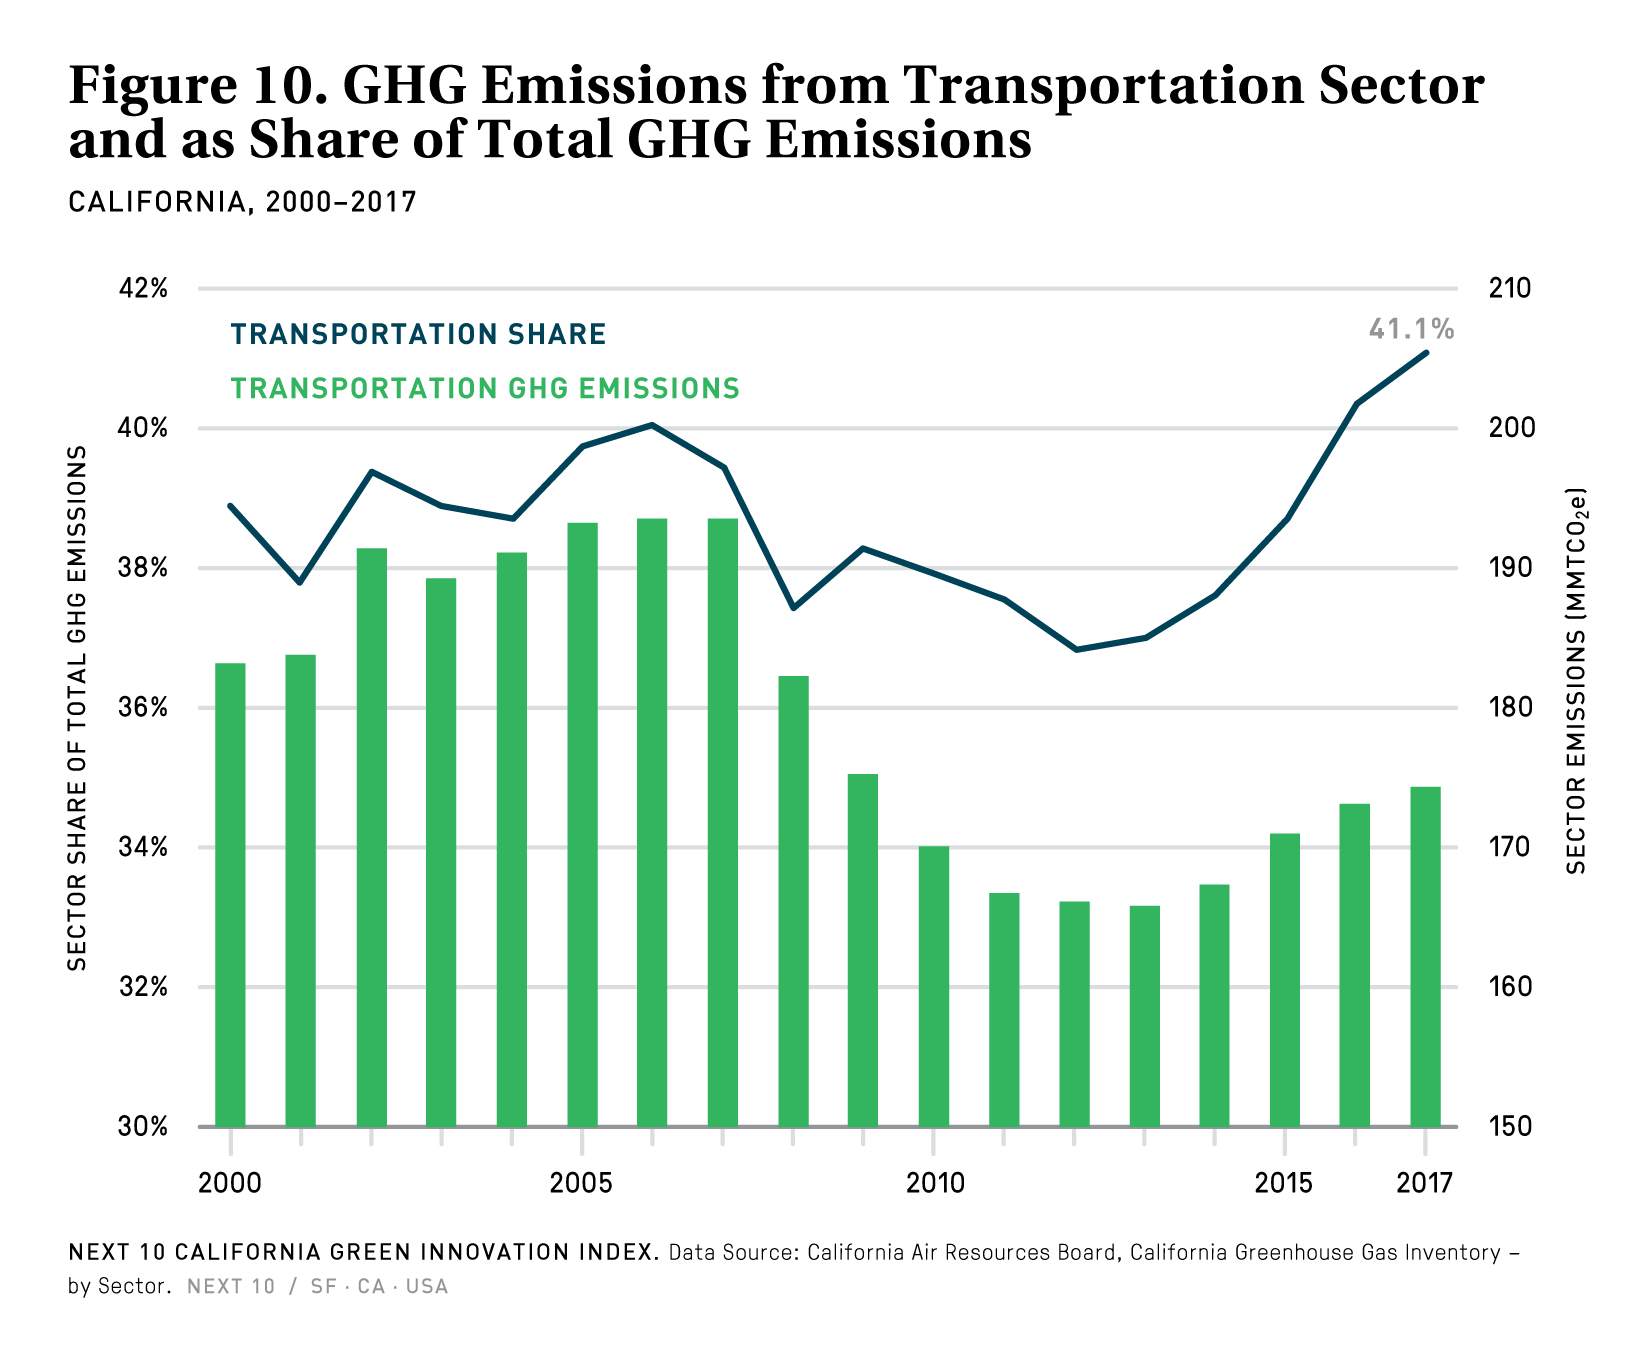
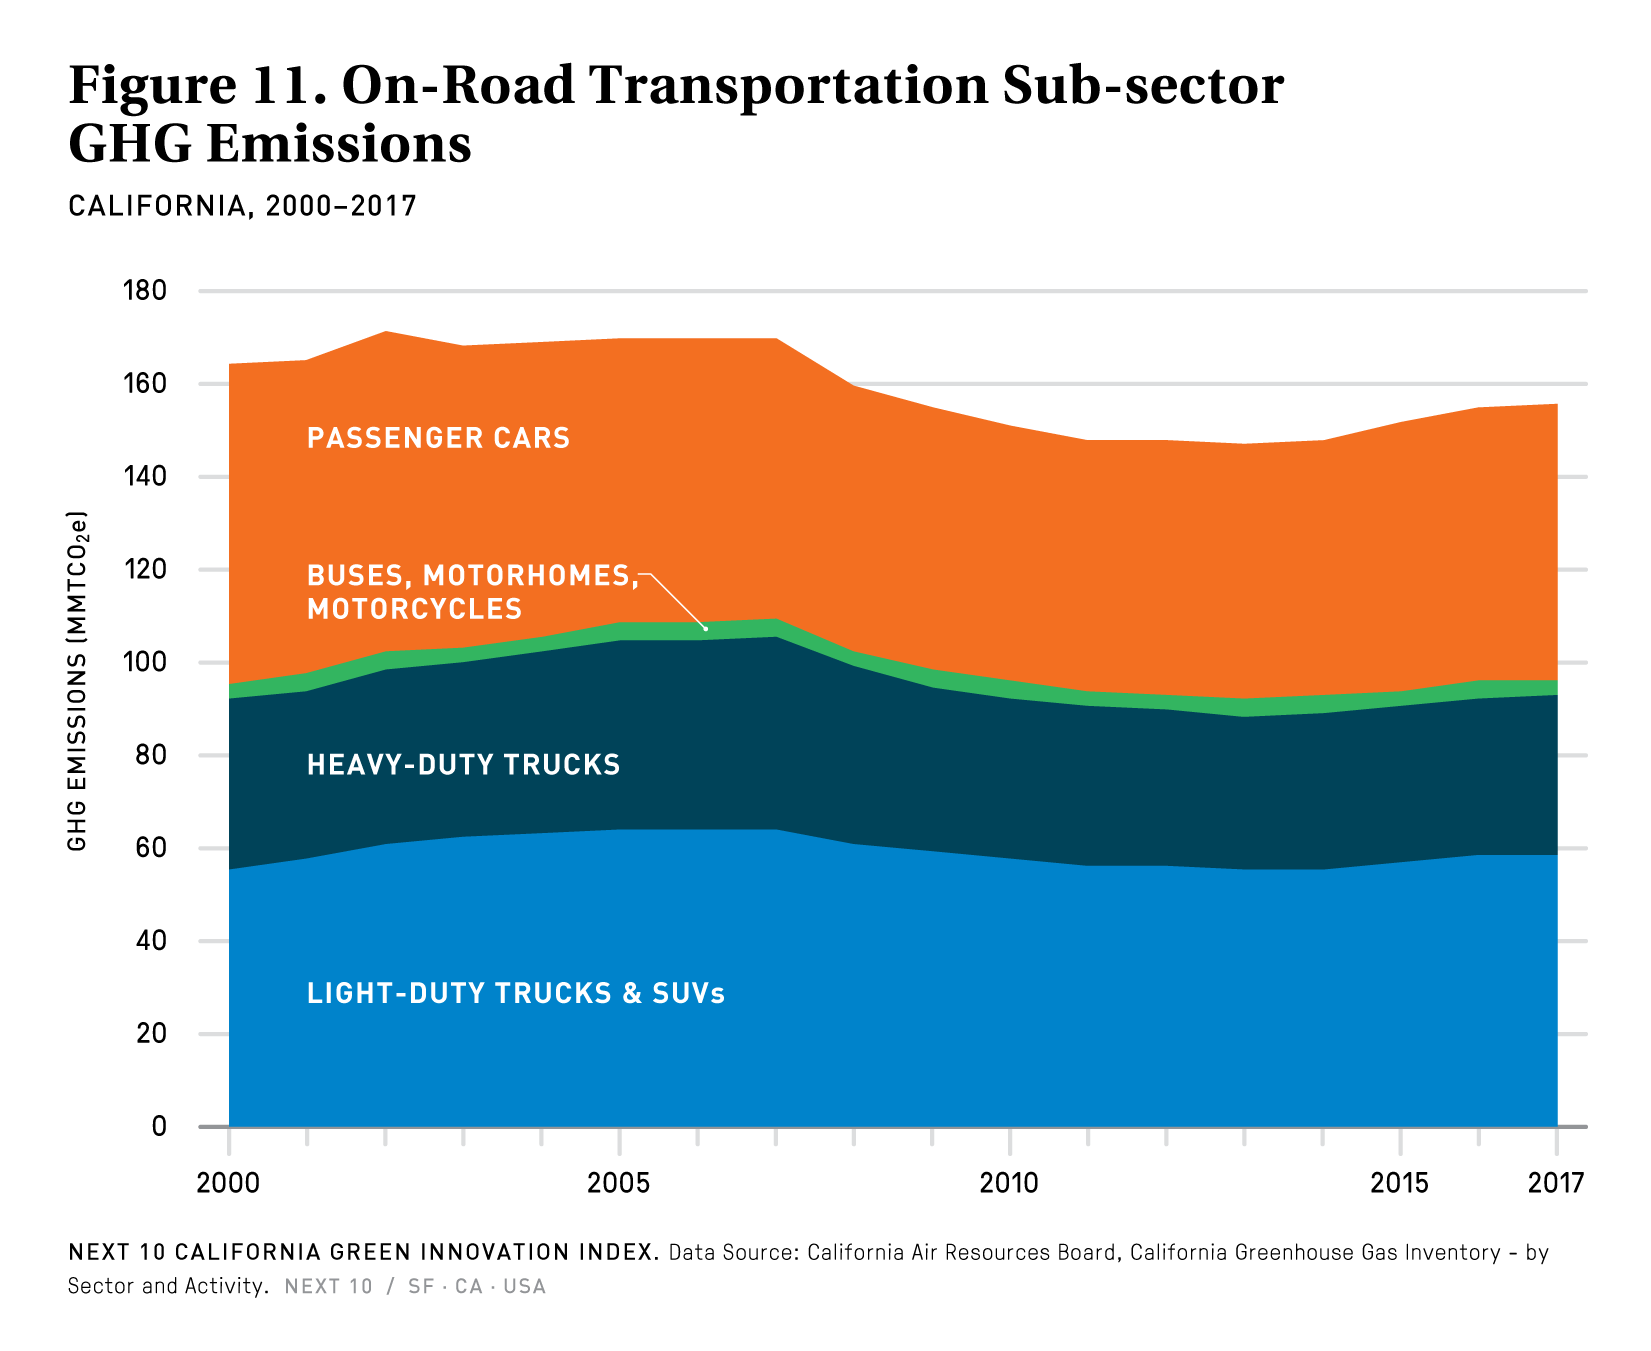
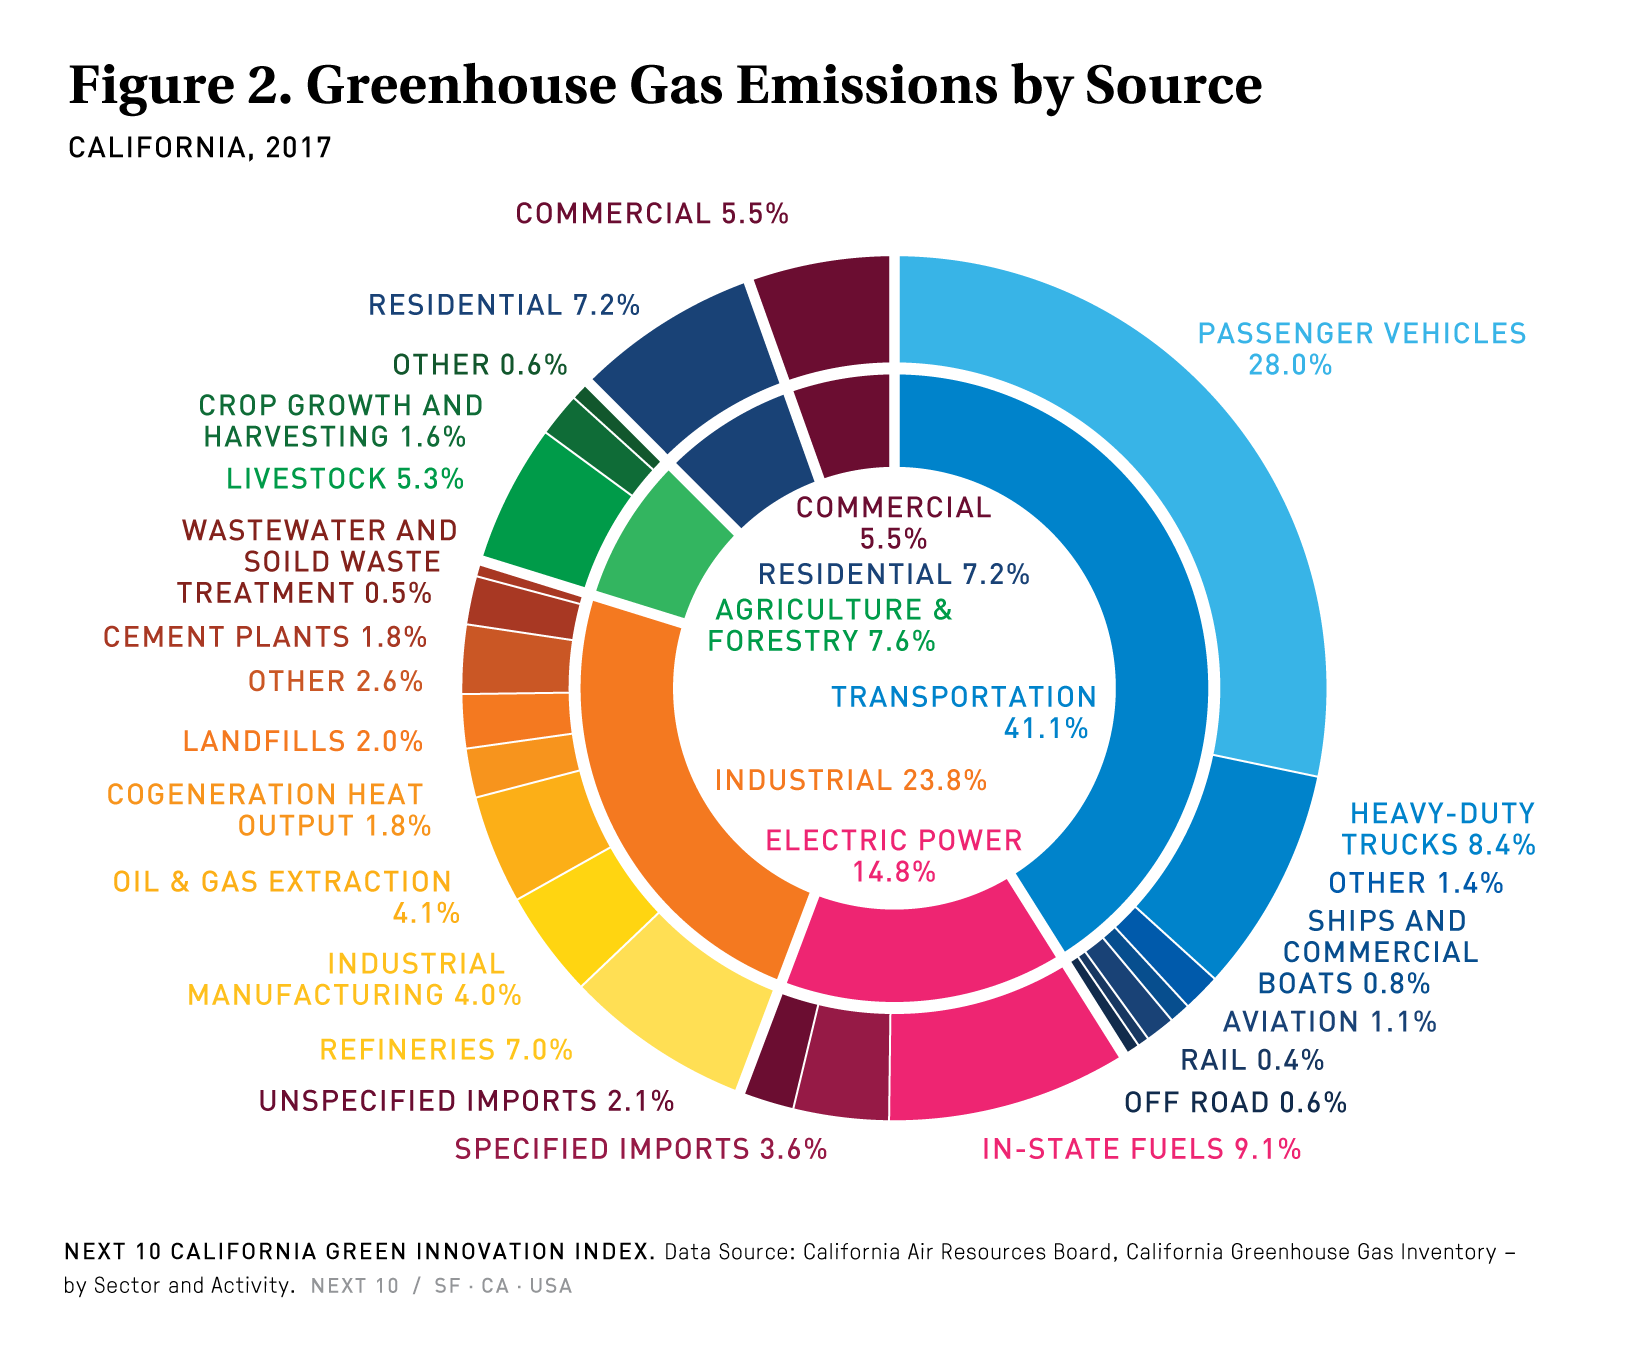
While California still stands out as a leading state in decarbonizing its economy, significant challenges remain. Transportation emissions hit a record high in 2017—reaching 41.1 percent of the state’s total GHG emissions—with on-road passenger vehicles accounting for 28 percent of the state's total emissions. Car ownership rates and vehicle miles travelled (VMT) also hit new highs in 2017, while consumer preferences have shifted markedly toward less fuel-efficient vehicles.
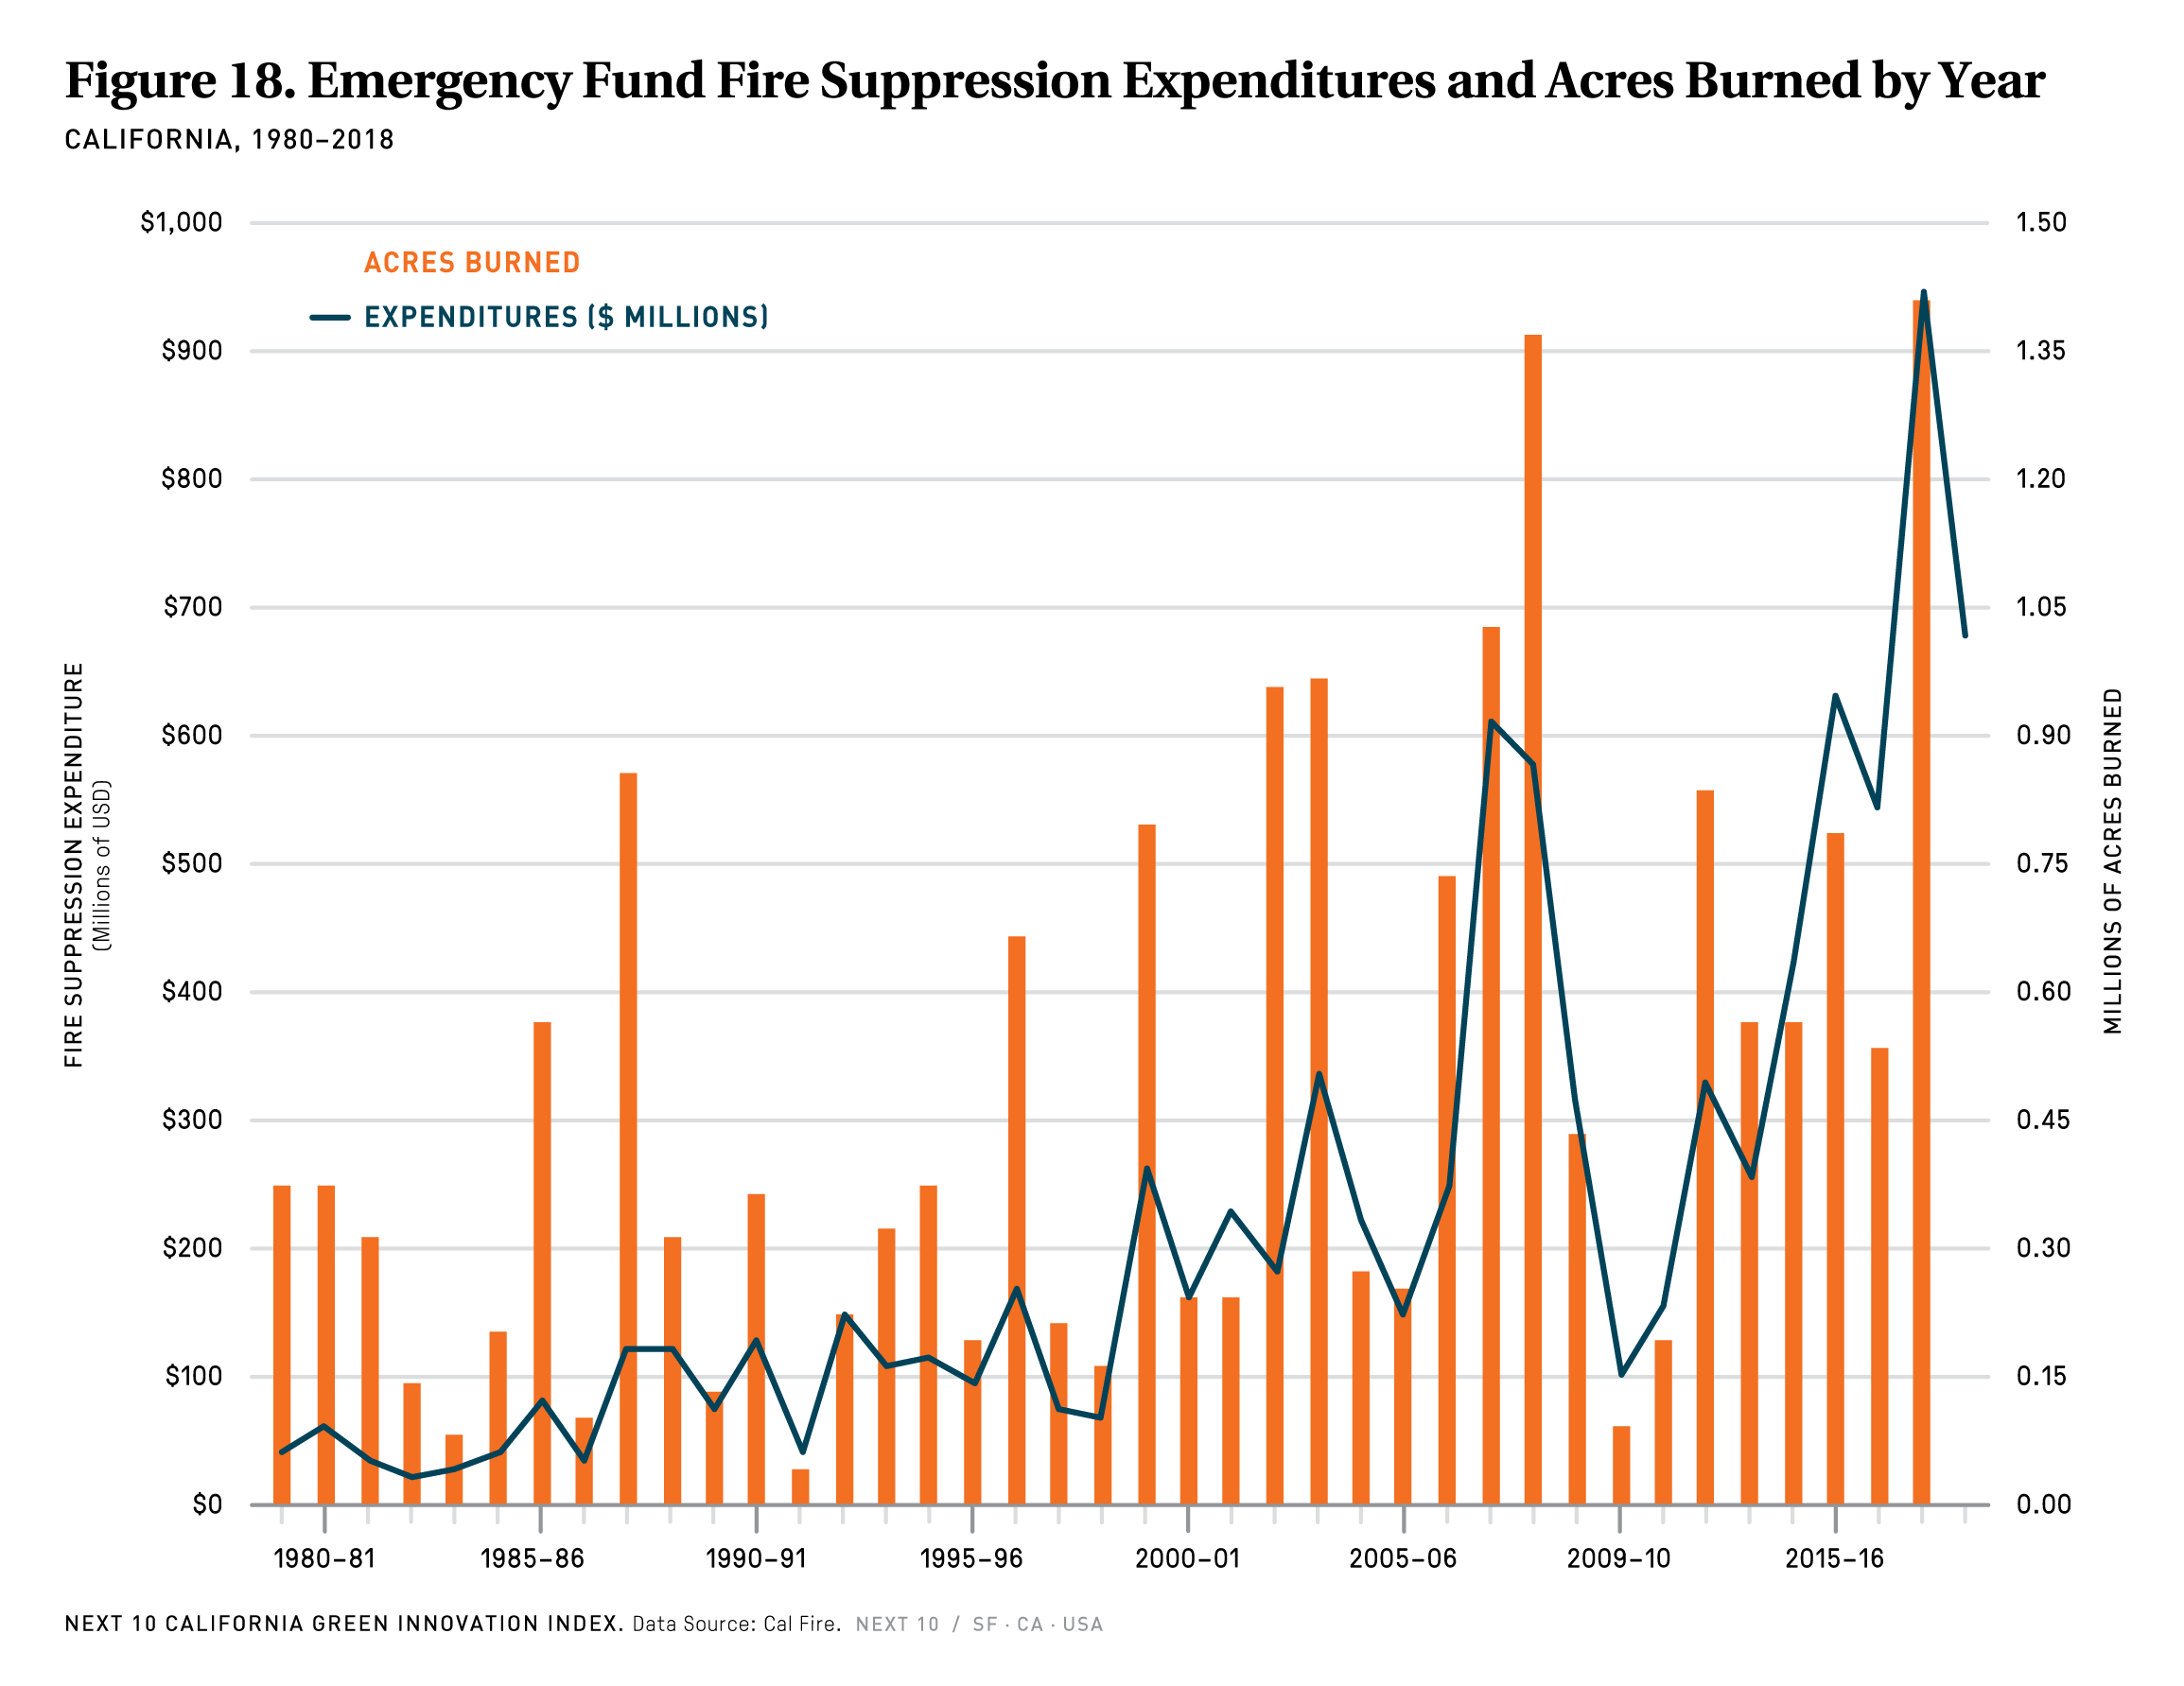
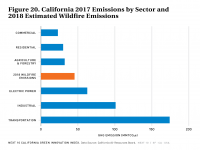
Increasing transportation emissions present the most considerable hurdle to achieving the next climate goals, given their relative share of the state's total emissions, but there are other key areas to watch in terms of emissions growth. The 2018 wildfires in California are estimated to have produced more than nine times greater emissions than were reduced across the entire state’s economy between 2016 and 2017—with wildfires contributing more than the commercial, residential or agriculture sectors did in 2017. Recycling rates are also down in the state as the amount of waste sent to landfills continues to increase. California's landfill emissions have increased every single year since 2004, and increased 7.4 percent from 2016 to 2017. At the current trajectory, California will not meet its 2020 goal of a 75 percent recycling rate (the rate was 42% in 2017, down from 44% in 2016).
Next 10 owns the rights to this publication. Any usage of content from this publication is subject to our Terms of Use.


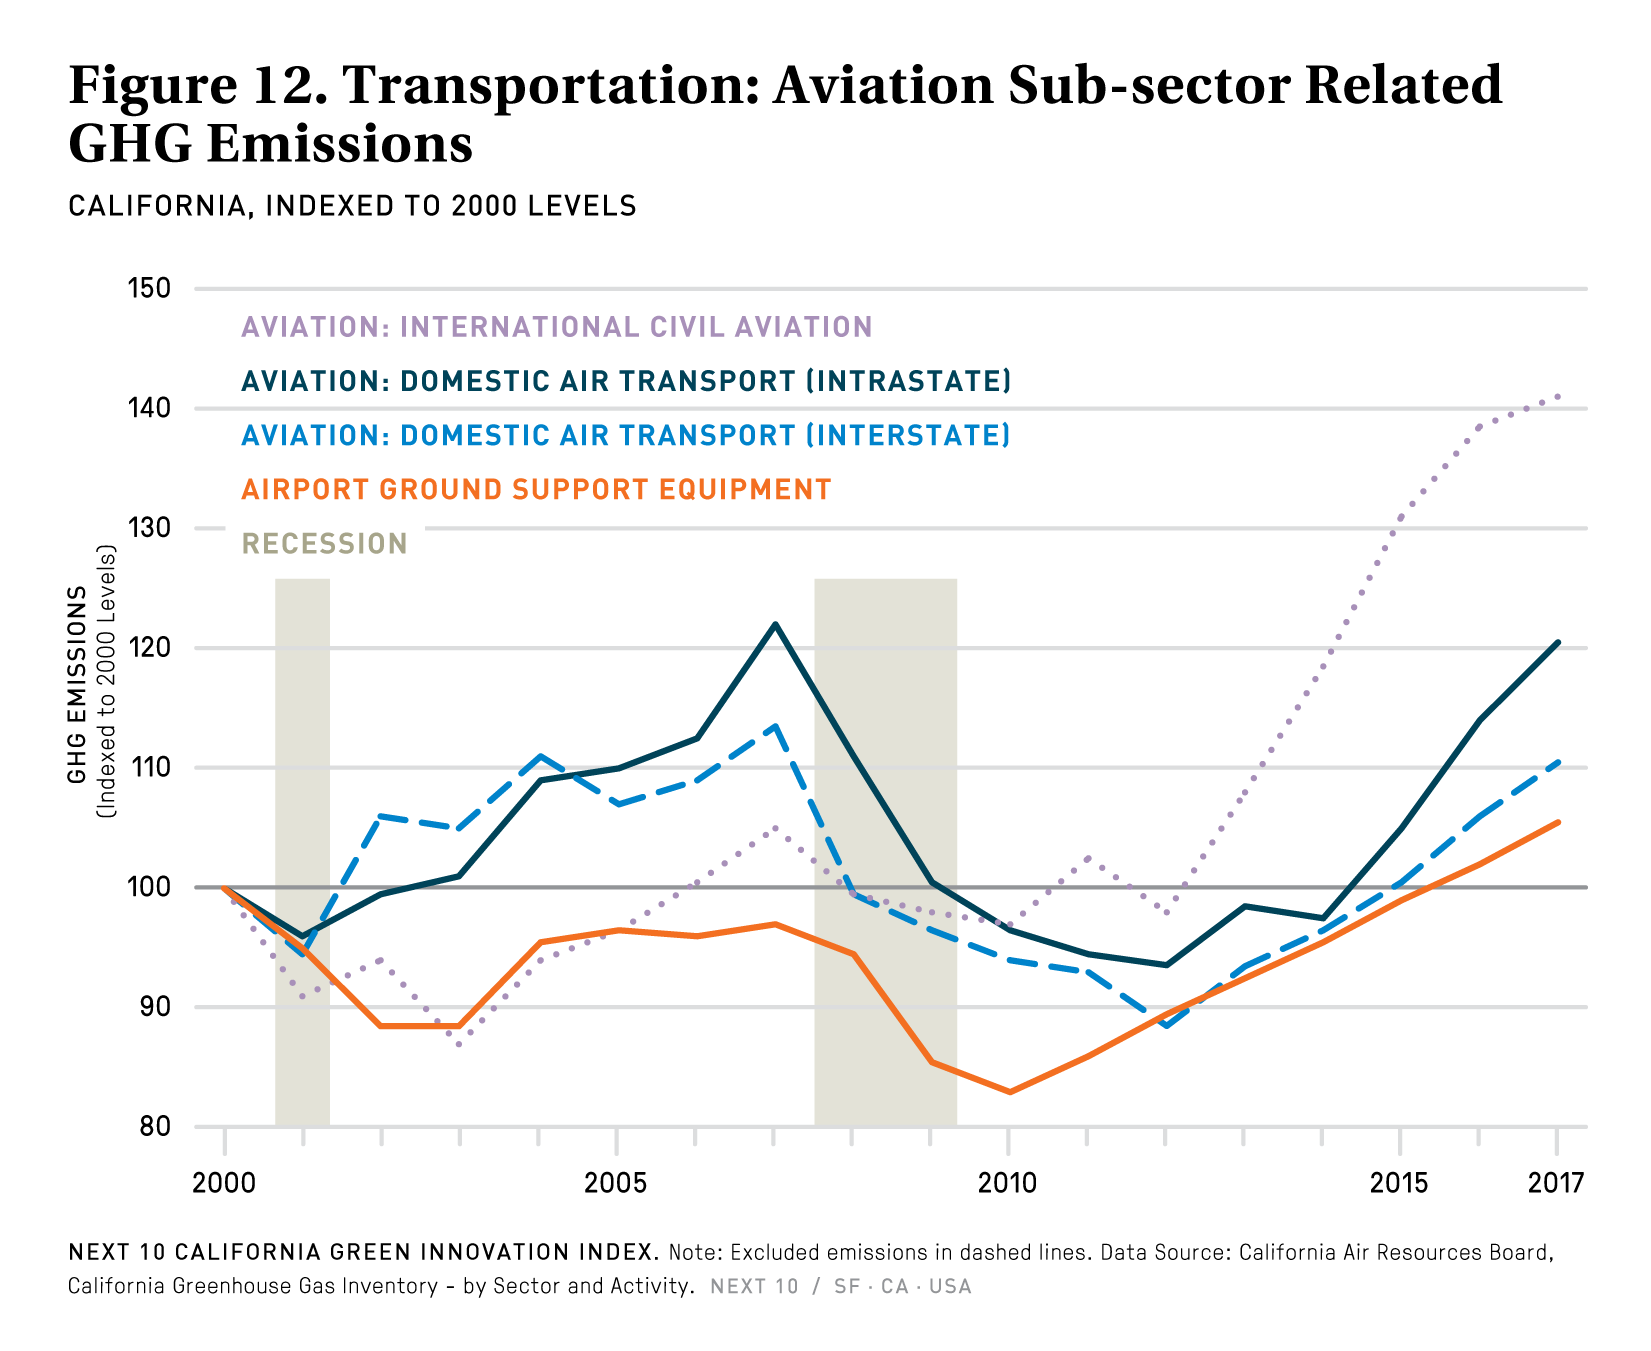
Transportation
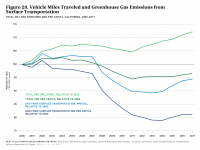
- The annual increase in transportation emissions has slowed down slightly compared to the previous three years.
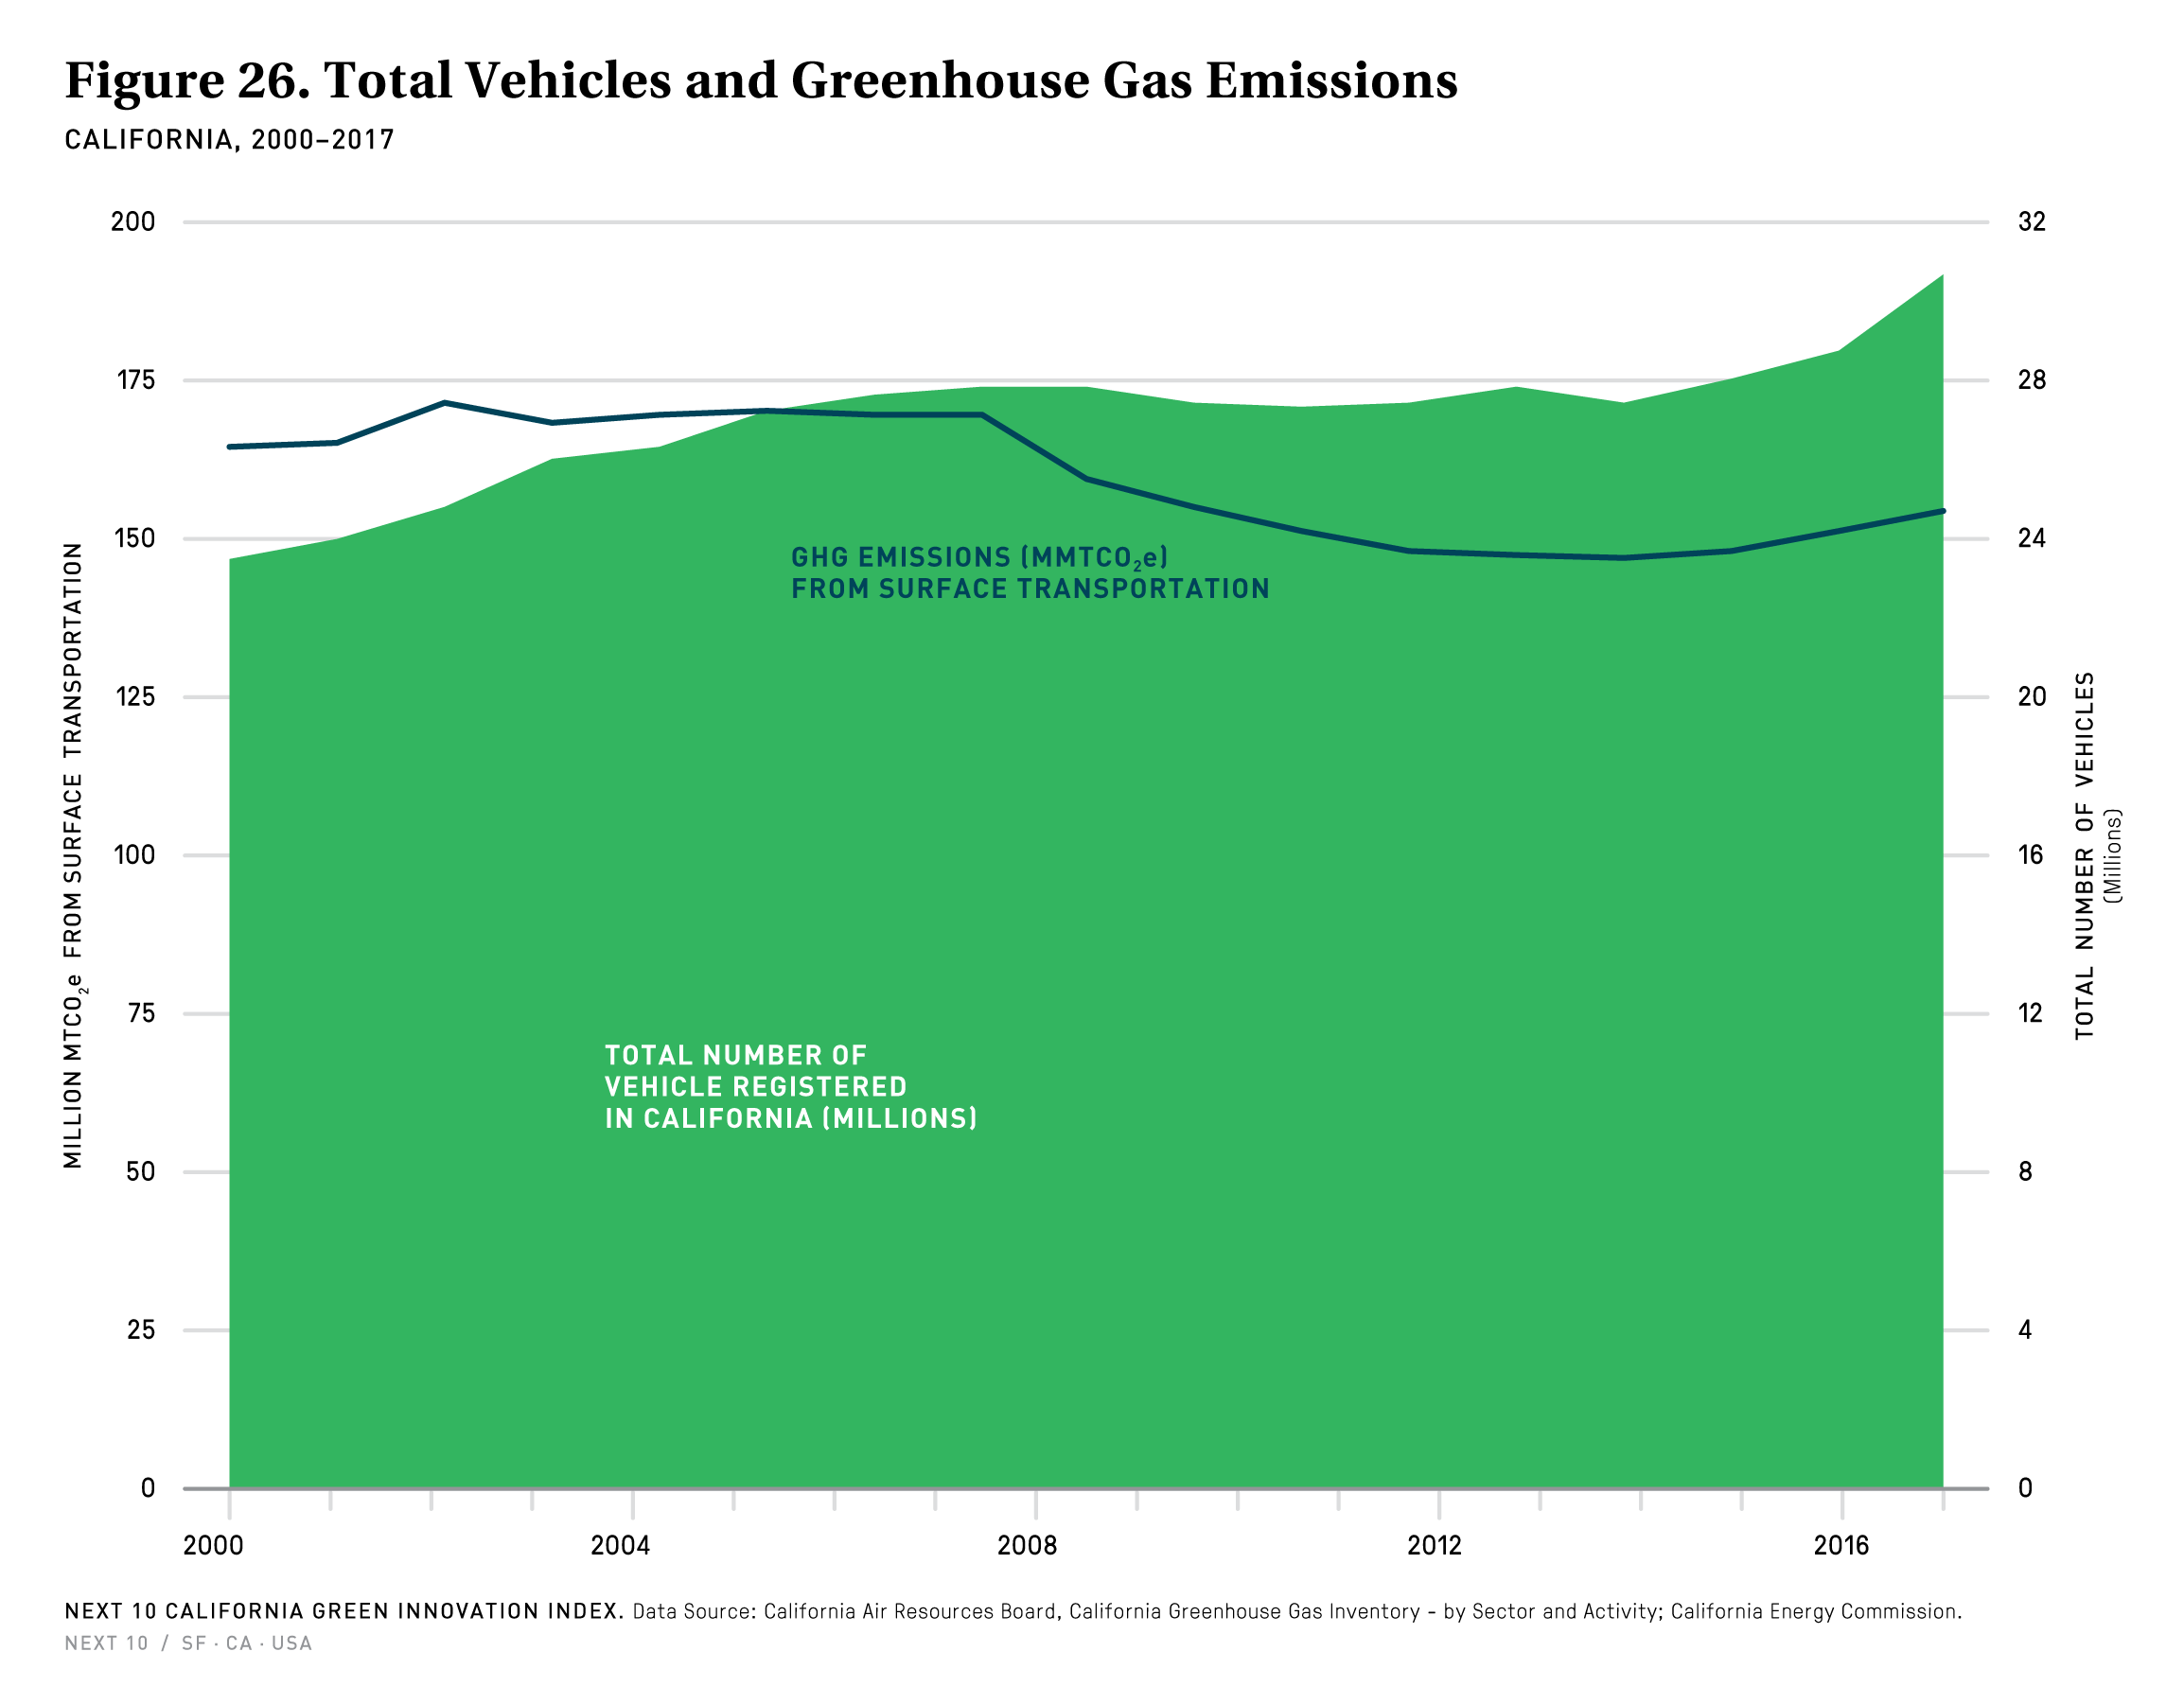
- Vehicle miles traveled (VMT) and greenhouse gas (GHG) emissions from surface transportation per capita increased 0.5 percent and 0.1 percent, respectively, from 2016 to 2017.
- The fact that VMT has increased faster than GHG emissions from surface transportation indicates that the state’s fuel economy standards and policies are working to reduce emissions to an extent, but the current upward trajectory of VMT and surface transportation GHG emissions cannot continue if the state is to meet its climate goals.
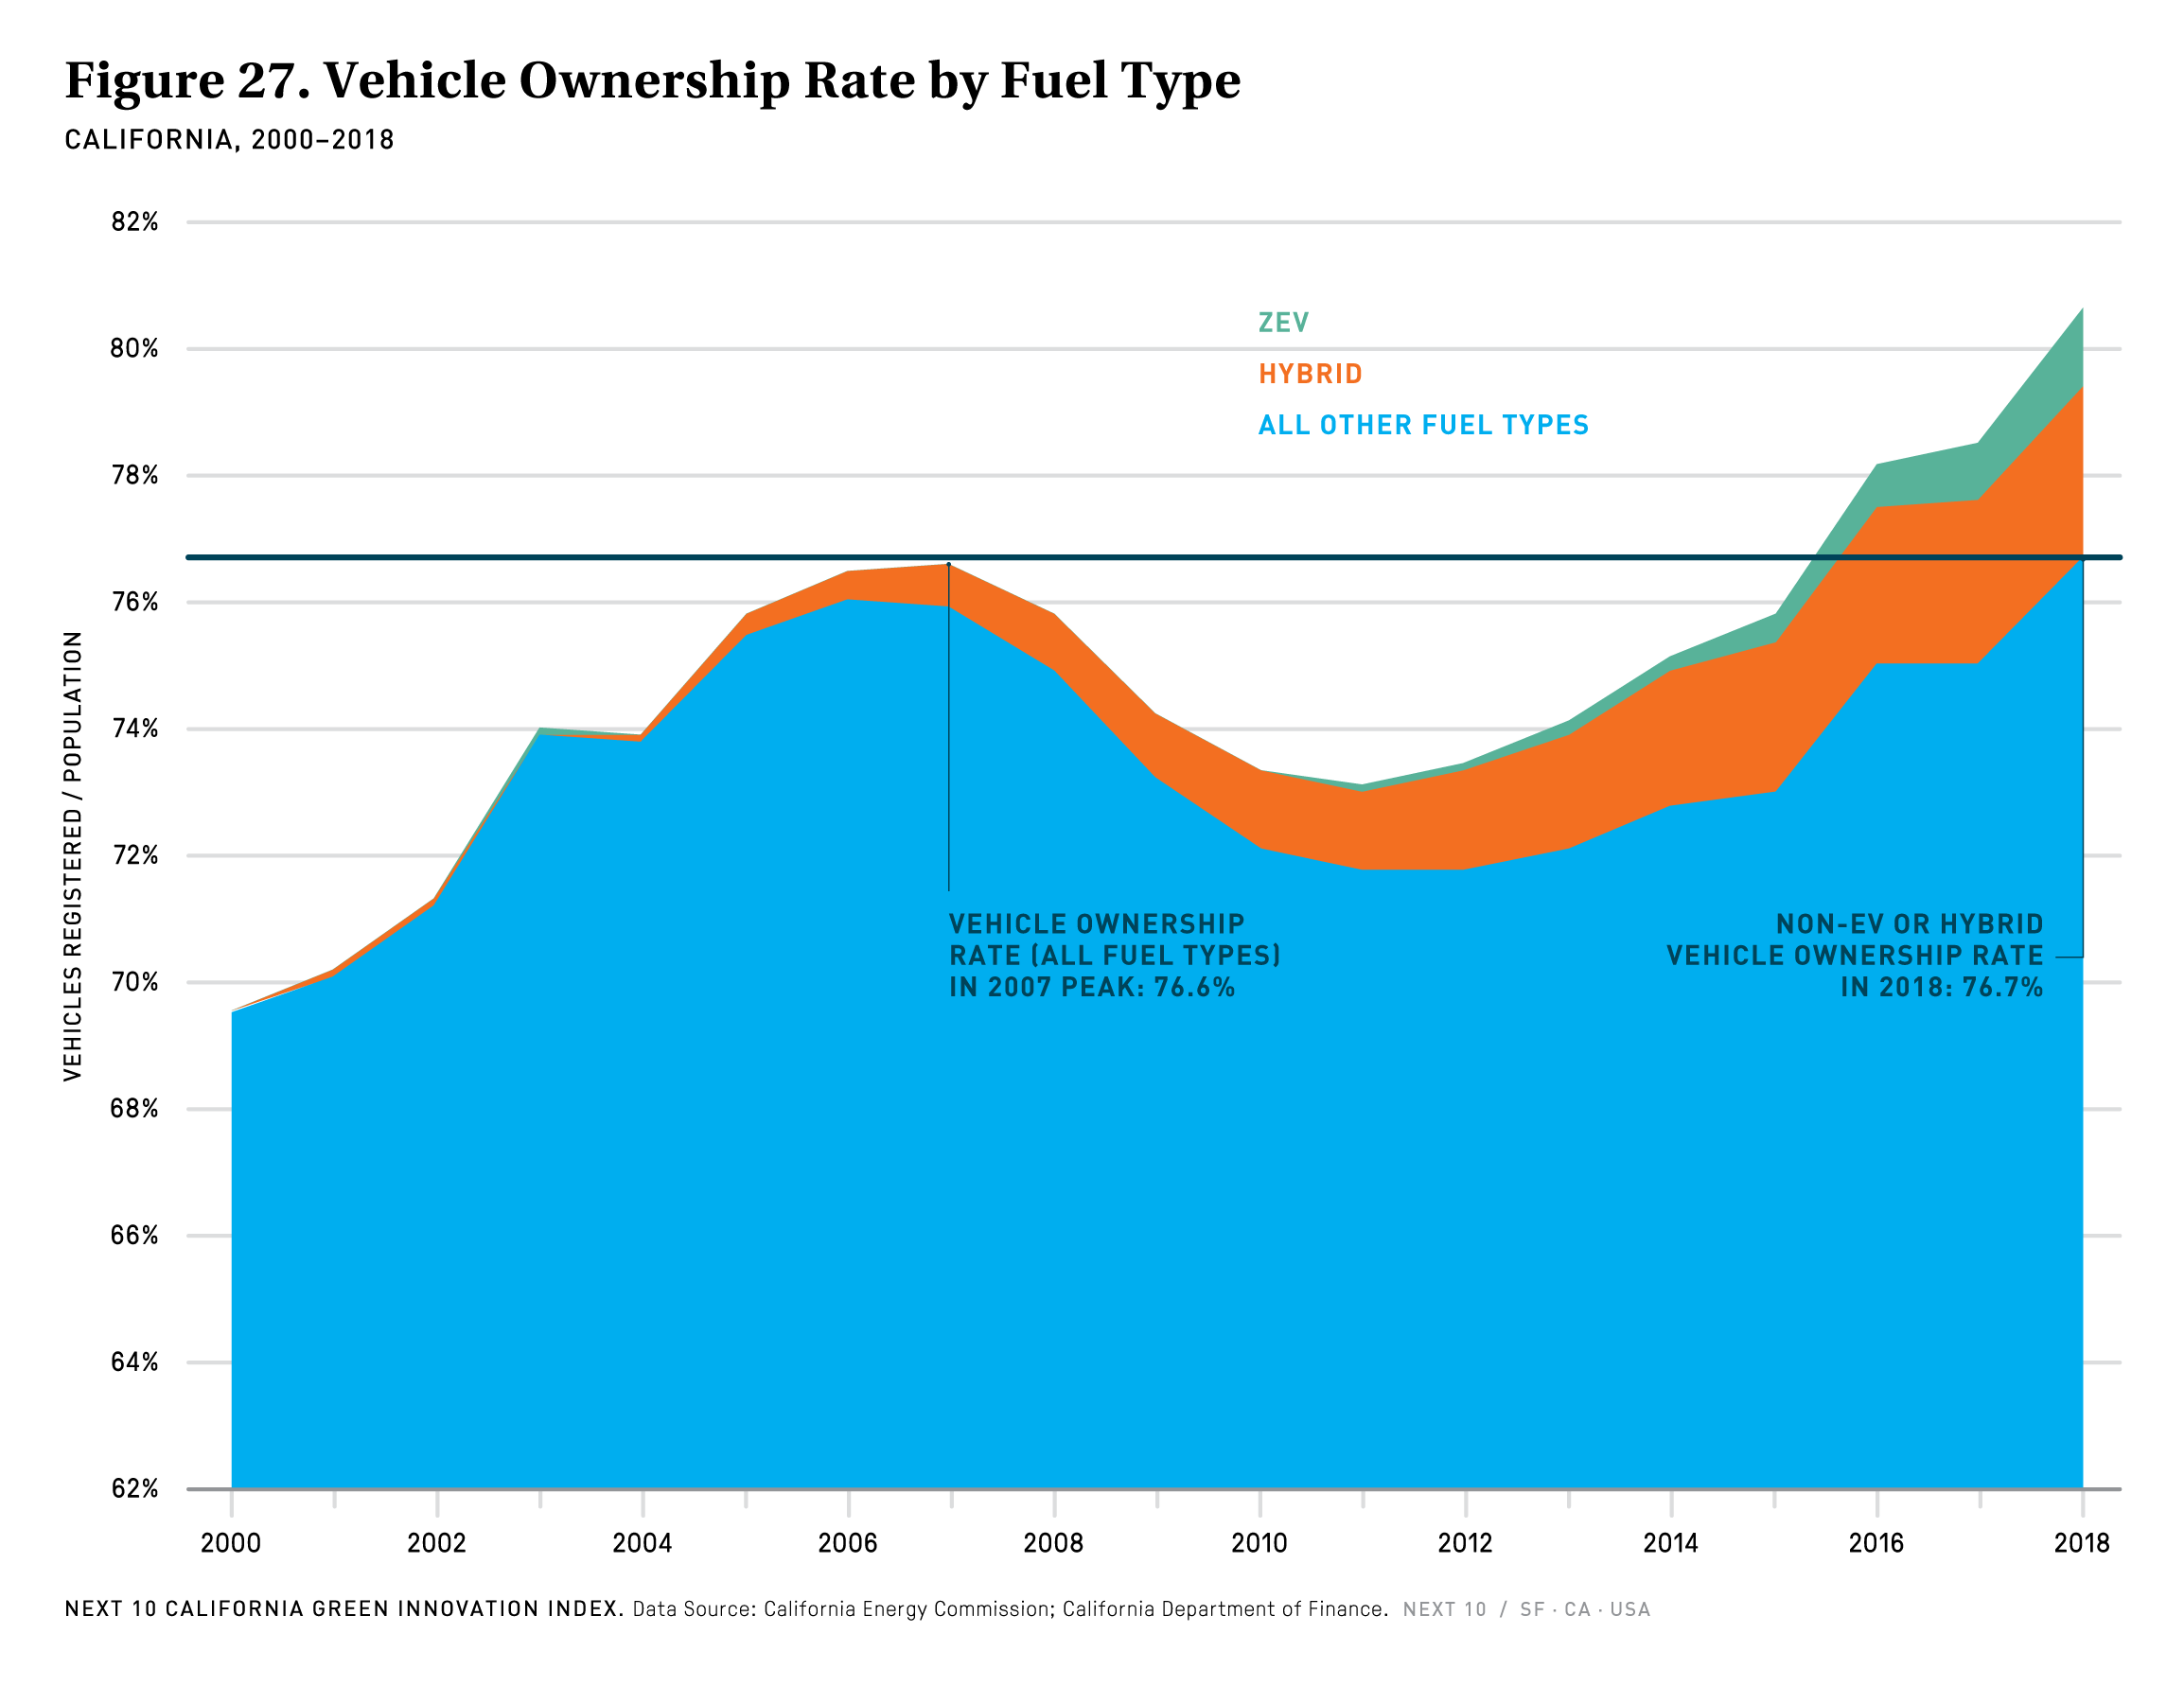
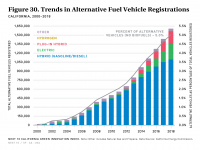
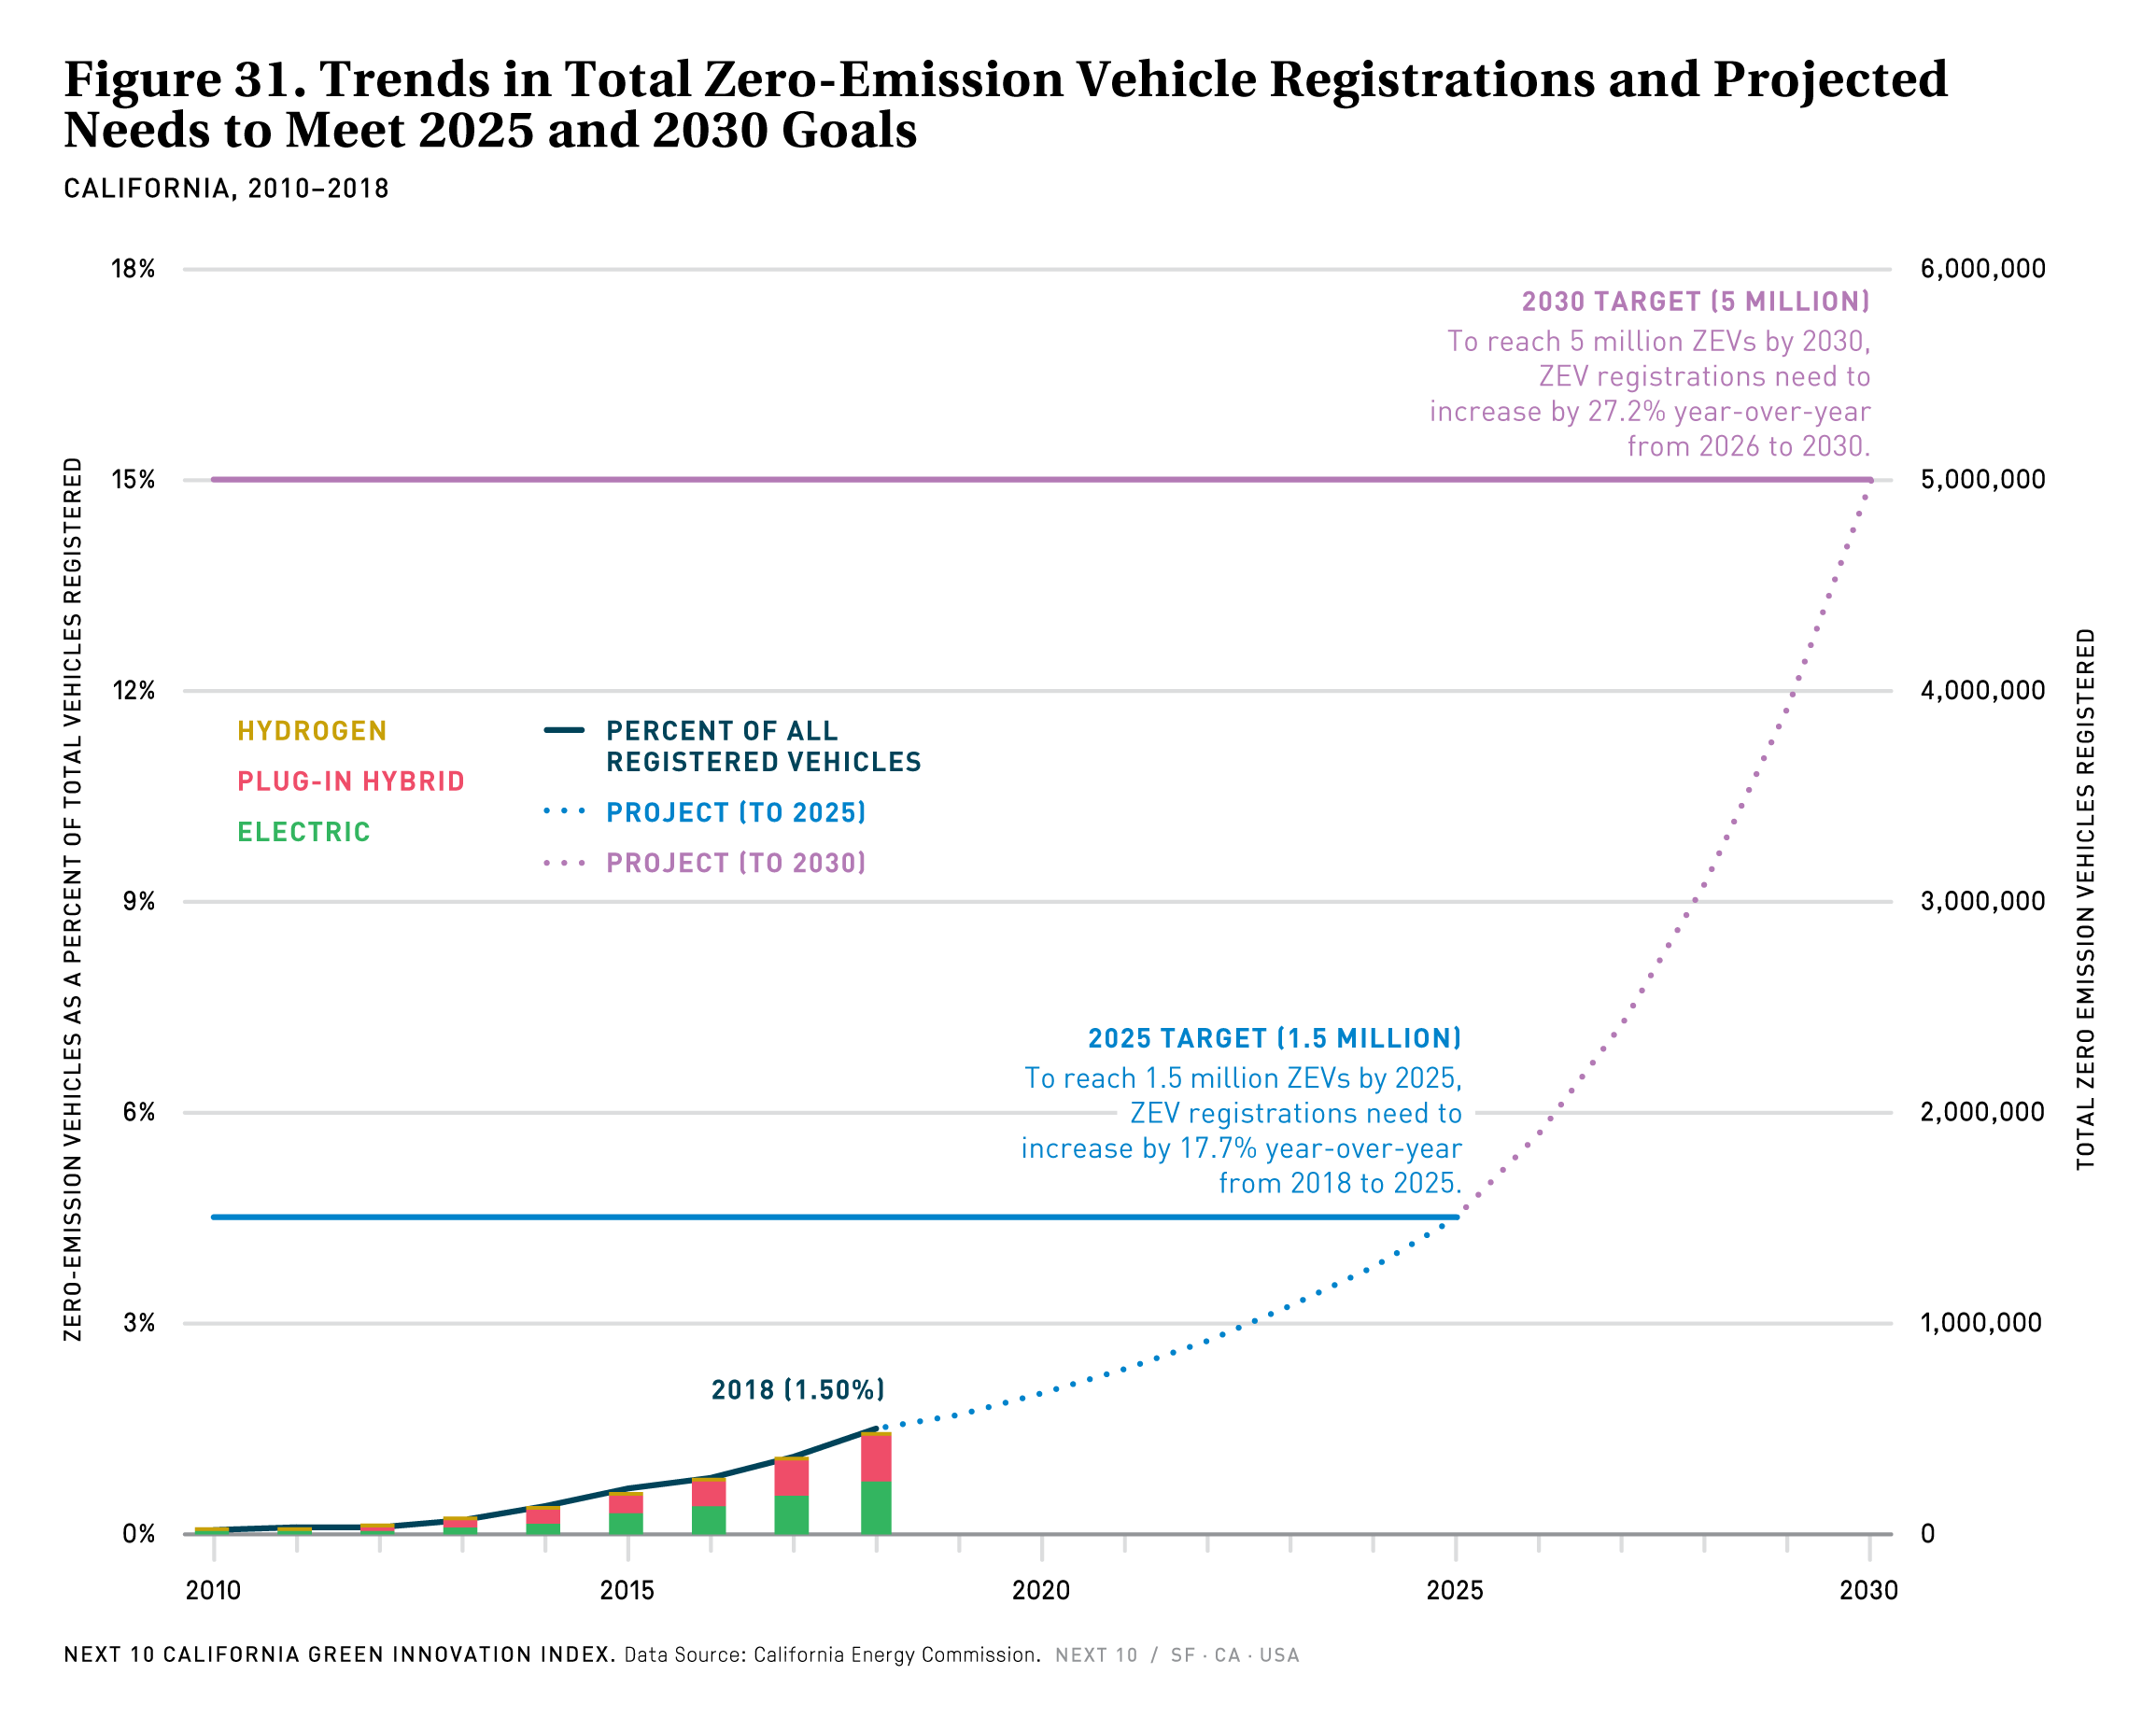
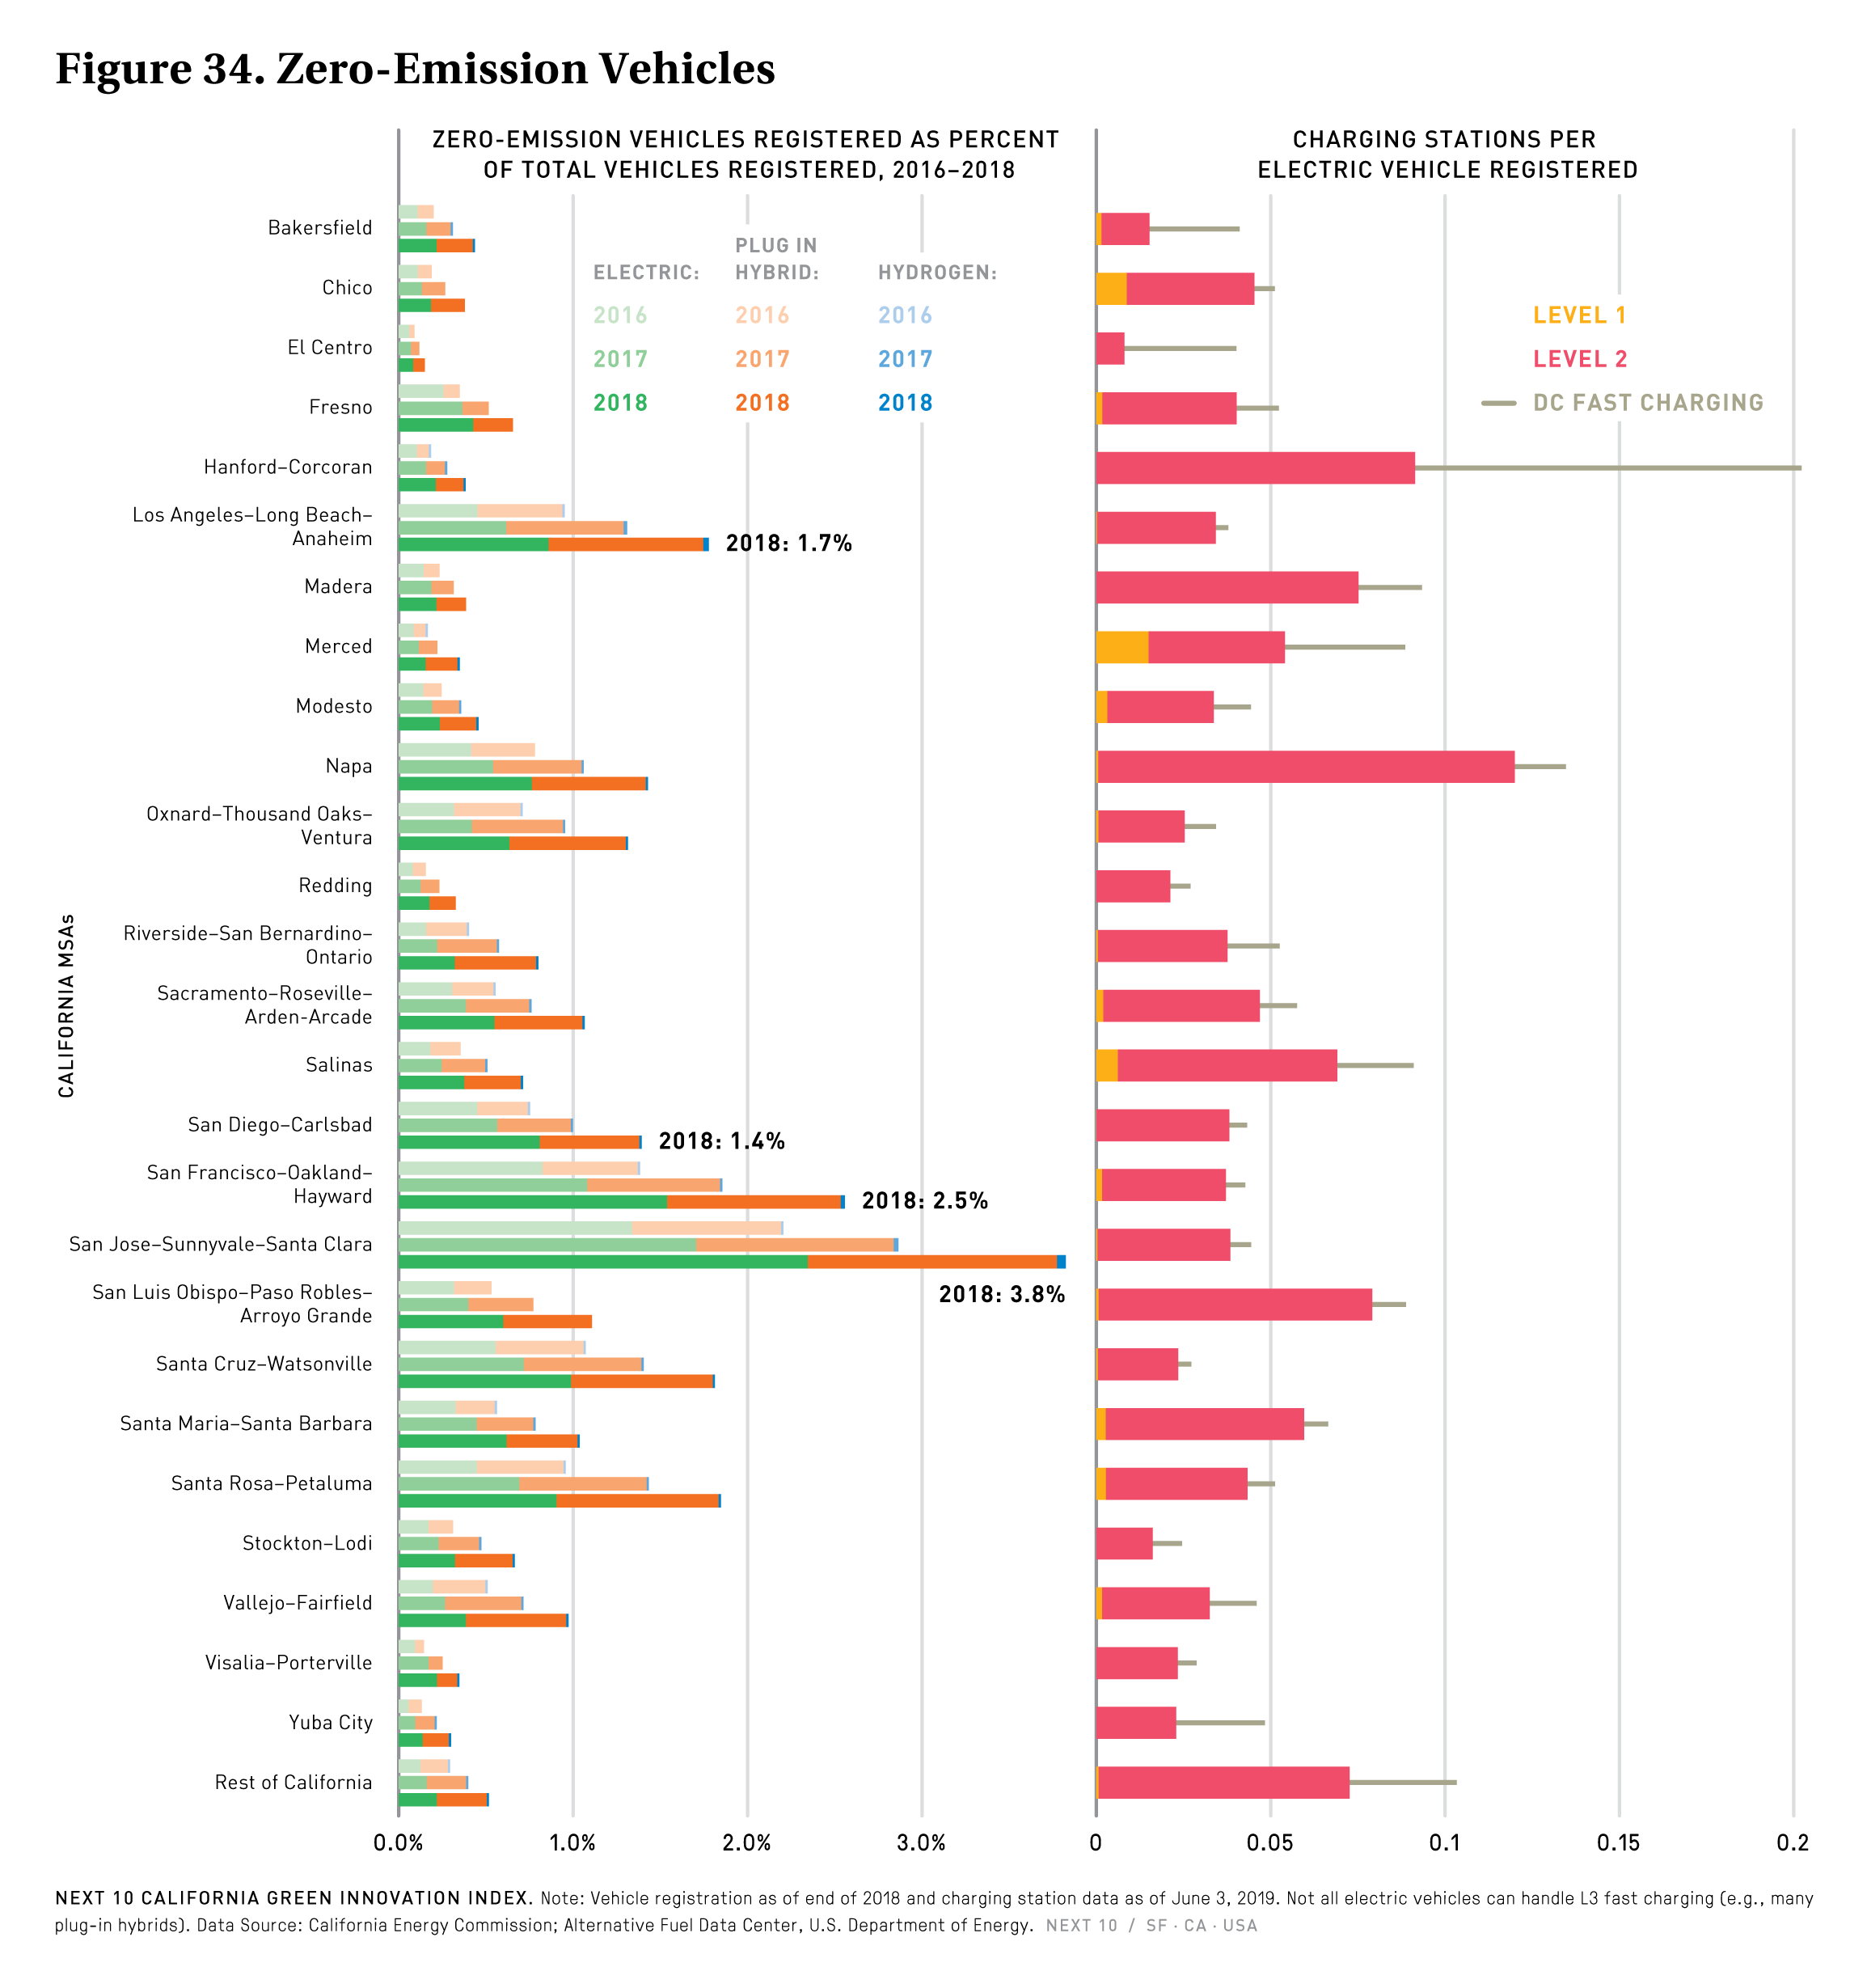
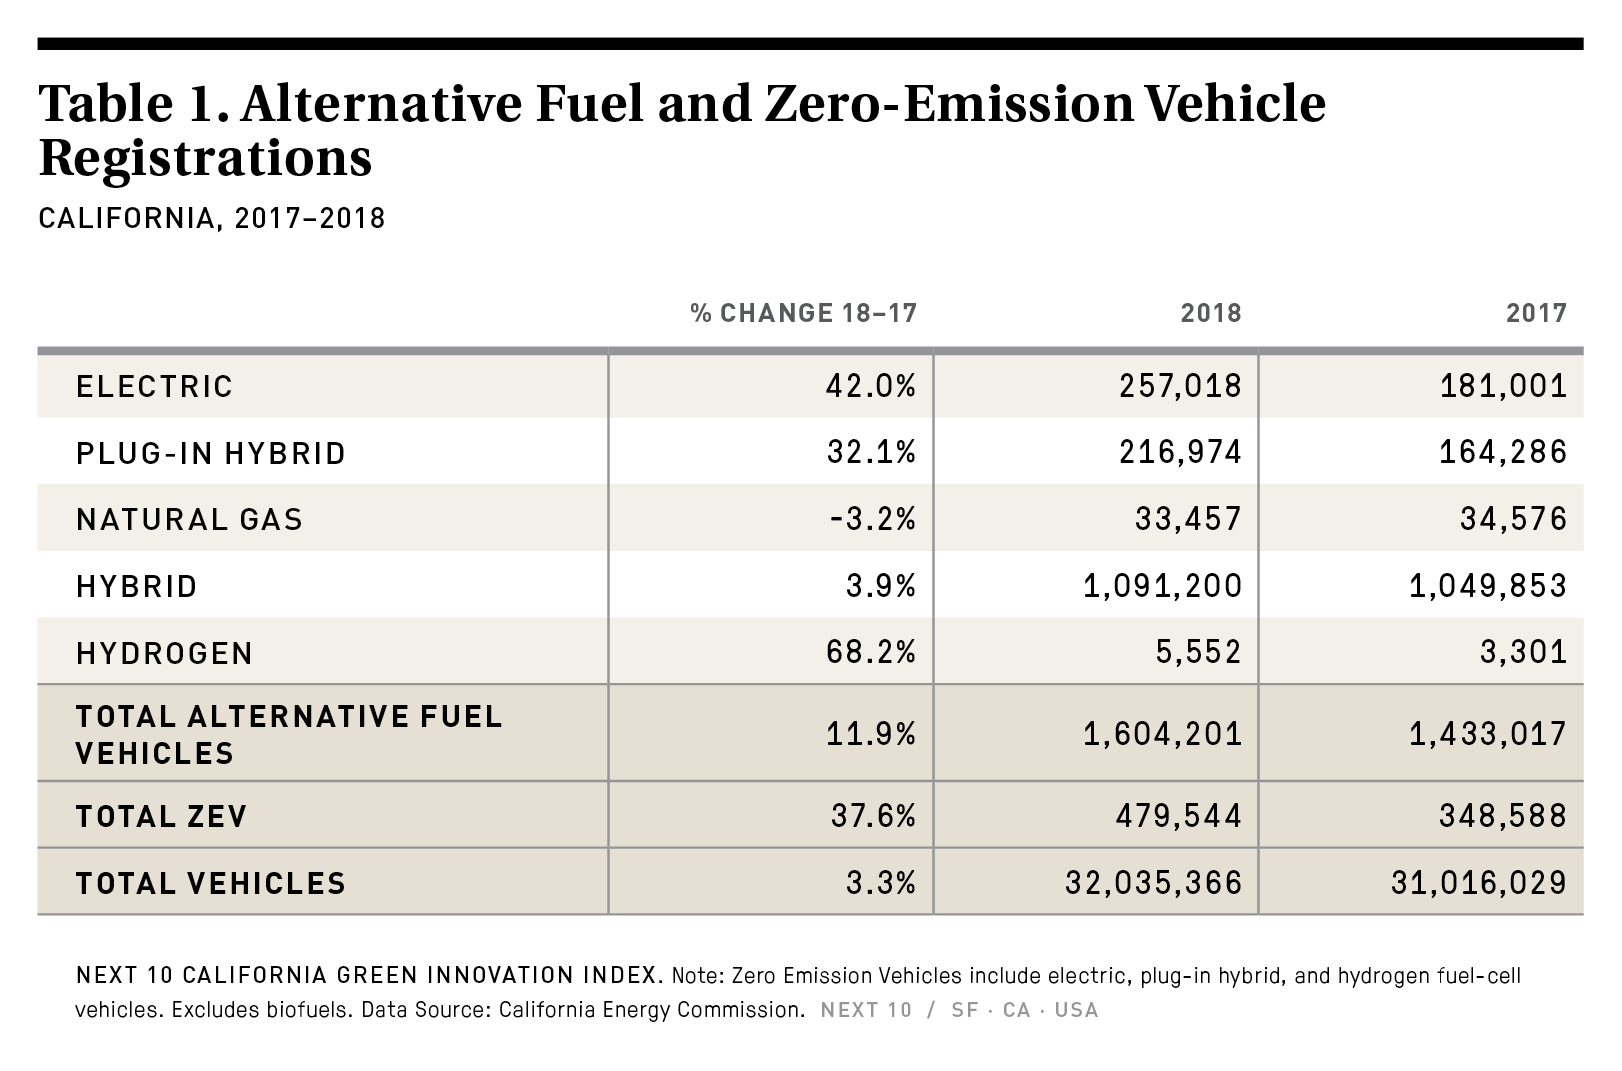
- In 2018, battery electric, plug-in hybrid, and hydrogen vehicles accounted for 1.5 percent of all registered on-road vehicles in California, up from 1.1 percent in 2017.
- At the current pace, the share will reach 2 percent by the end of 2019.
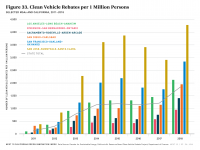
- The vehicle ownership rate is increasing faster than ever, reaching 80.6 vehicles per 100 persons in 2018. ZEVs and hybrids accounted for about 4.0 vehicles per 100 persons.
- VMT per capita have been increasing gradually for years in California—but declining in some other populous states. Between 2008 and 2017, total VMT increased 5 percent in California, but declined in Pennsylvania (-6%) and New York (-8%). Texas saw the greatest increase over the period (+16%).
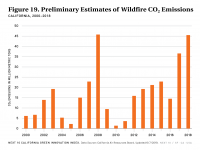
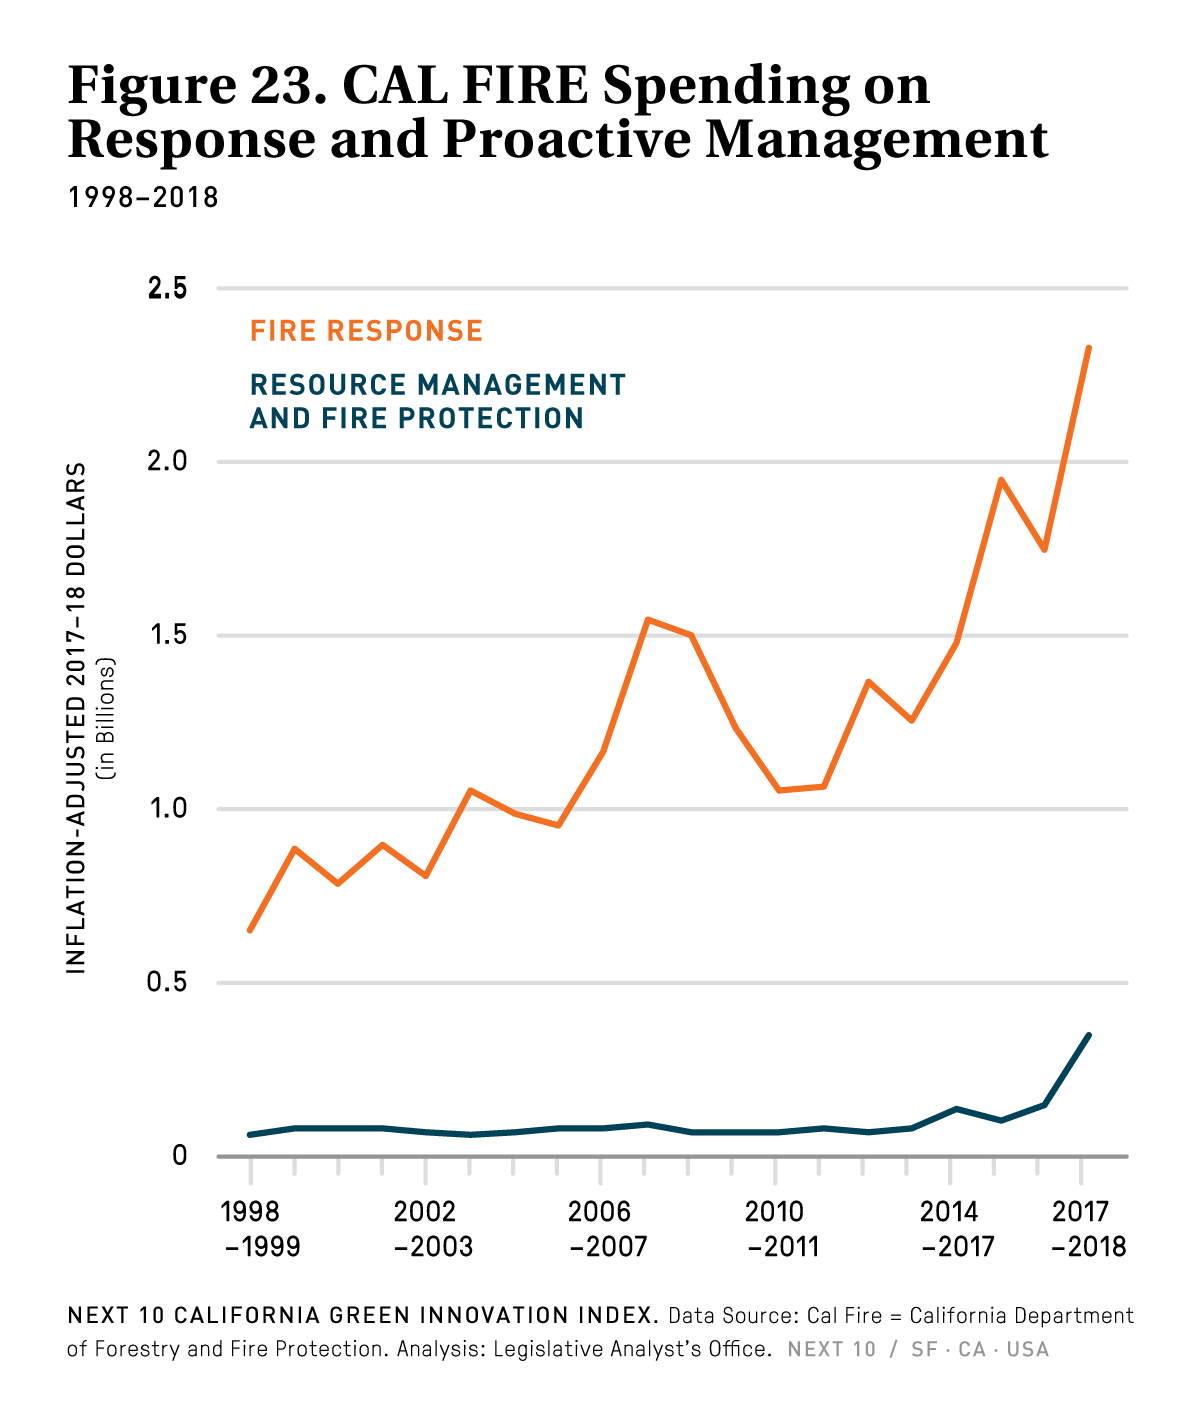
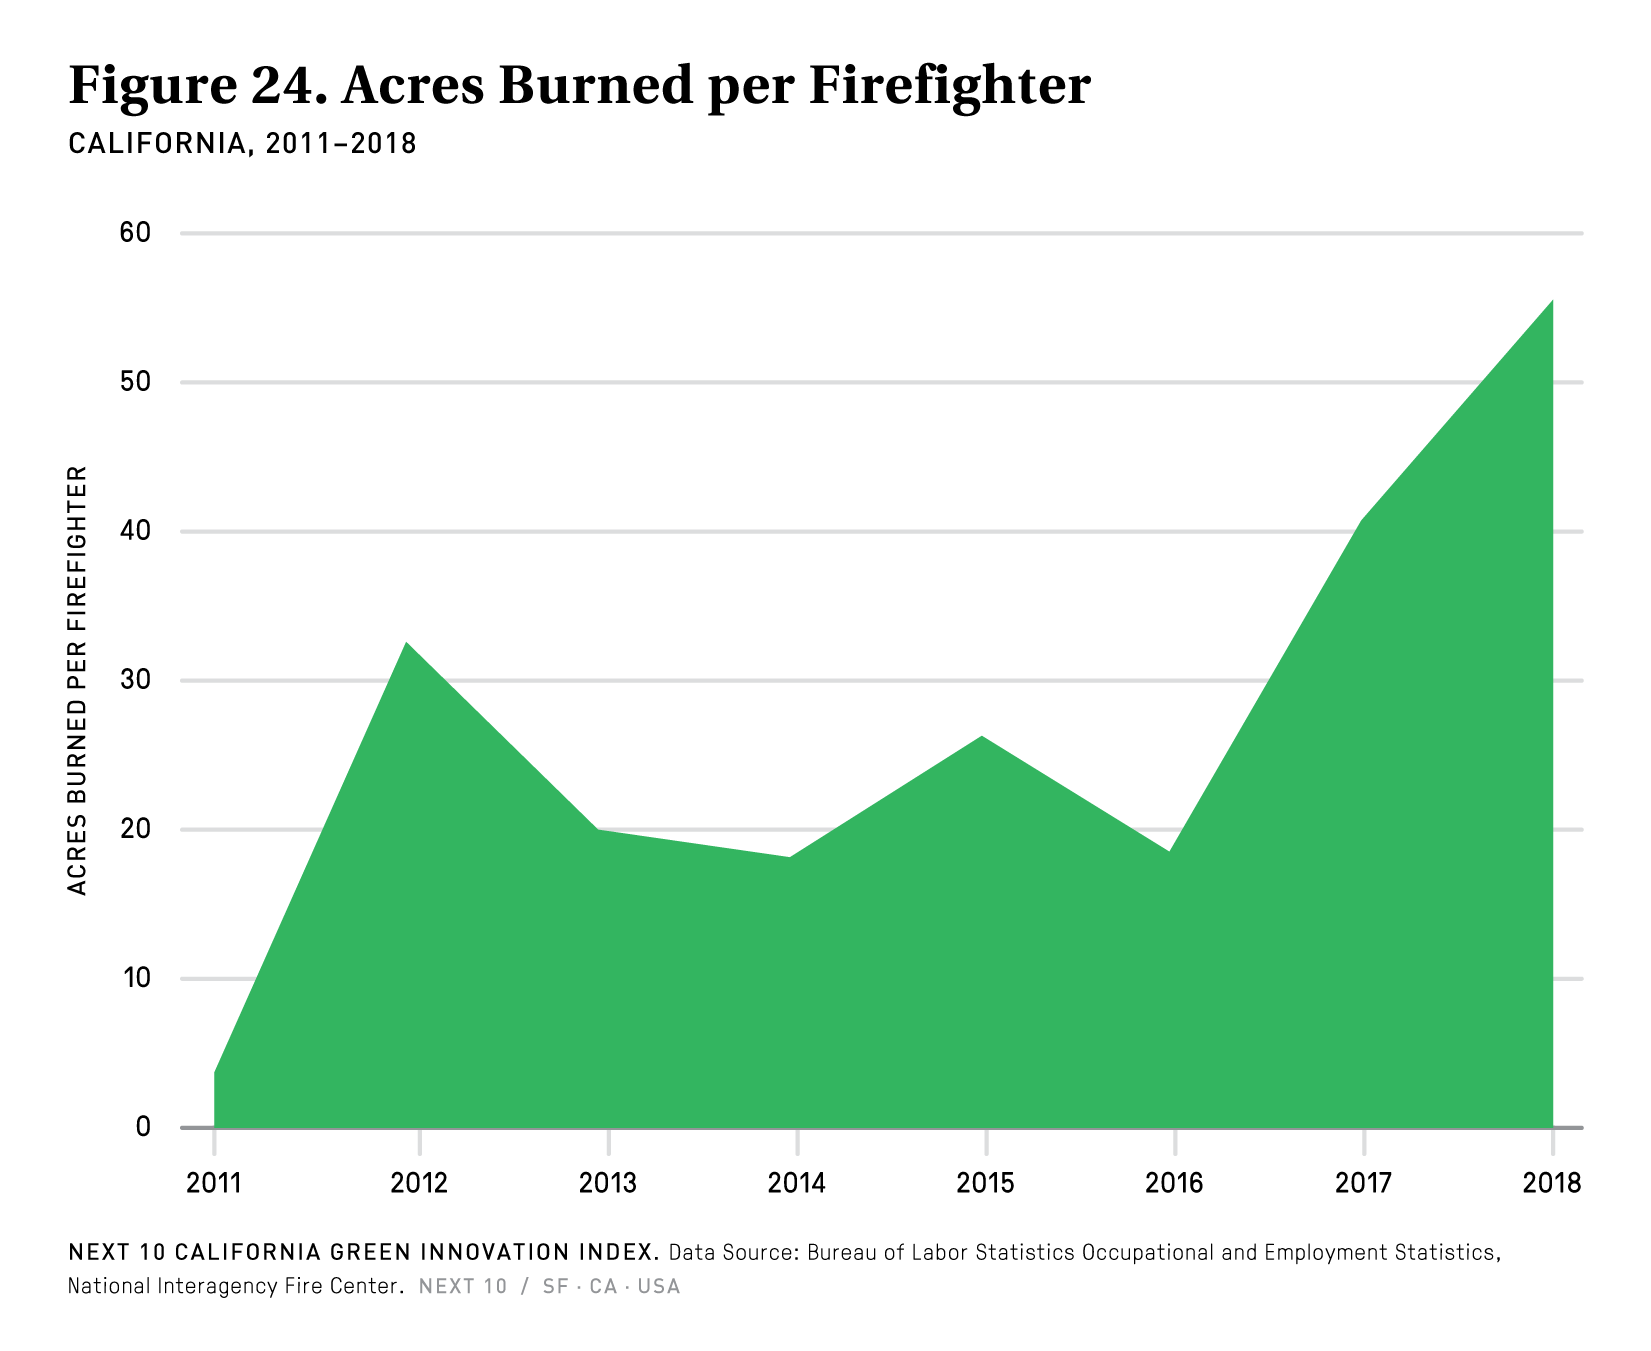
Wildfire
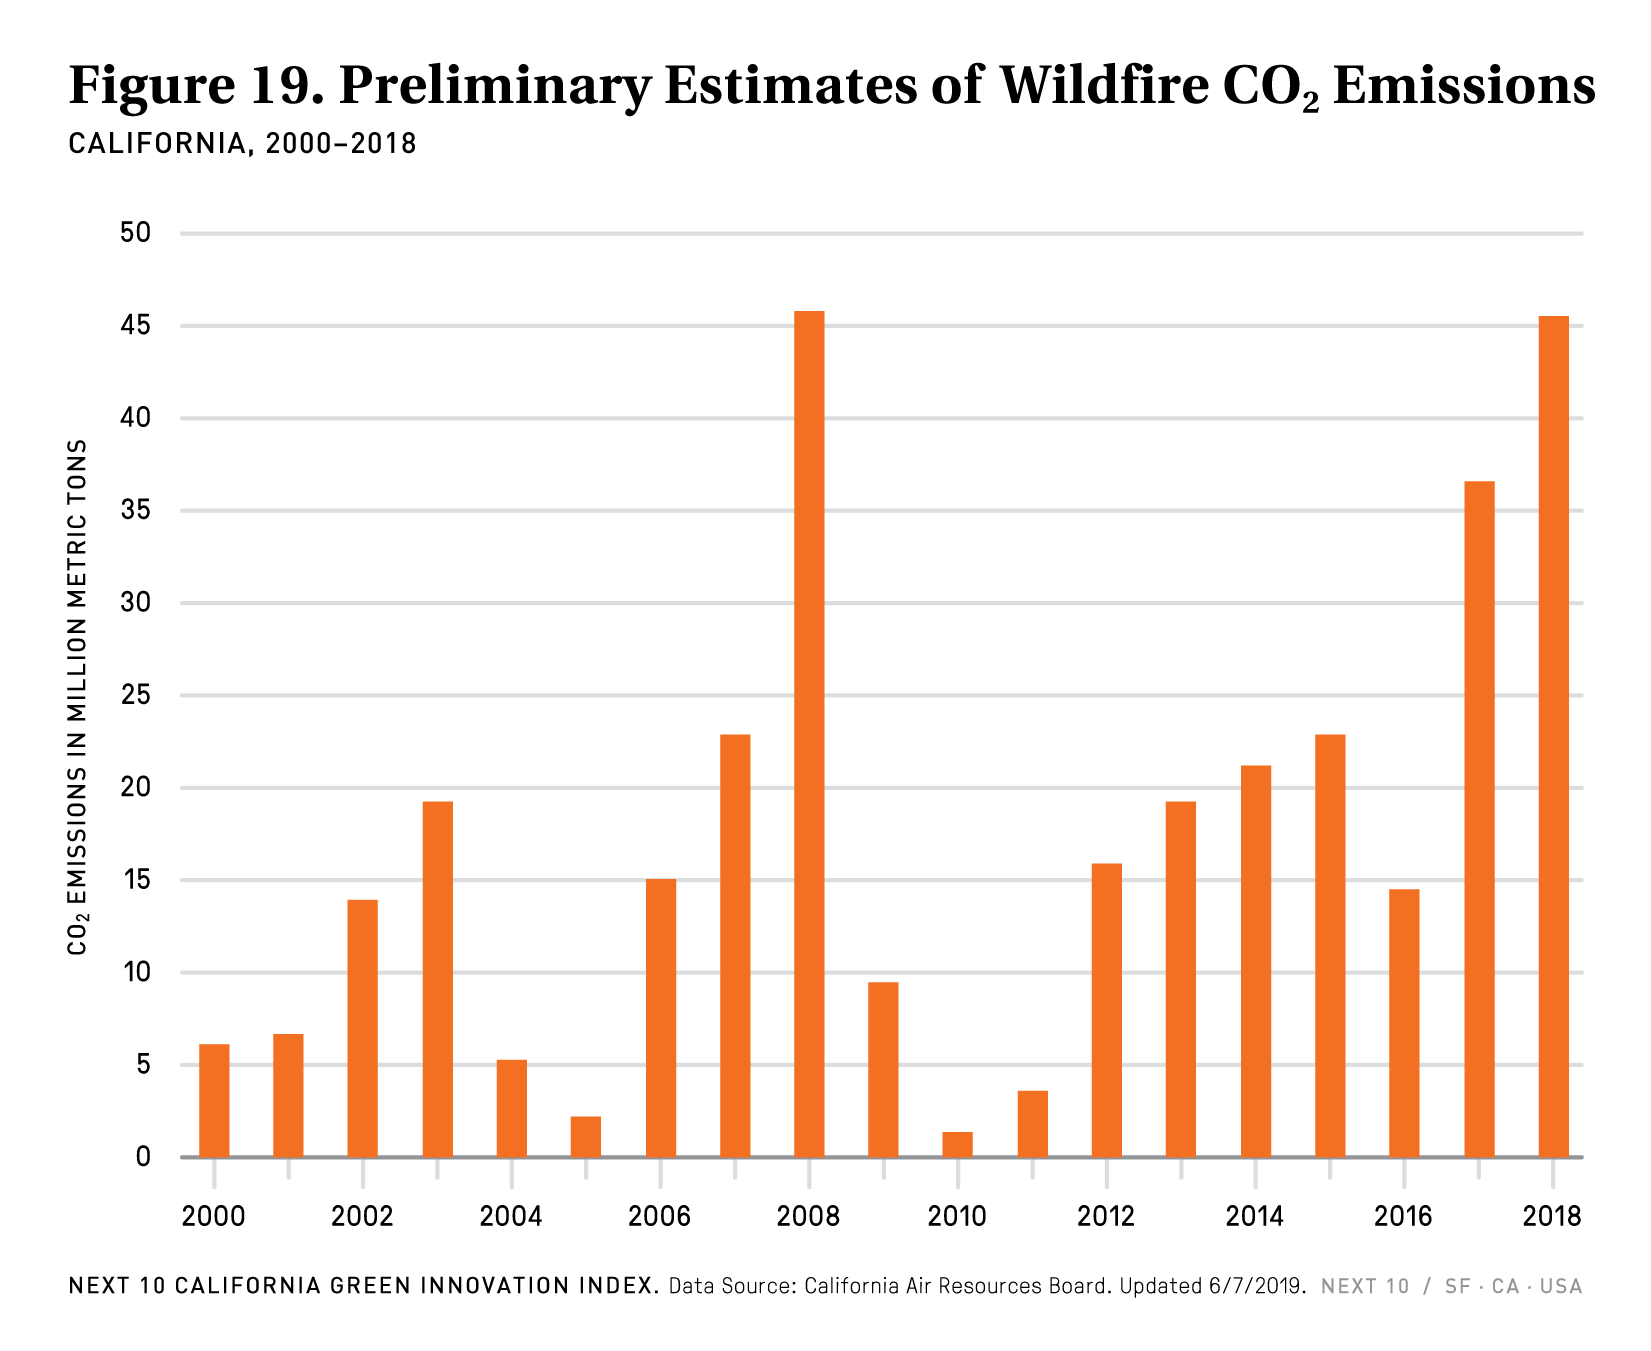
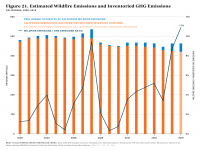
- California wildfires in 2018 emitted an estimated 45.5 million metric tons of carbon dioxide (MMTCO2) emissions—a 24 percent increase from 2017, when California wildfires released an estimated total of 36.7 MMTCO2.
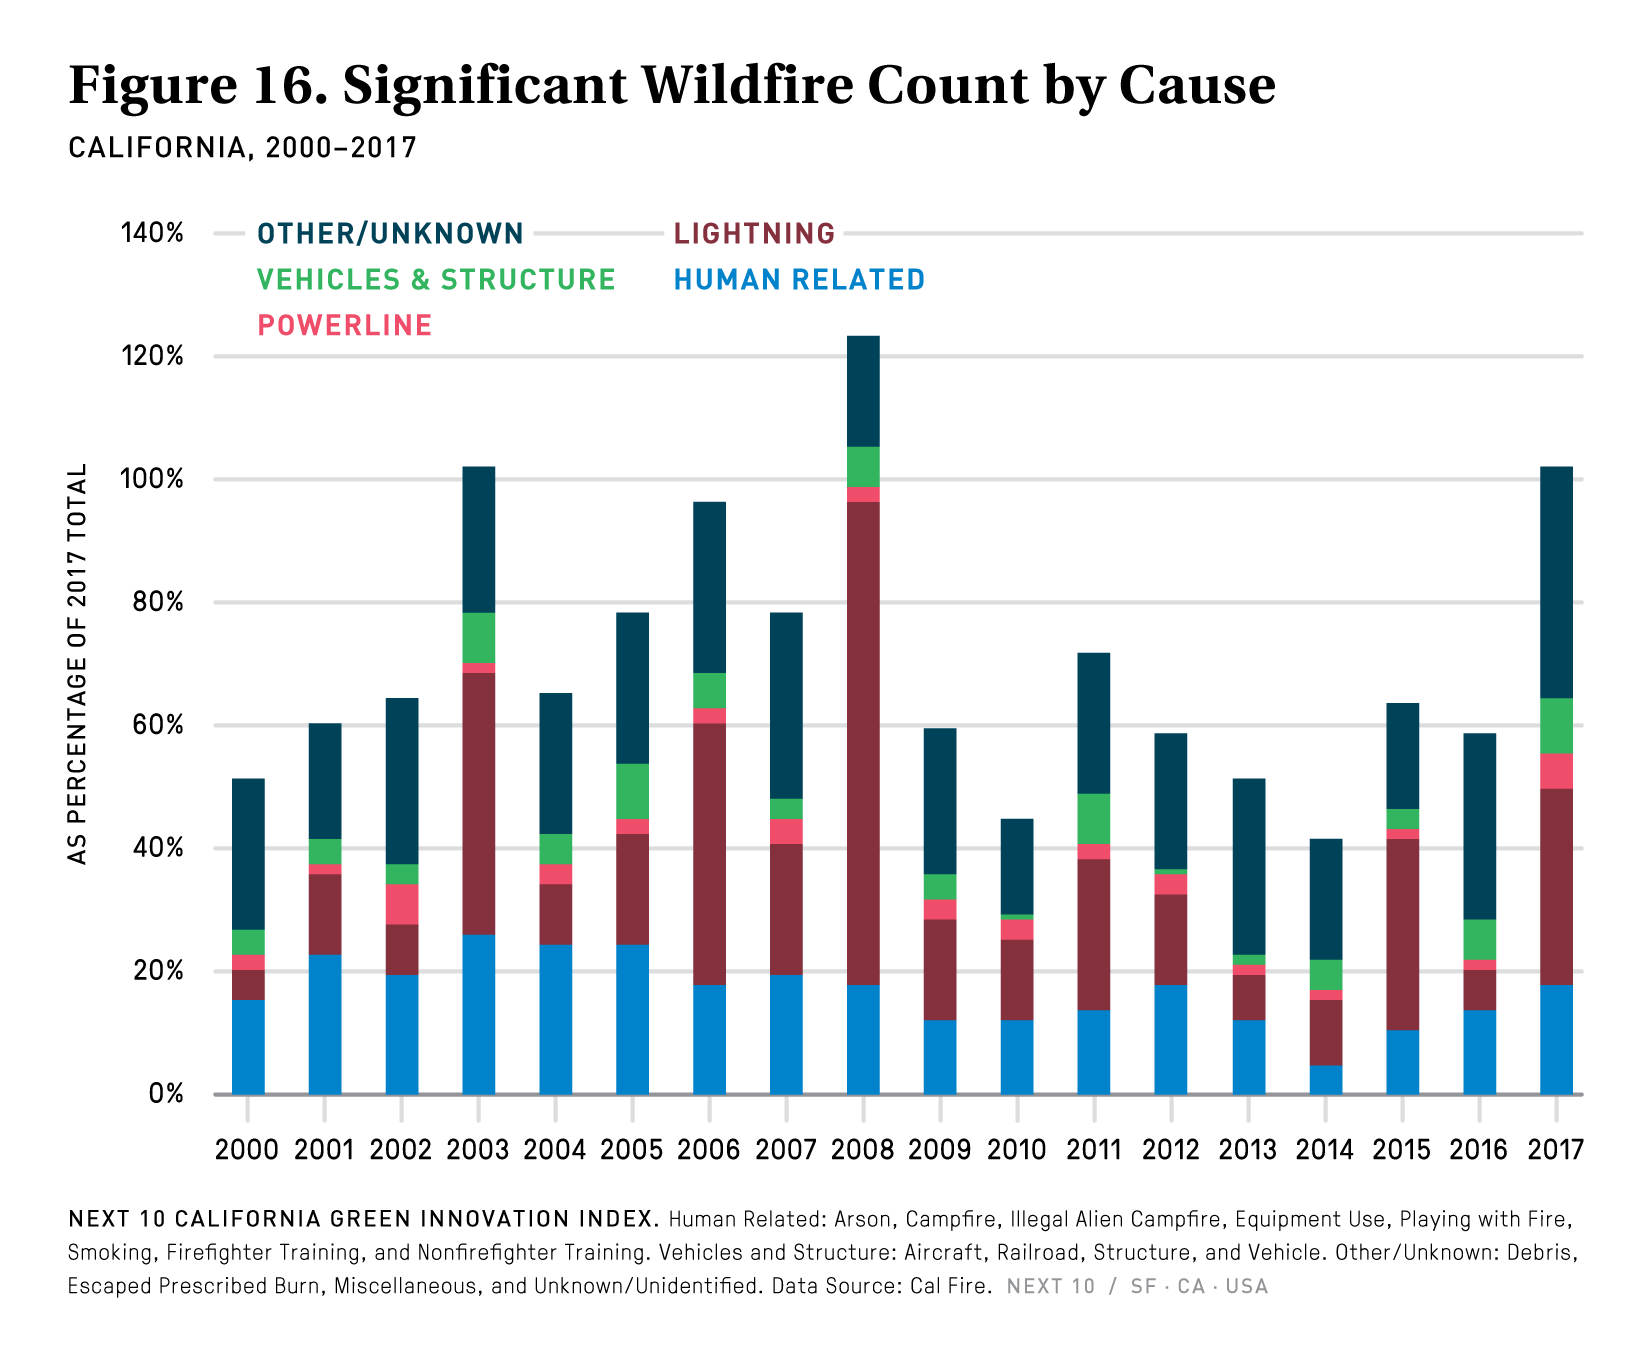
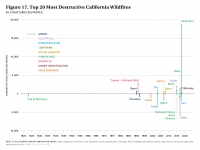
- Not only are wildfires becoming more severe, the frequency of historically-destructive fires has also been increasing over the last decade.
- Ten of the state’s 20 most destructive fires occurred since 2010, and 19 of them have occurred within the last 30 years.
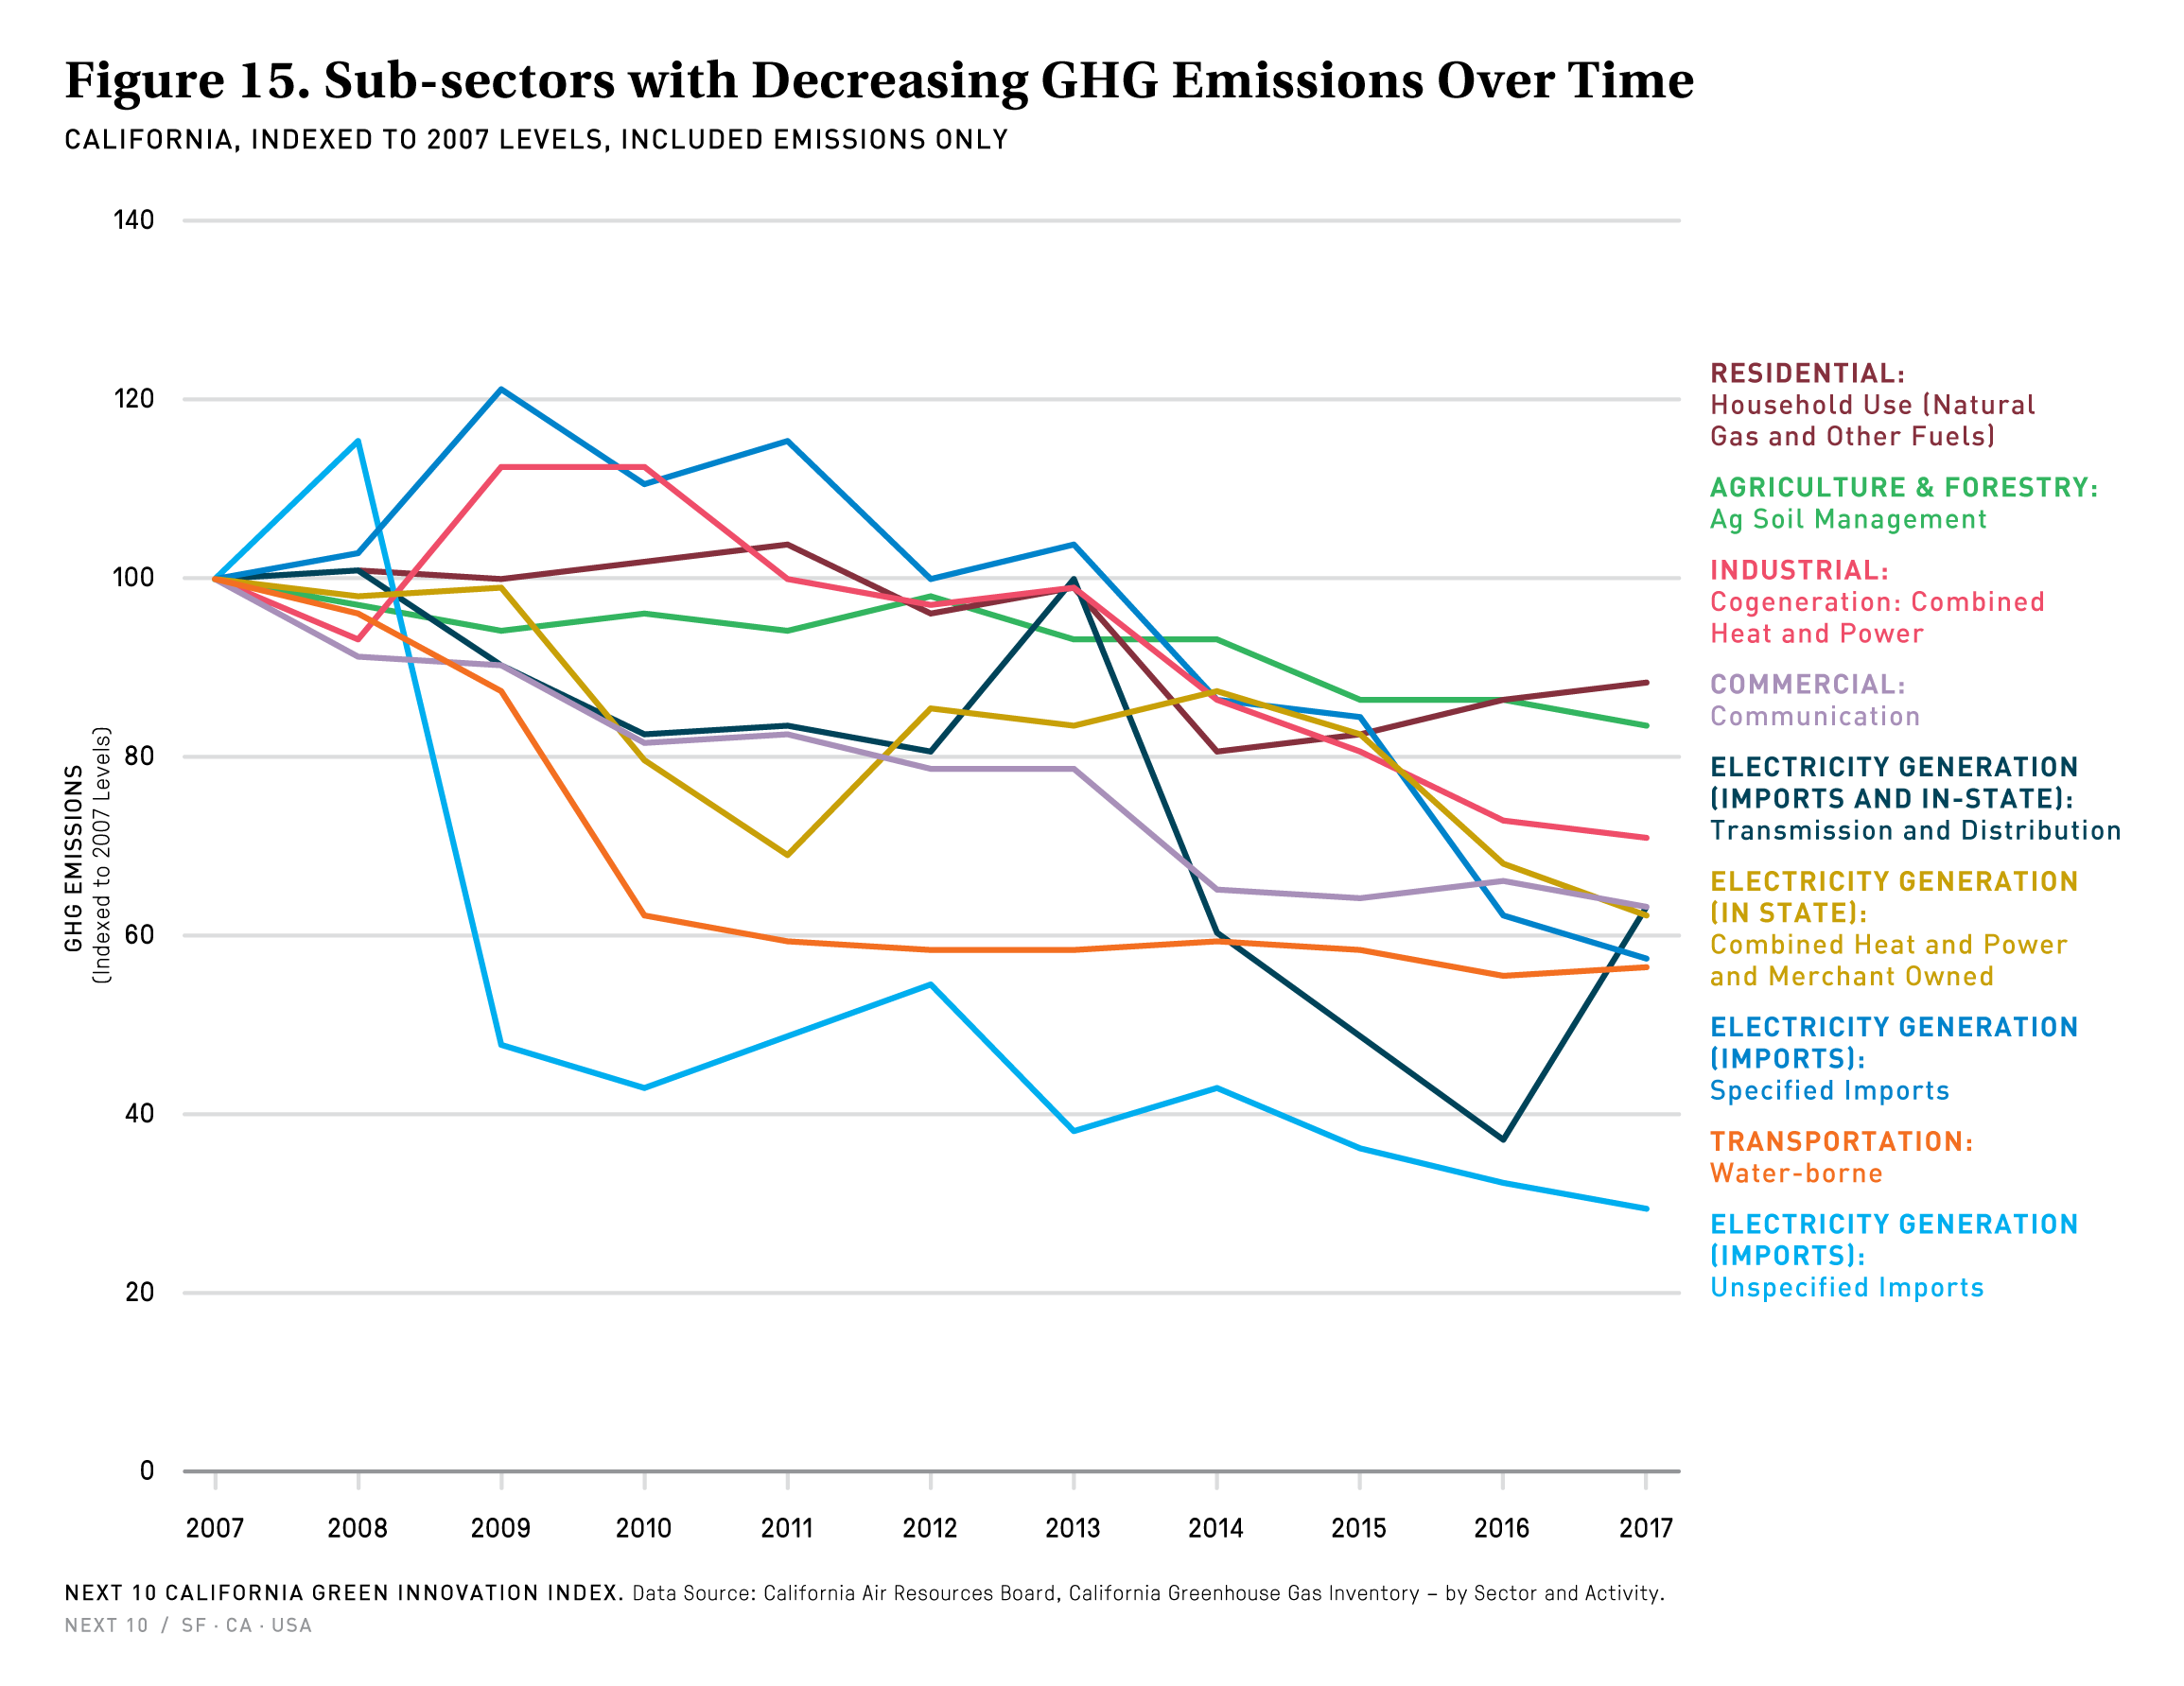
- Between 2000 and 2017, the number one cause of wildfires was those categorized as “other” — which includes debris, escaped prescribed burn, miscellaneous causes, and unknown/unidentified—(34.2%), followed by lightning (31.1%), human-caused (23.7%), vehicles/structure (7%), and powerlines (4%).
- While powerlines may not cause the most fires, they tend to cause the most destructive fires in terms of the number of structures destroyed, as powerlines are located in more populated areas of the state.
- California’s most destructive fire to date—the Camp Fire in Butte County in November 2018—was caused by powerlines and destroyed 18,804 structures.
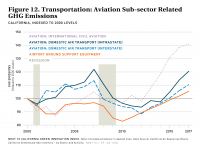
Landfills
- As the economy continues to grow, people consume more, and solid waste generation generally continues to increase. The state is not on track to meeting its goal of a 75 percent recycling rate by 2020 and will only face further challenges in meeting that goal as a result of no longer being able to send recycling to markets abroad, such as China.
- In 2017, Californians exported or sent to landfills 37.8 million tons of waste, up 7.4 percent compared to 2016.
- As landfills are burdened with an increasing amount of waste, landfill emissions have gone up every single year since 2004.
- From 2007 to 2017, emissions from landfills have increased by 1.0 percent every year on average.
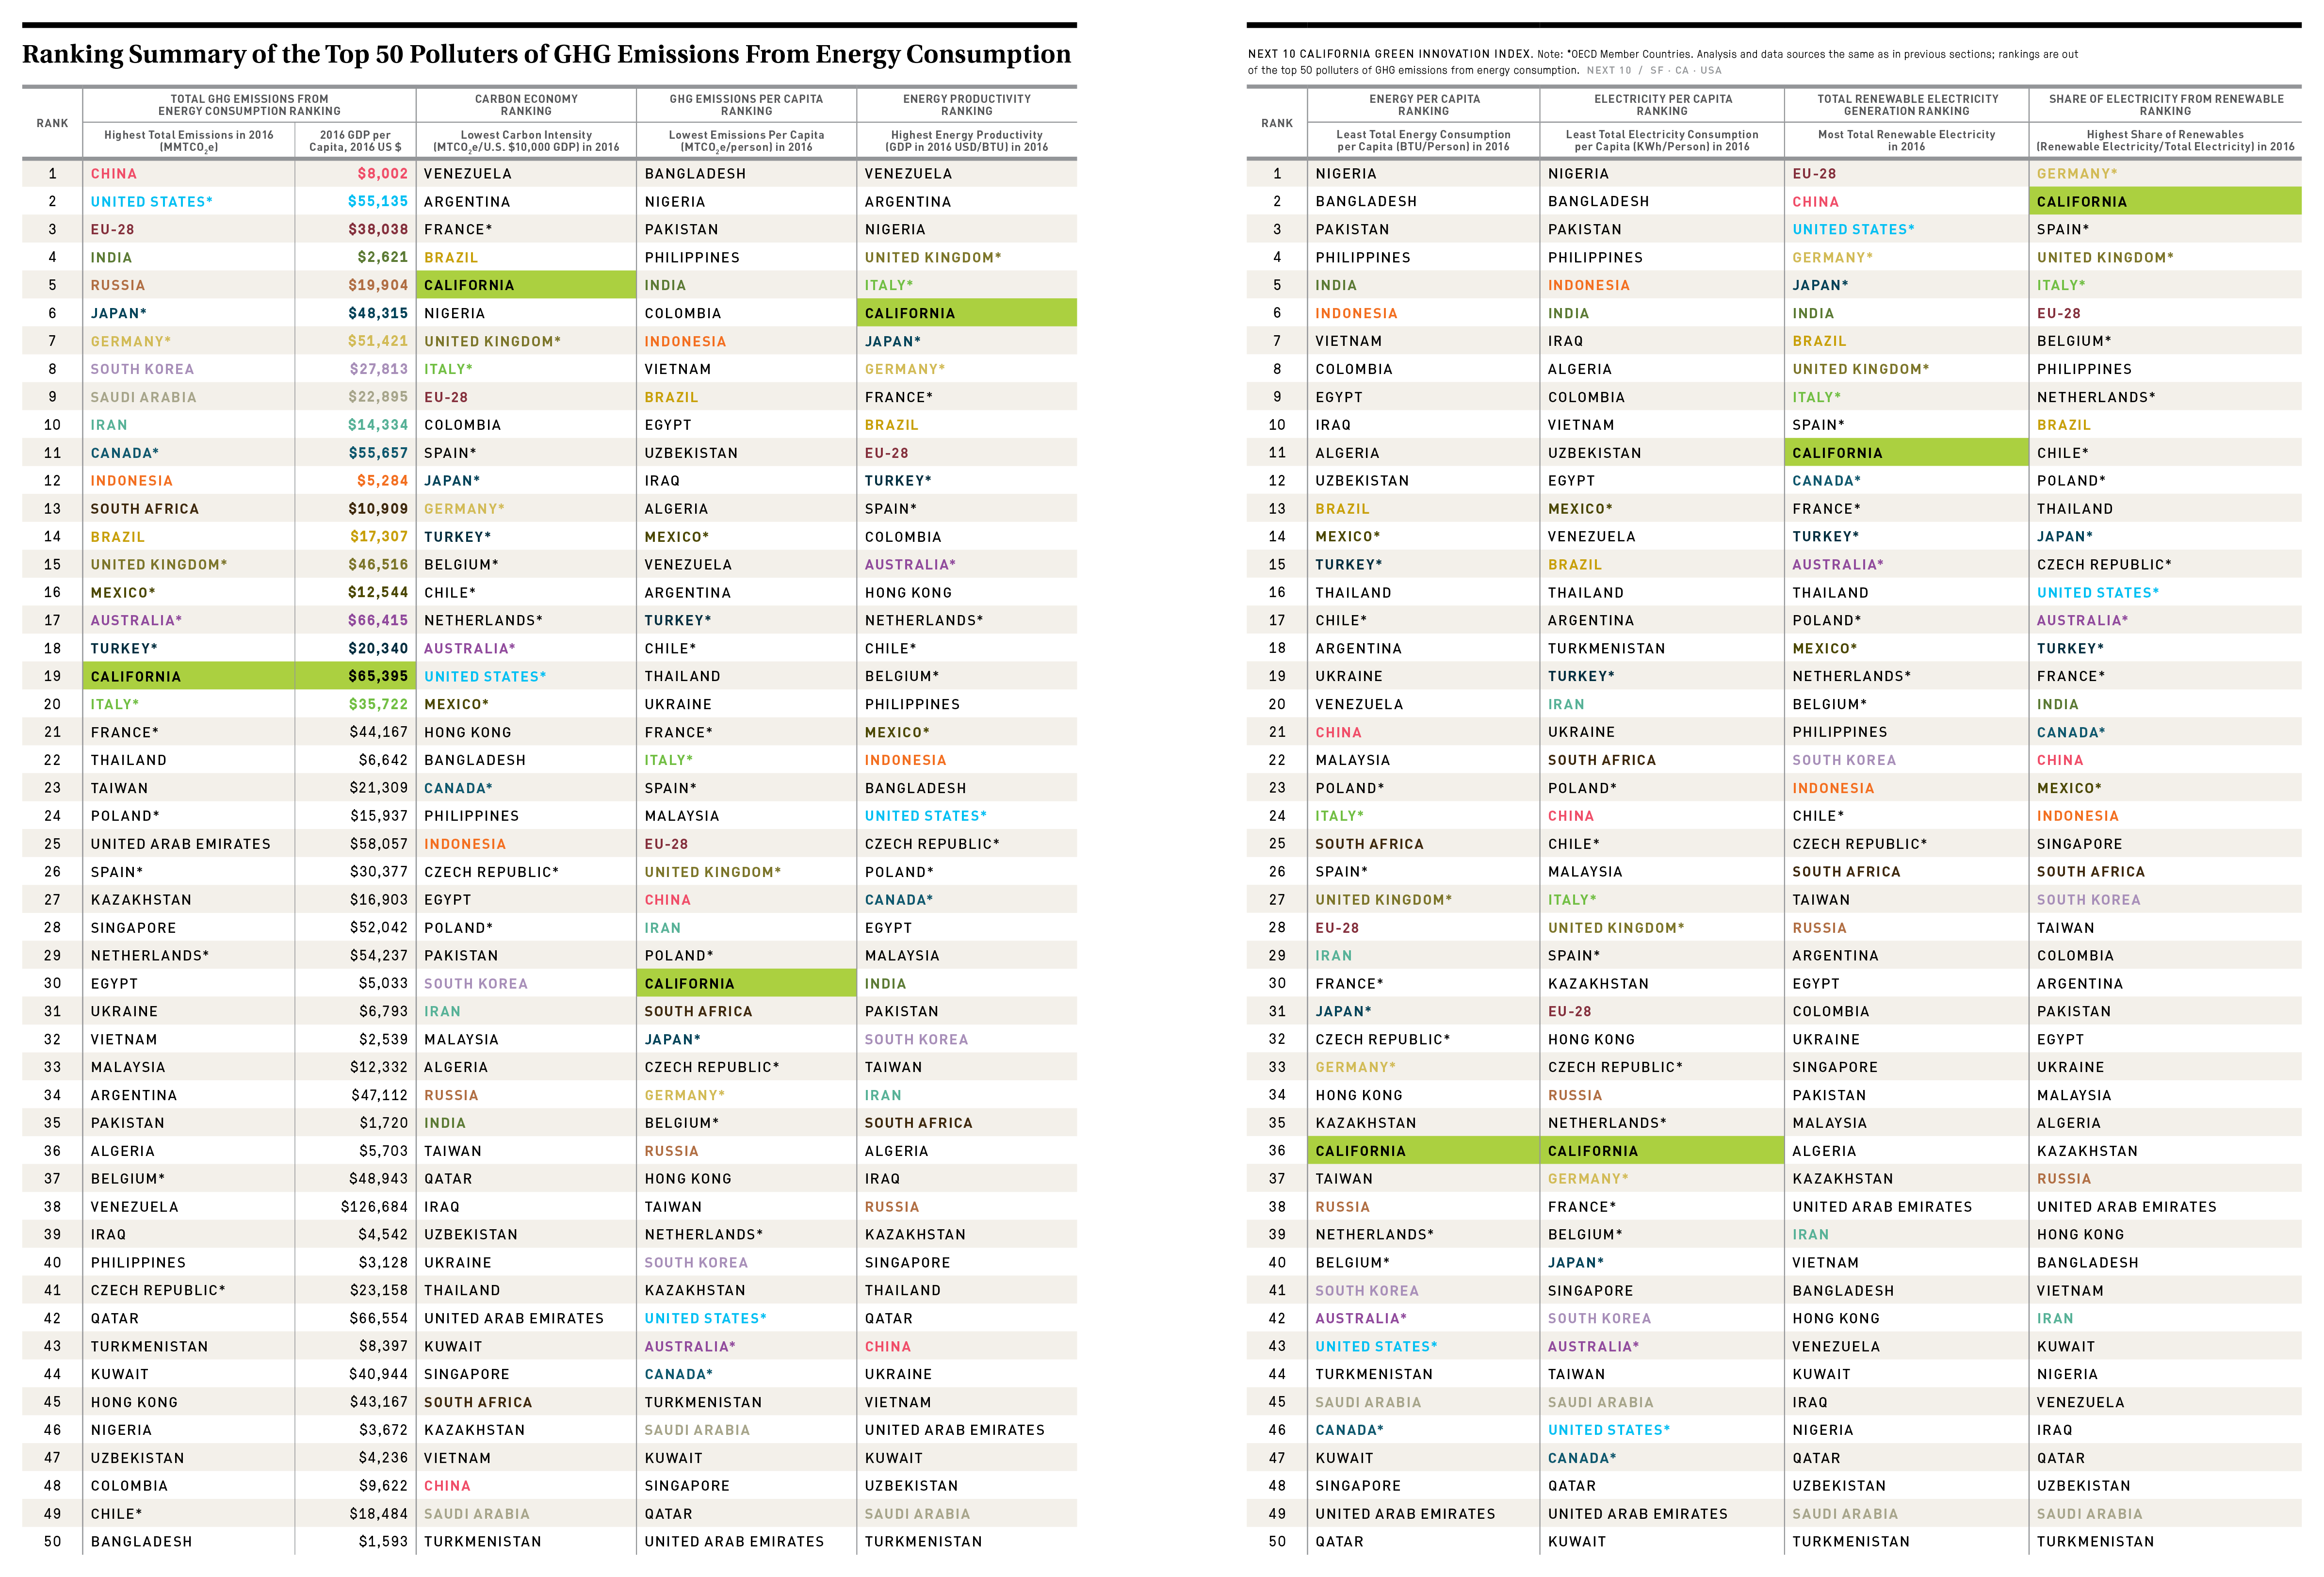
Carbon Economy
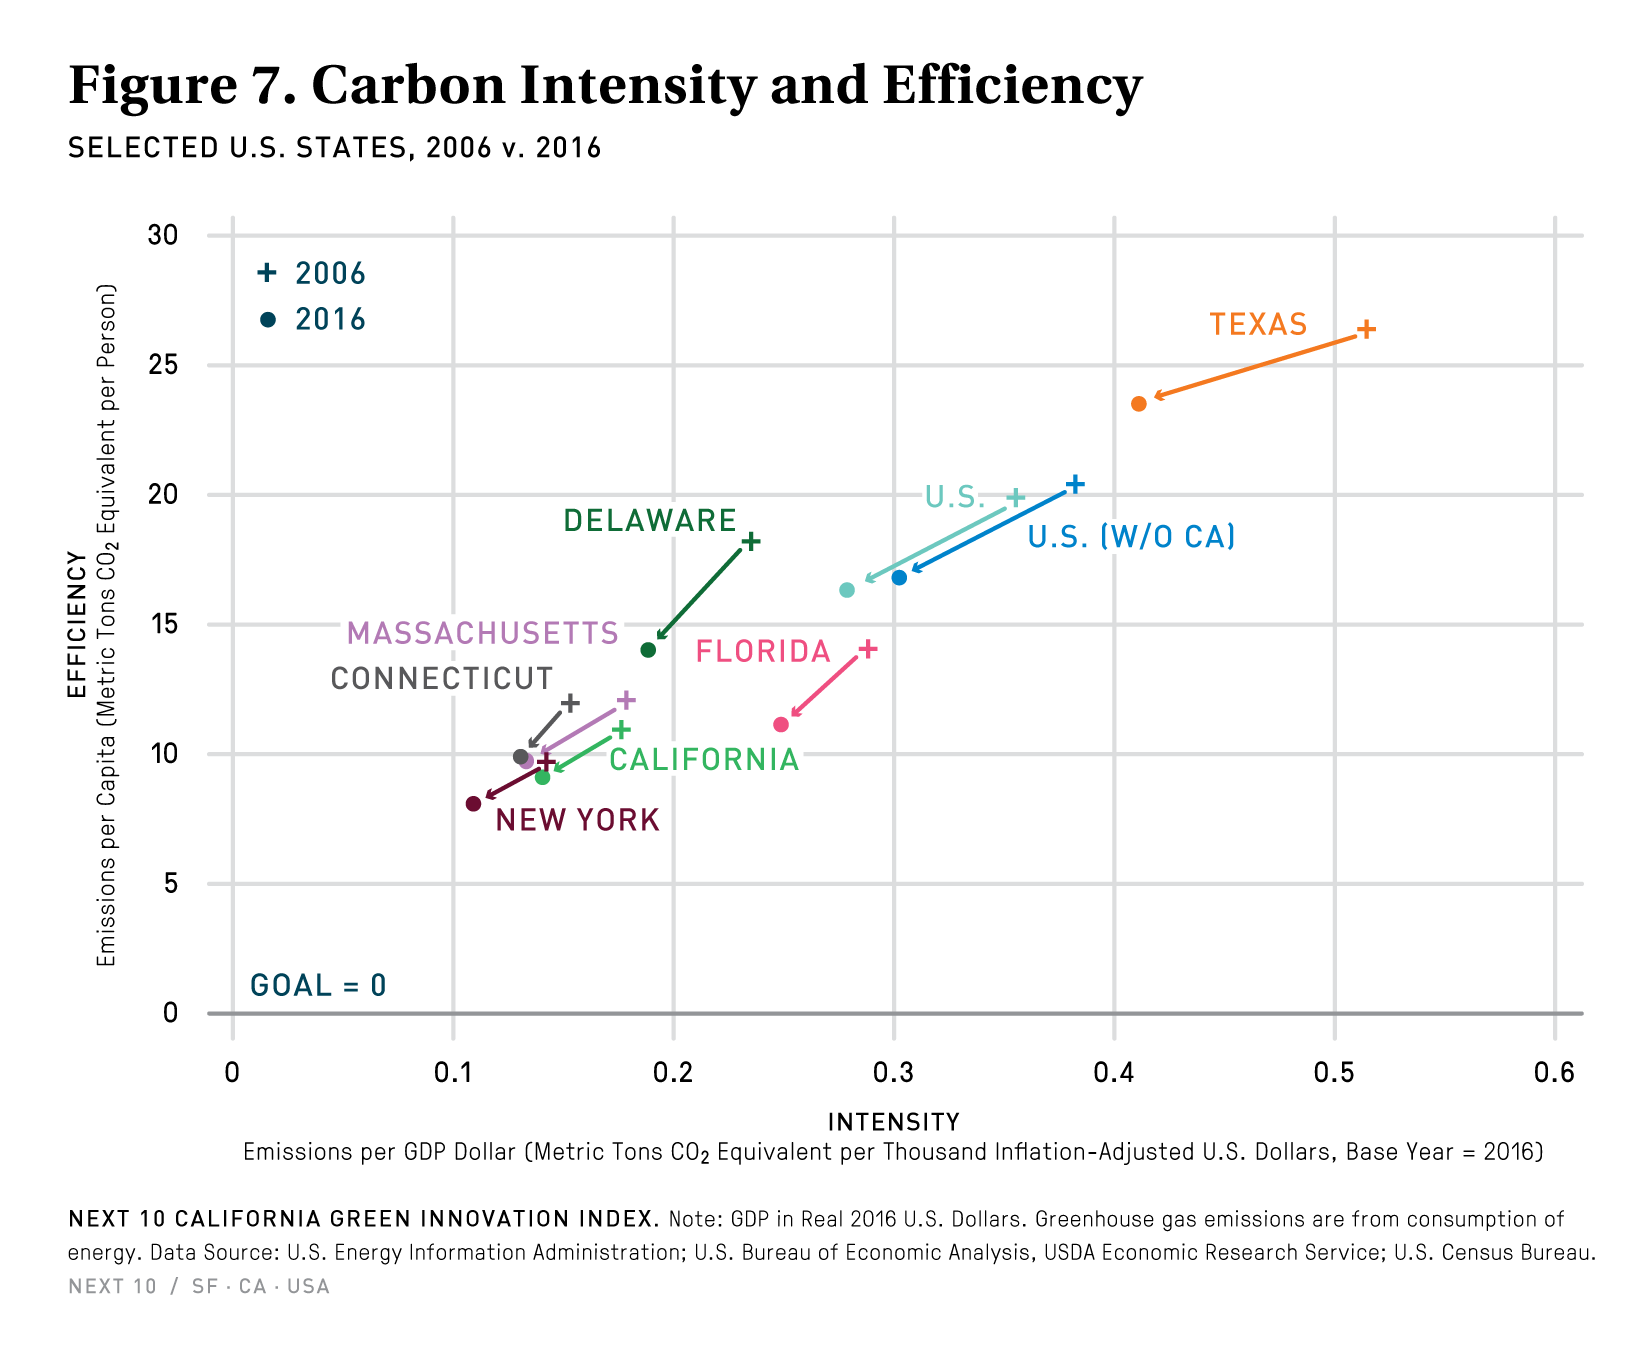
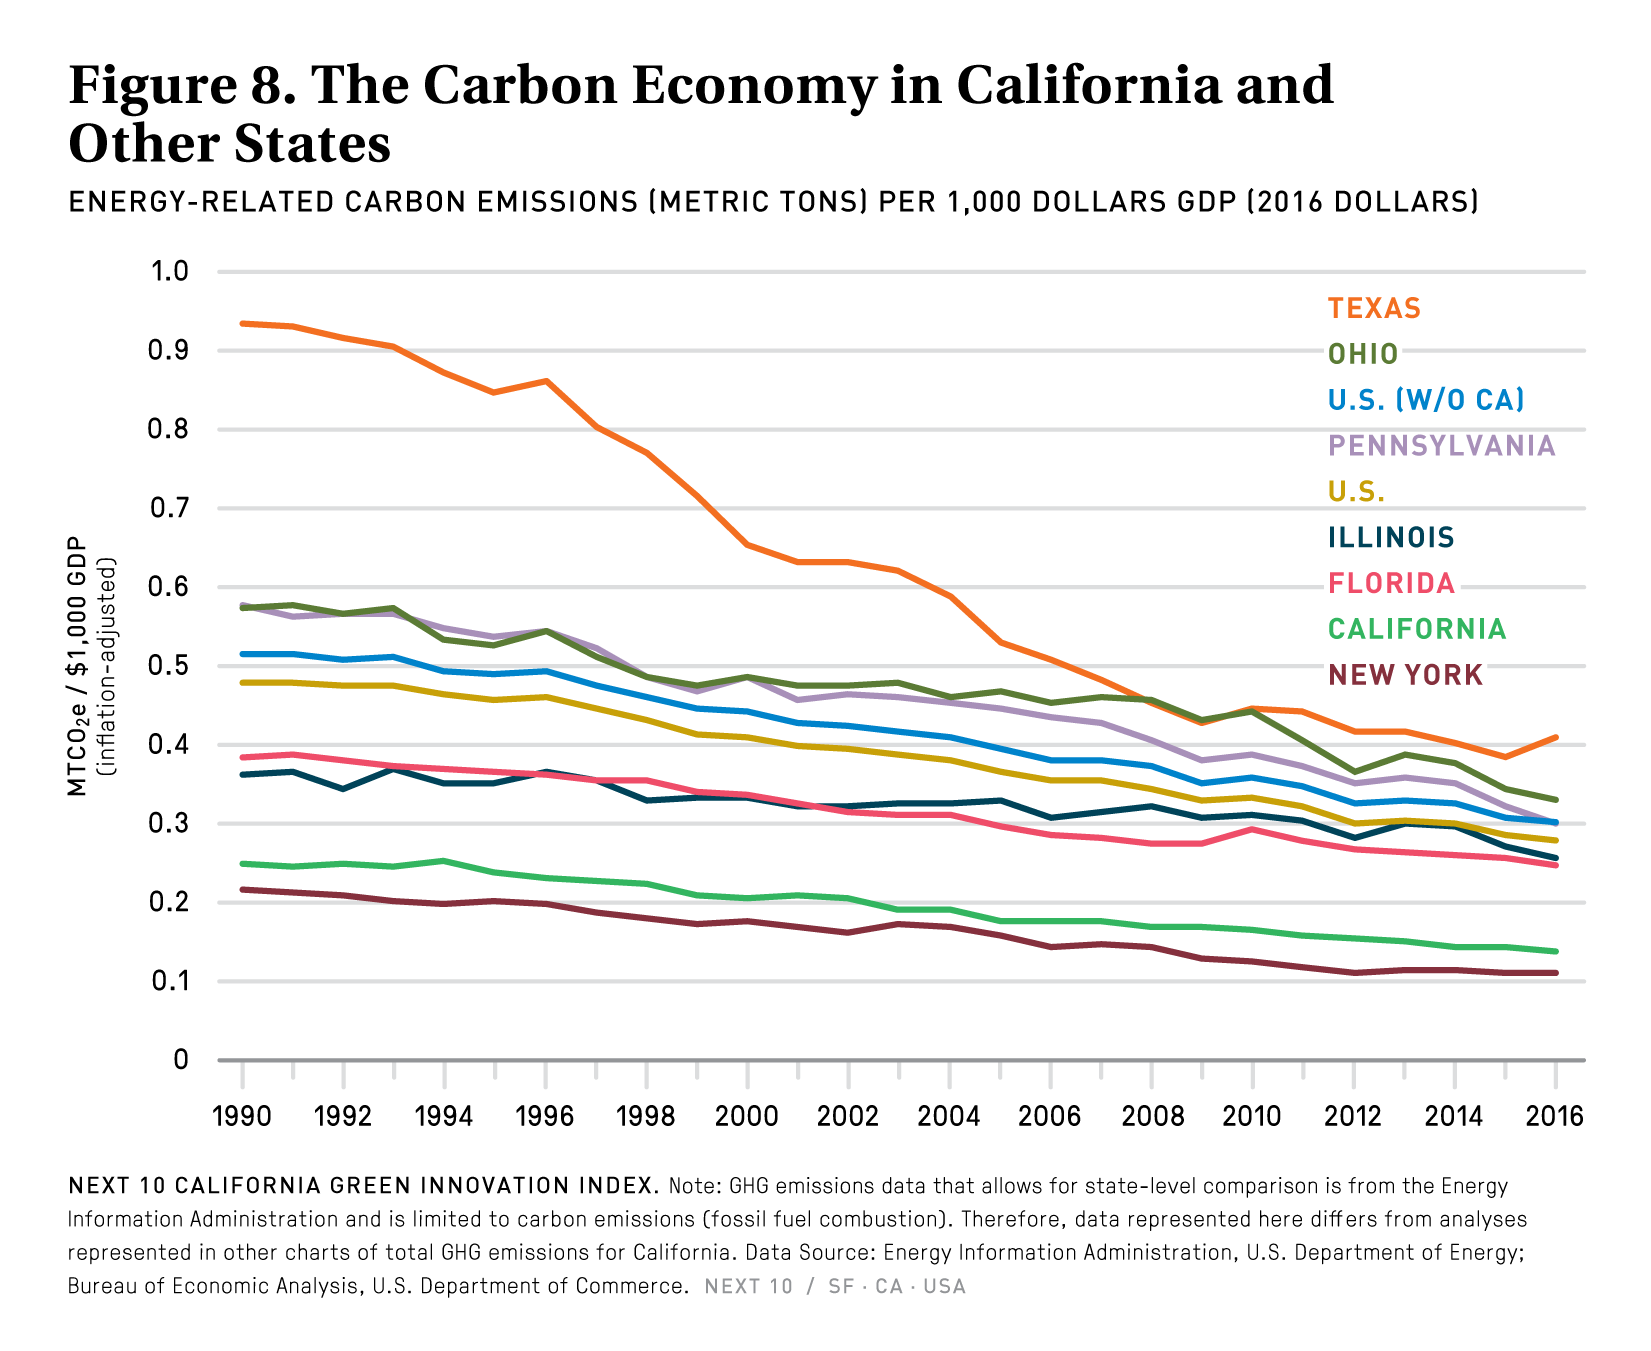
- California’s energy-related carbon dioxide emissions per capita were 9.2 MTCO2e per person in 2016—the second-lowest among the 50 states, behind New York—and have remained relatively constant since 2011.
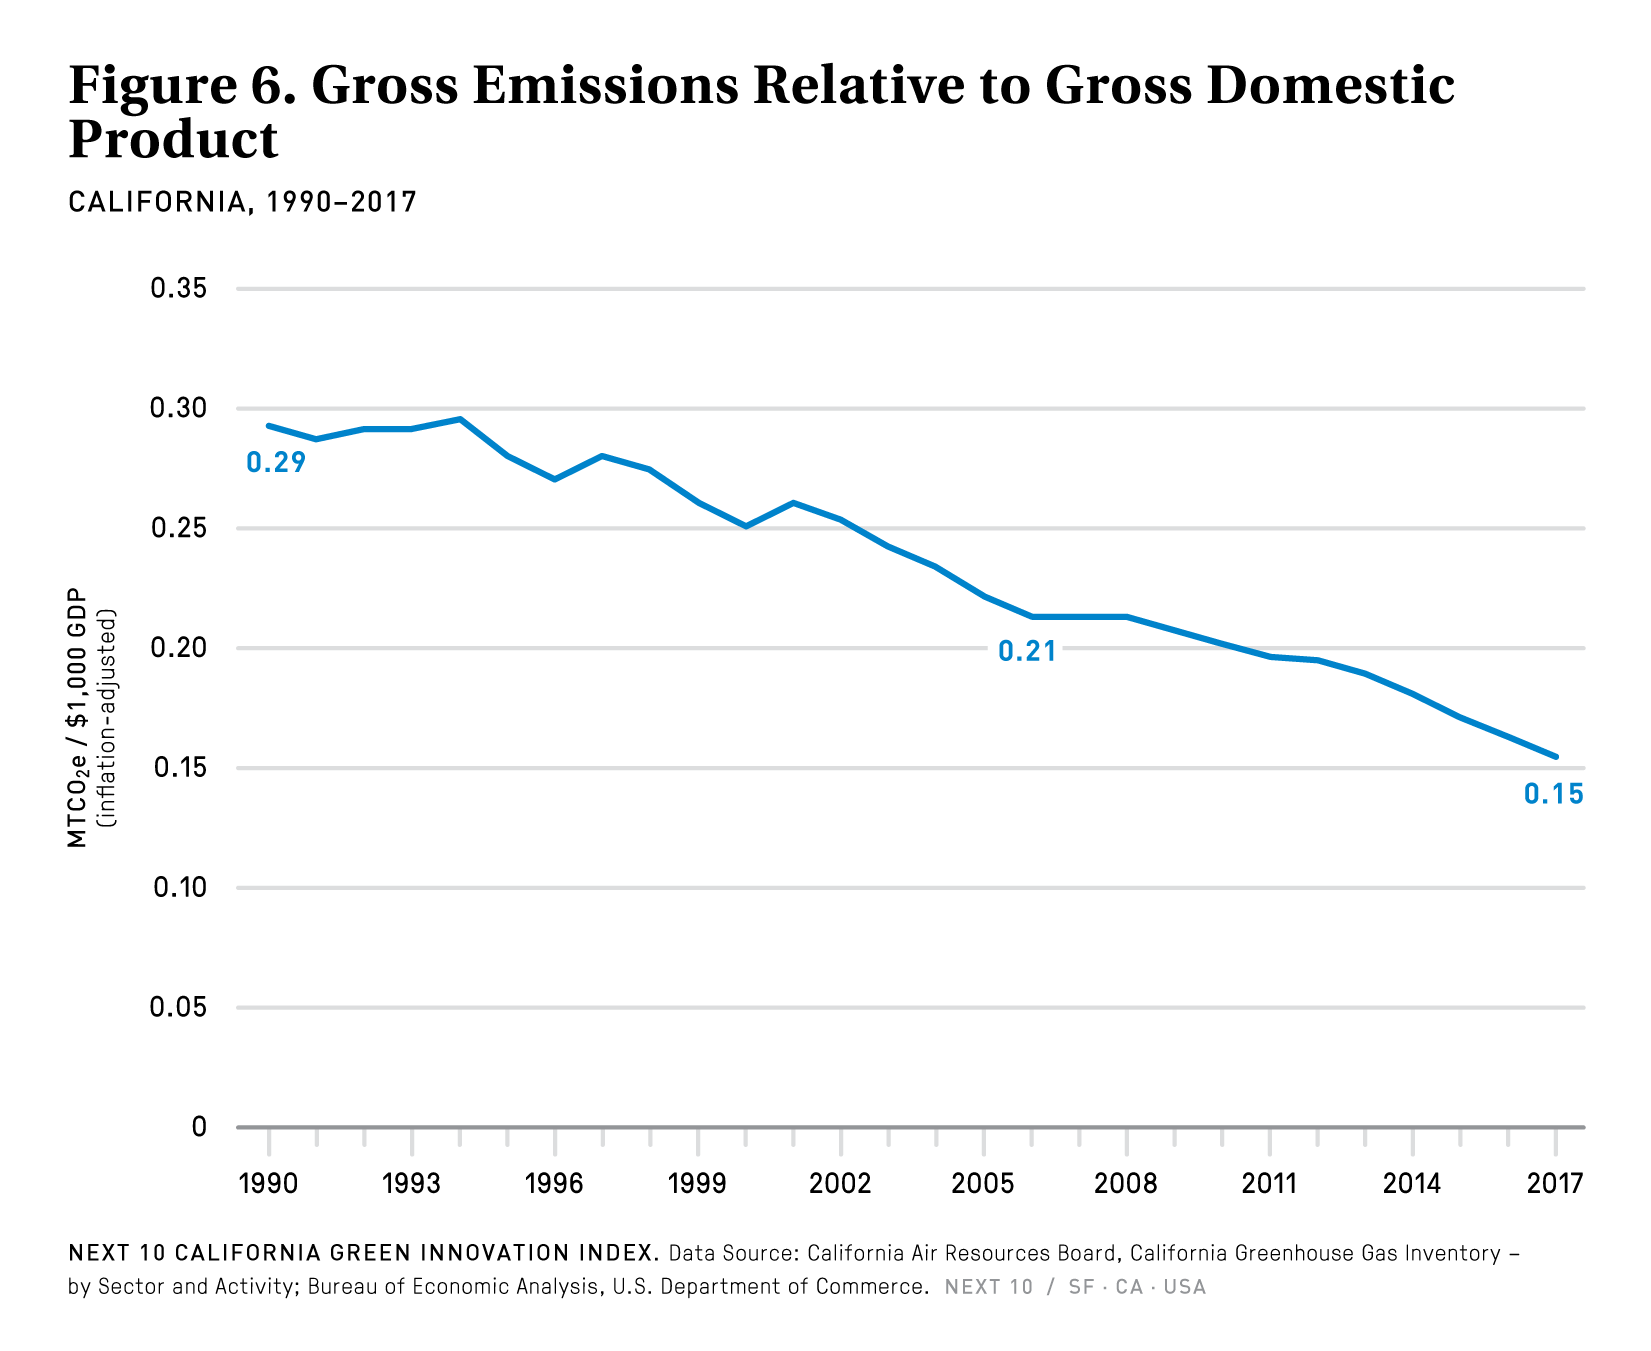
- California’s carbon intensity continues to improve. From 2012 to 2017, its carbon intensity declined at a rate of 4.53 percent per year—faster than the 10-year average of 3.18 percent from 2007 to 2017.
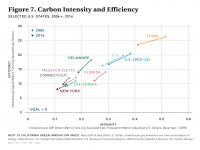
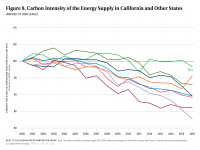
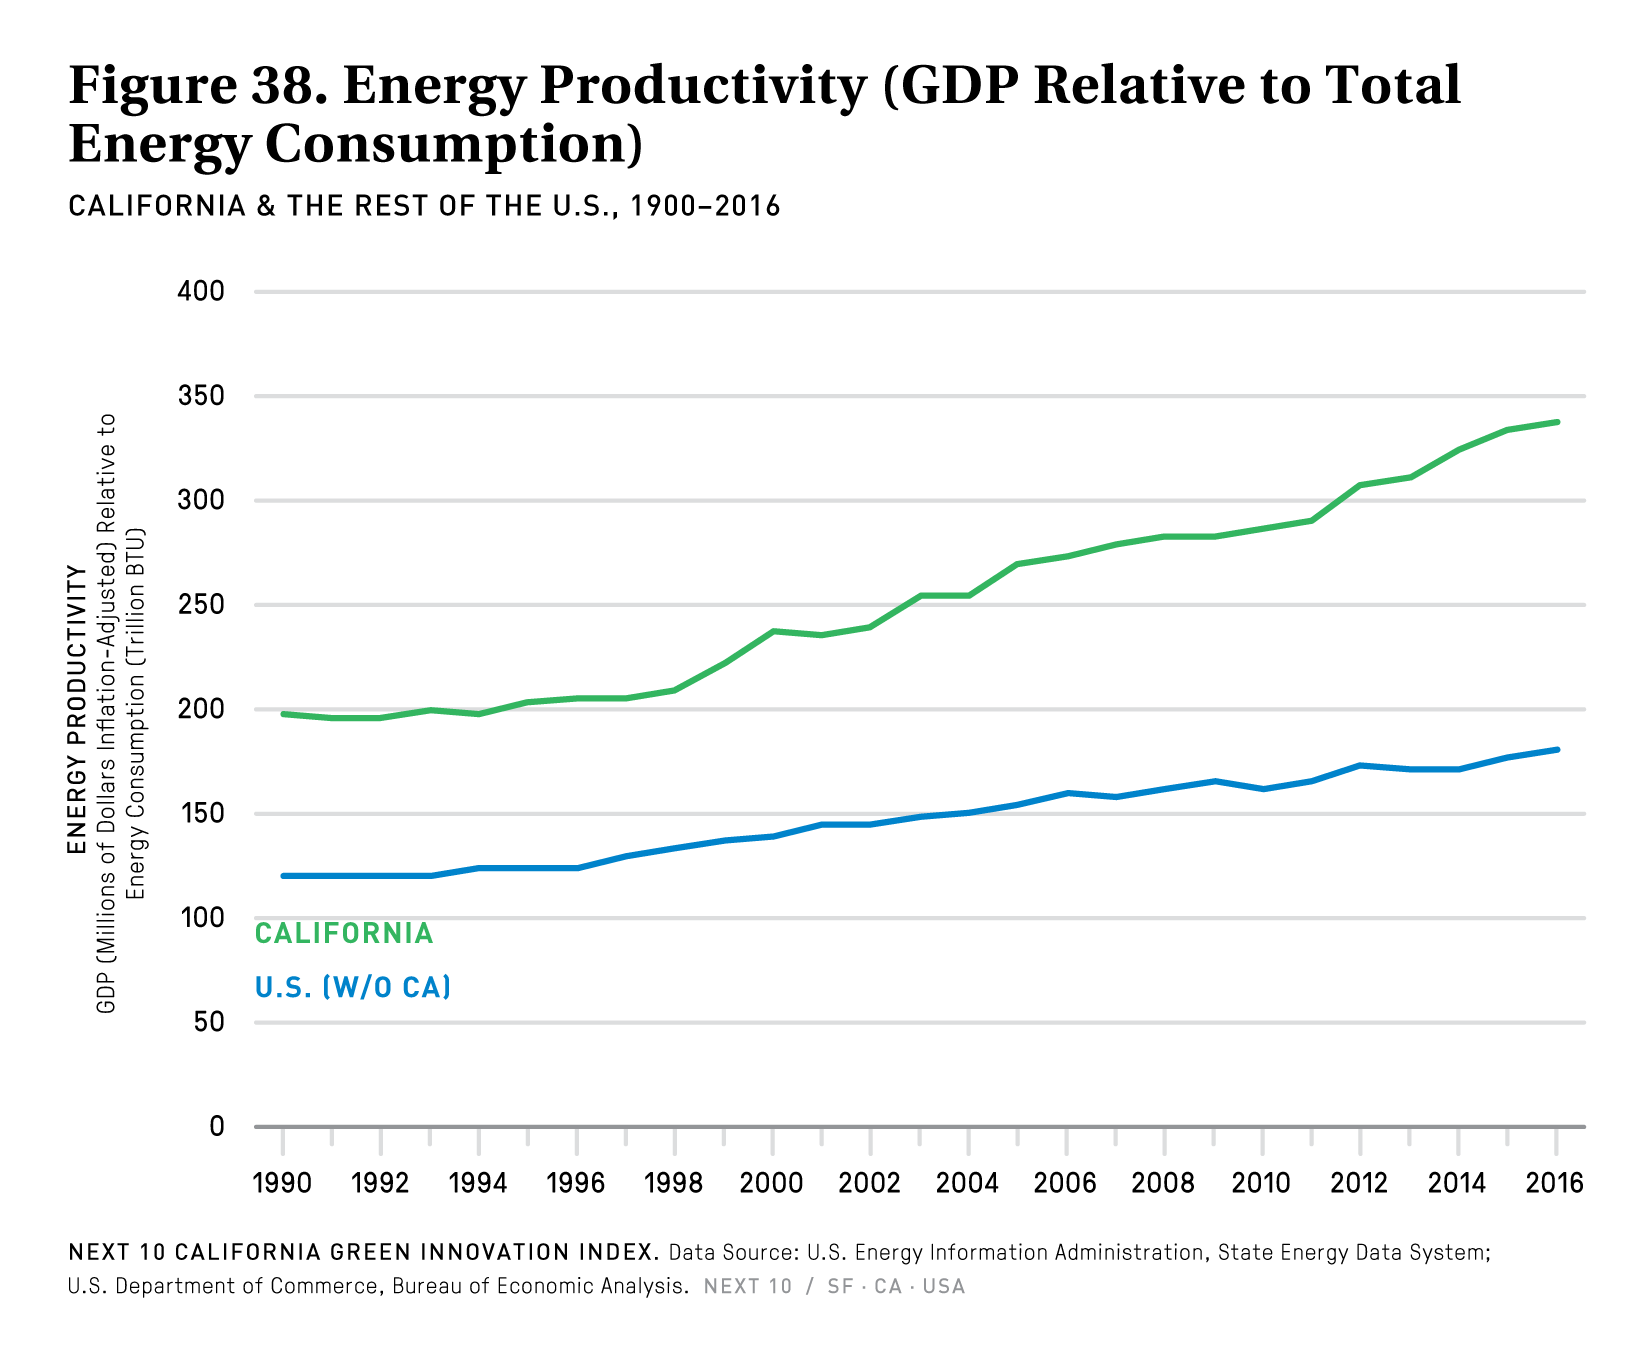
- In 2016, California’s carbon intensity relative to GDP was 54.3 percent lower than that of the rest of the U.S.
- Compared to the other populous states, California’s carbon intensity was 44.2 percent lower than Florida’s, 46.1 percent lower than Illinois’s, 54.1 percent lower than Pennsylvania’s, 58.2 percent lower than Ohio’s, and 66.2 percent lower than Texas’s in 2016.
Energy Efficiency
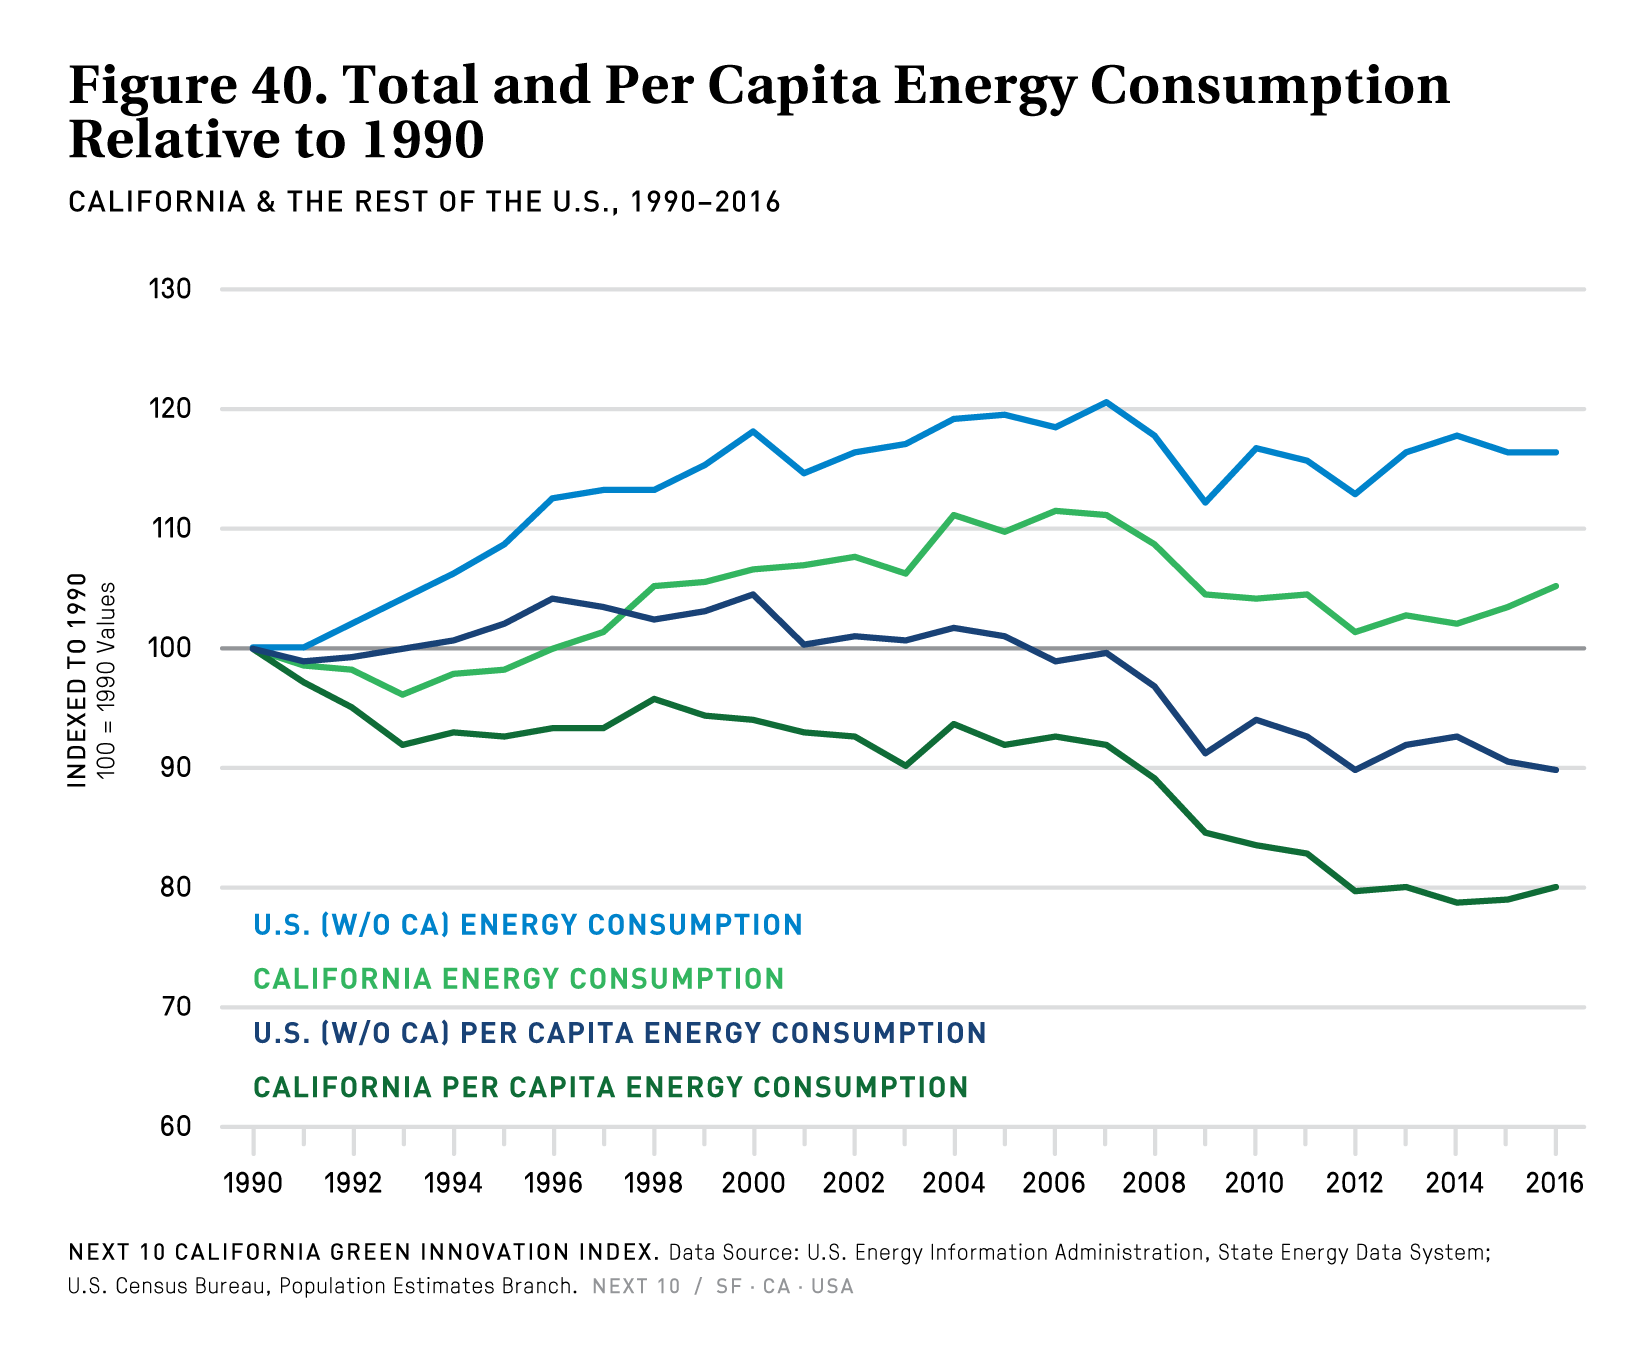
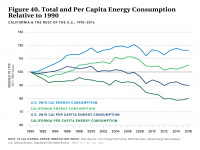
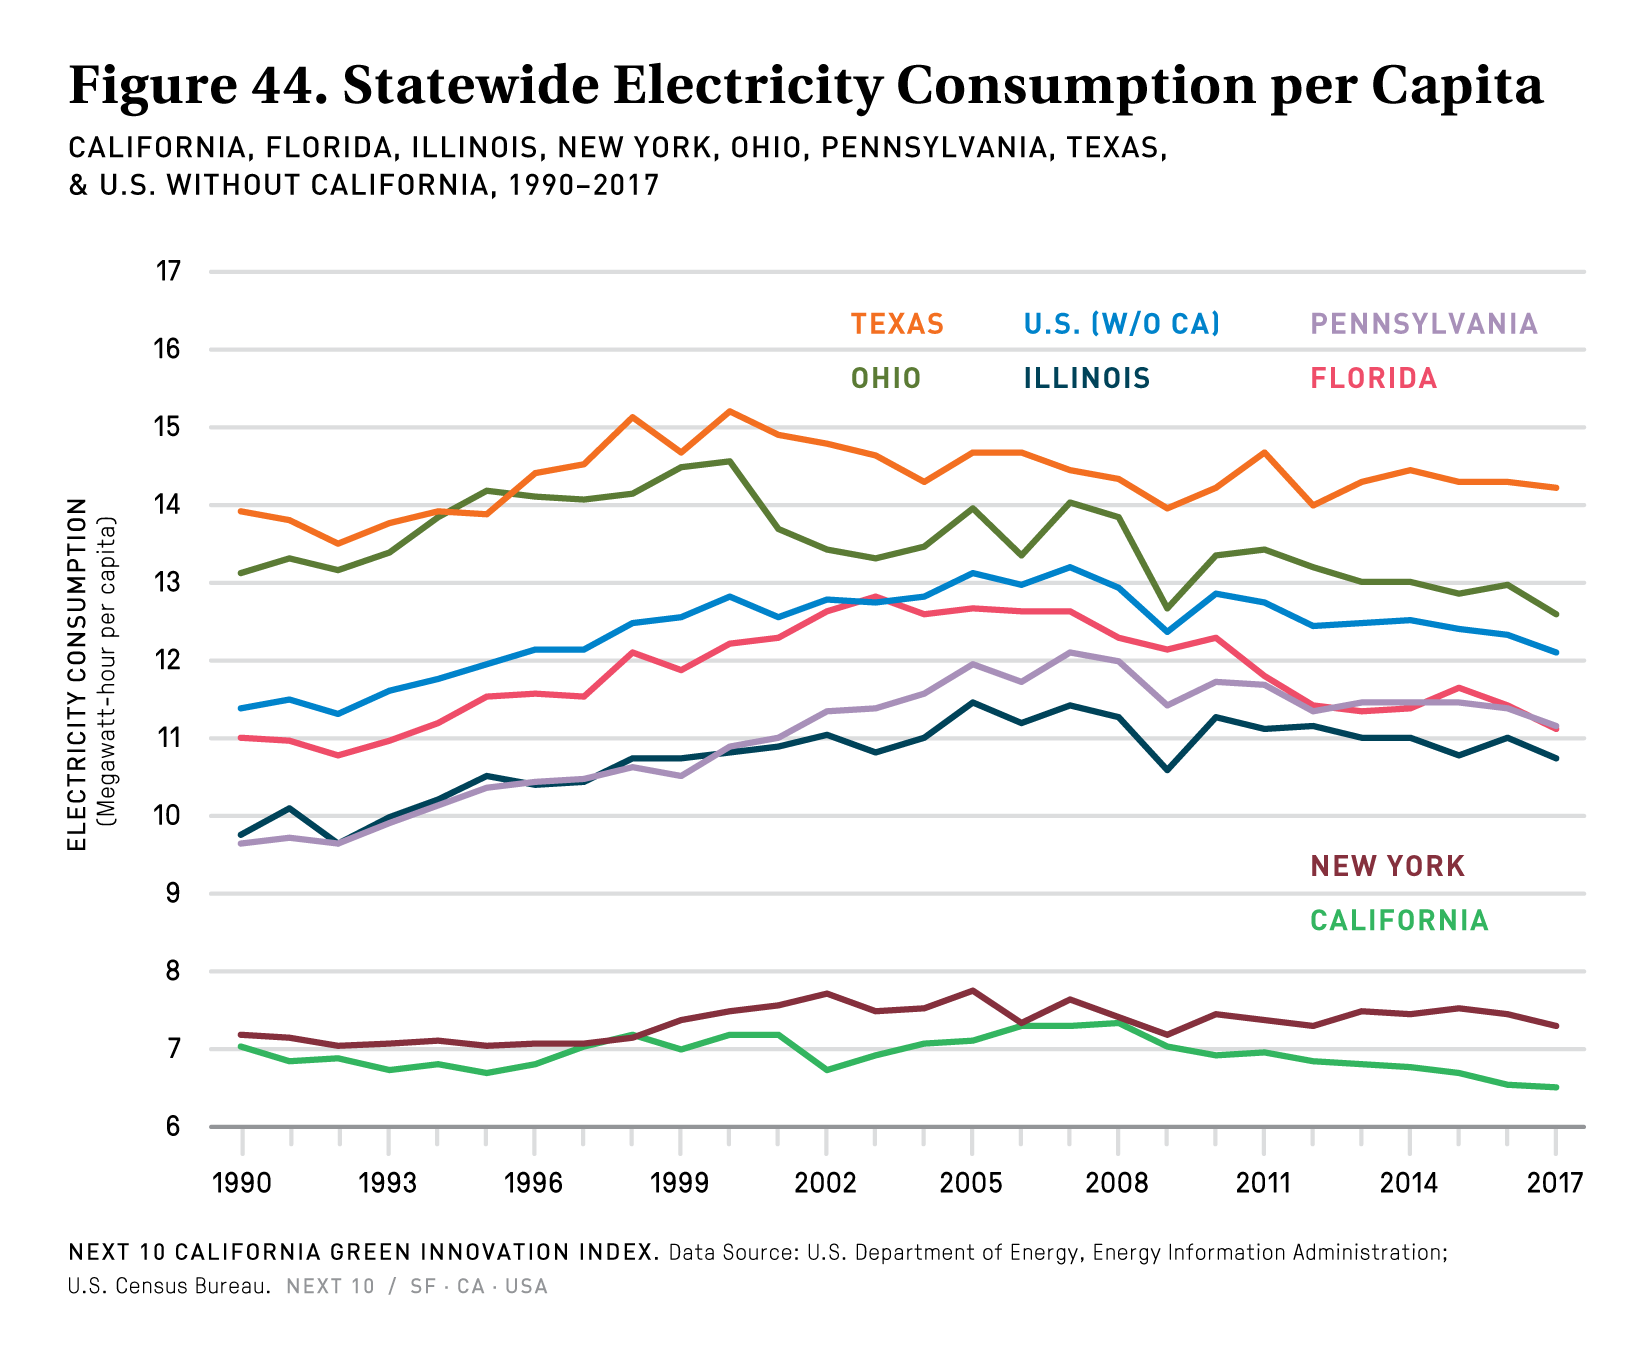
- California has a long history of leading on energy efficiency. Since 1990, the state has reduced its per capita energy consumption by 10.2 percent and kept its per capita electricity consumption essentially flat over the last 40 years, while per capita electricity consumption continued to rise across the rest of the country.
- Despite these gains over the long term, both total energy consumption and per capita energy consumption increased in California from 2015 to 2016, largely the result of increased energy usage in the transportation sector driven by low fuel prices.
- For the second year in a row, both total energy consumption and per capita energy consumption have increased in California. Consecutive increases in energy consumption and per capita energy consumption have not happened since 2002 and 1998, respectively.
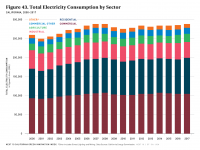
- Electricity consumption reached new highs in the residential and agricultural sectors in 2017. Electricity consumption in the residential sector grew by 4.3 percent—driven in part by an increase in plug-in electronic devices and EVs—and by 2.9 percent in the agricultural sector from 2016 to 2017. Total electricity consumption in 2017 reached highs not seen since 2008 at the start of the Great Recession.
- California has among the lowest per capita electricity consumption among the selected large states, along with New York. Unlike New York, however, in which per capita consumption has held steady, it continues to decrease in California.
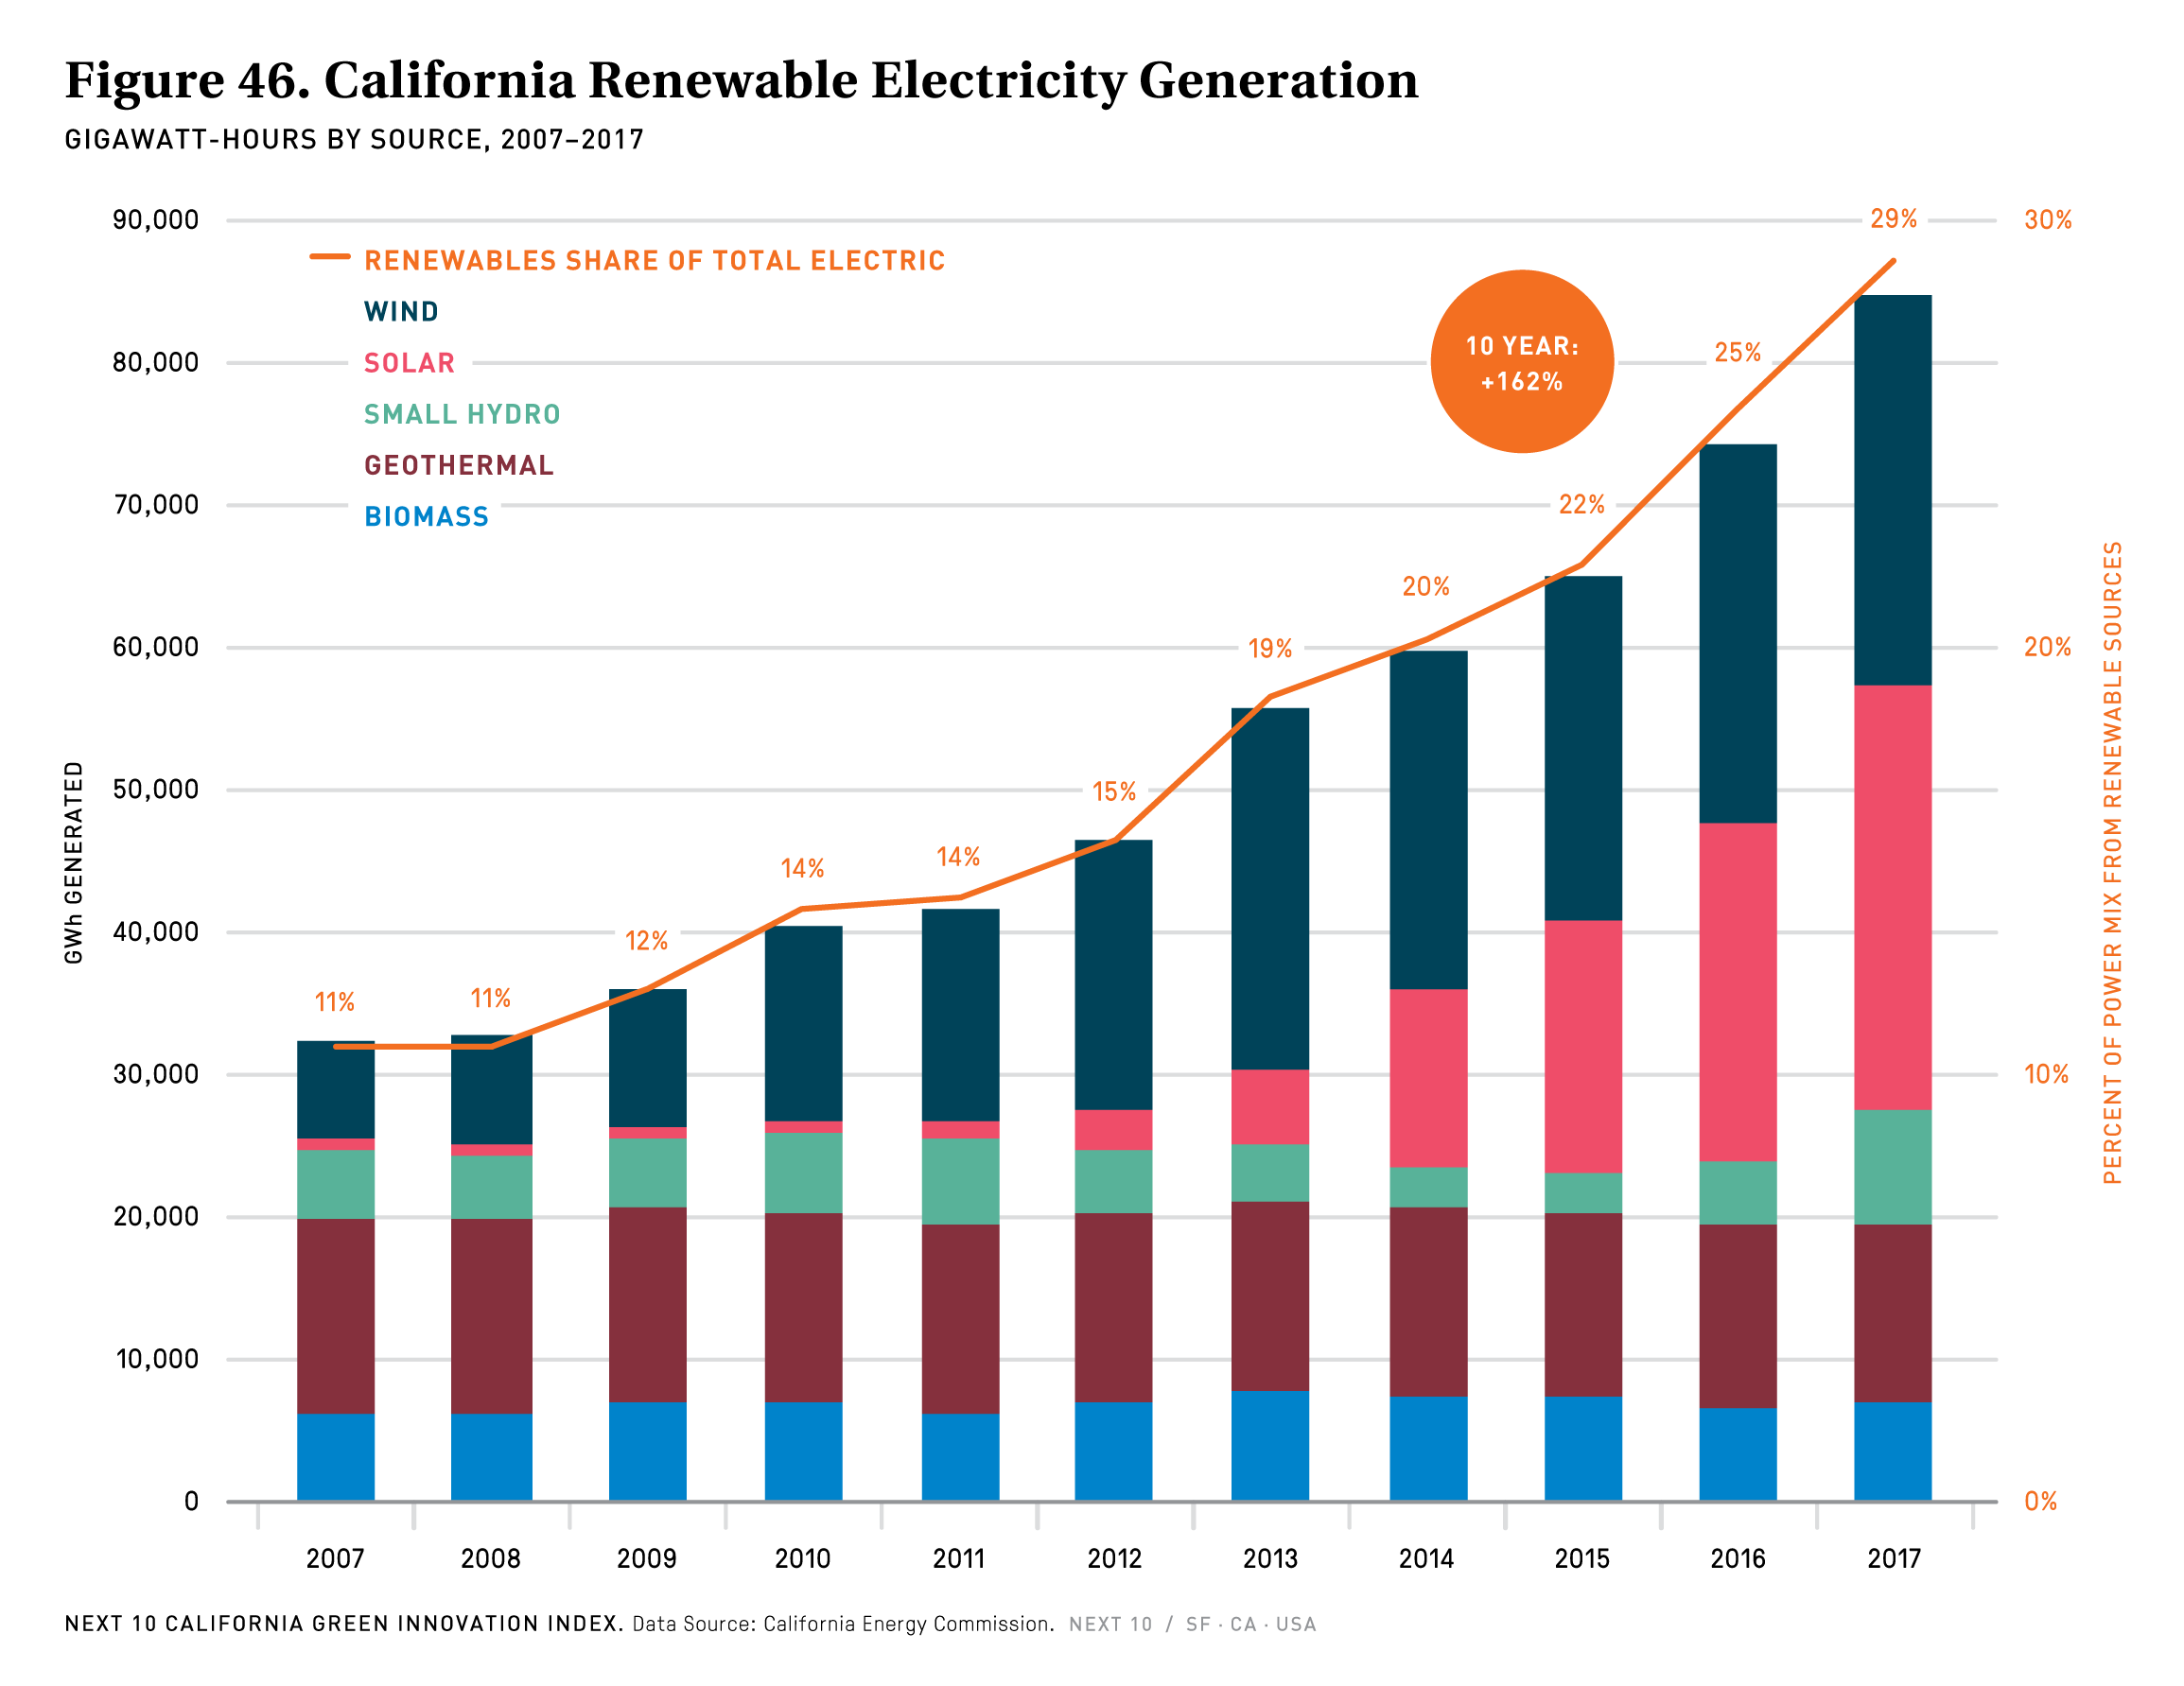
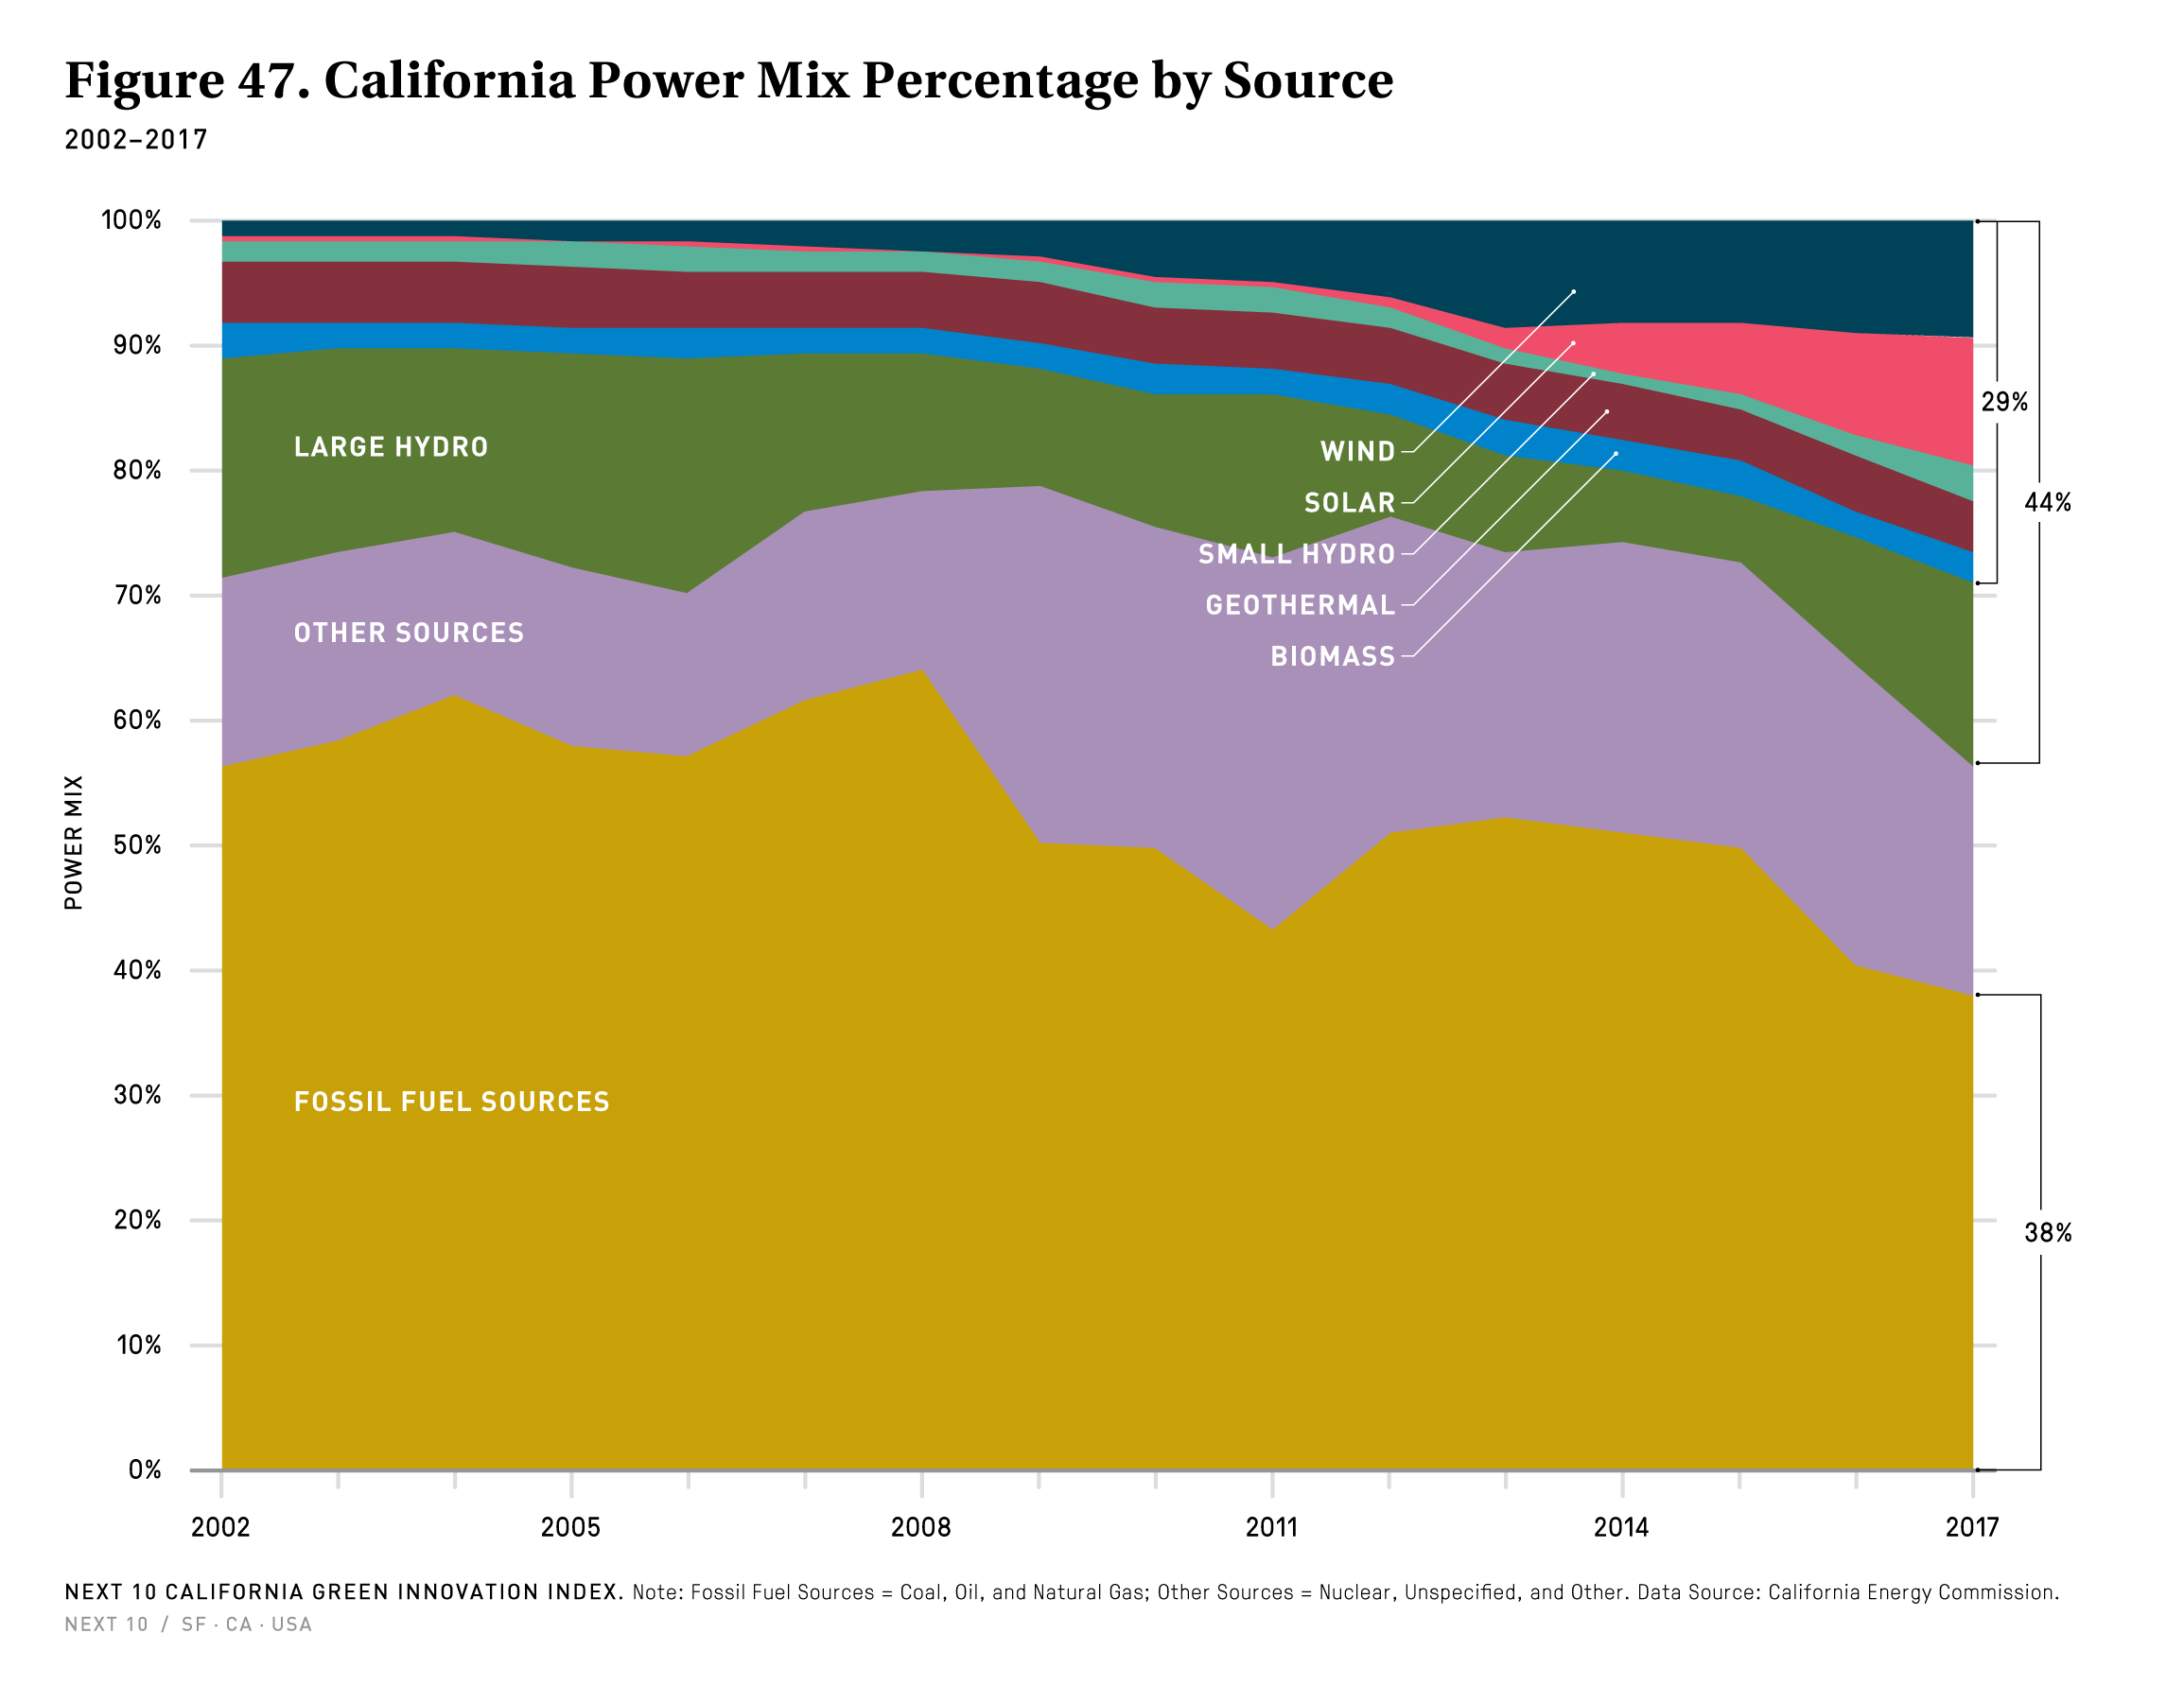
Renewable Energy
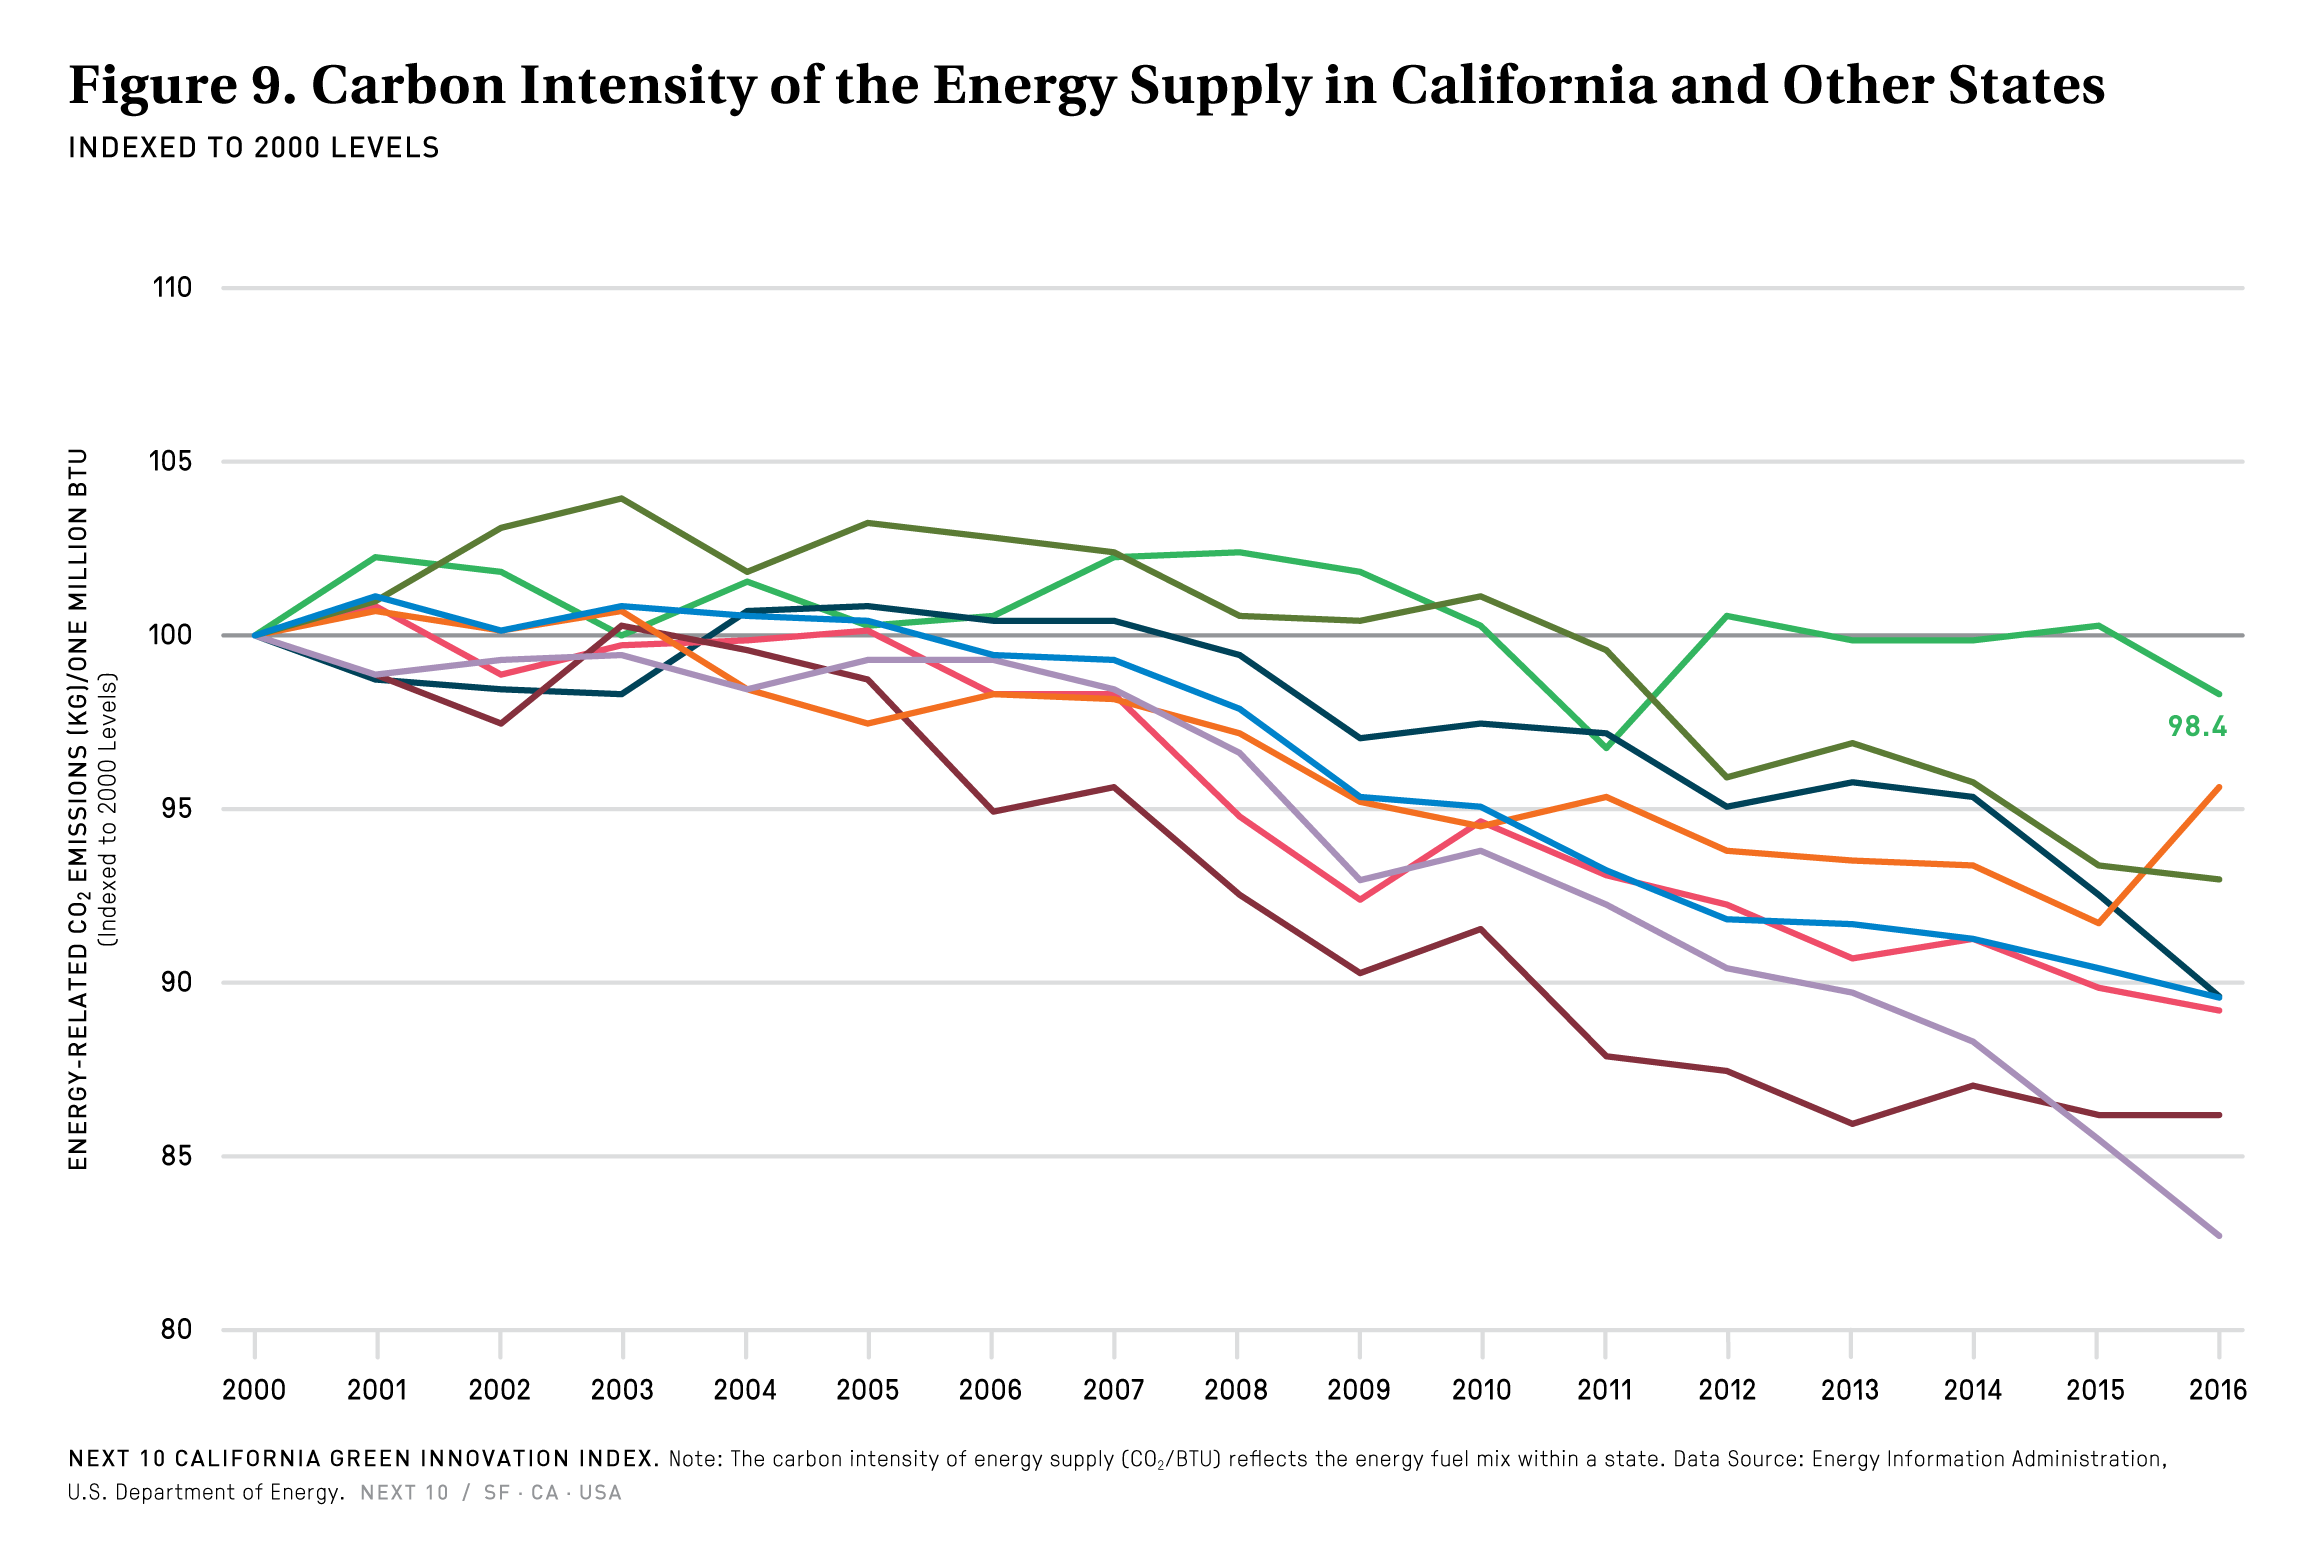
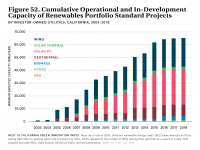
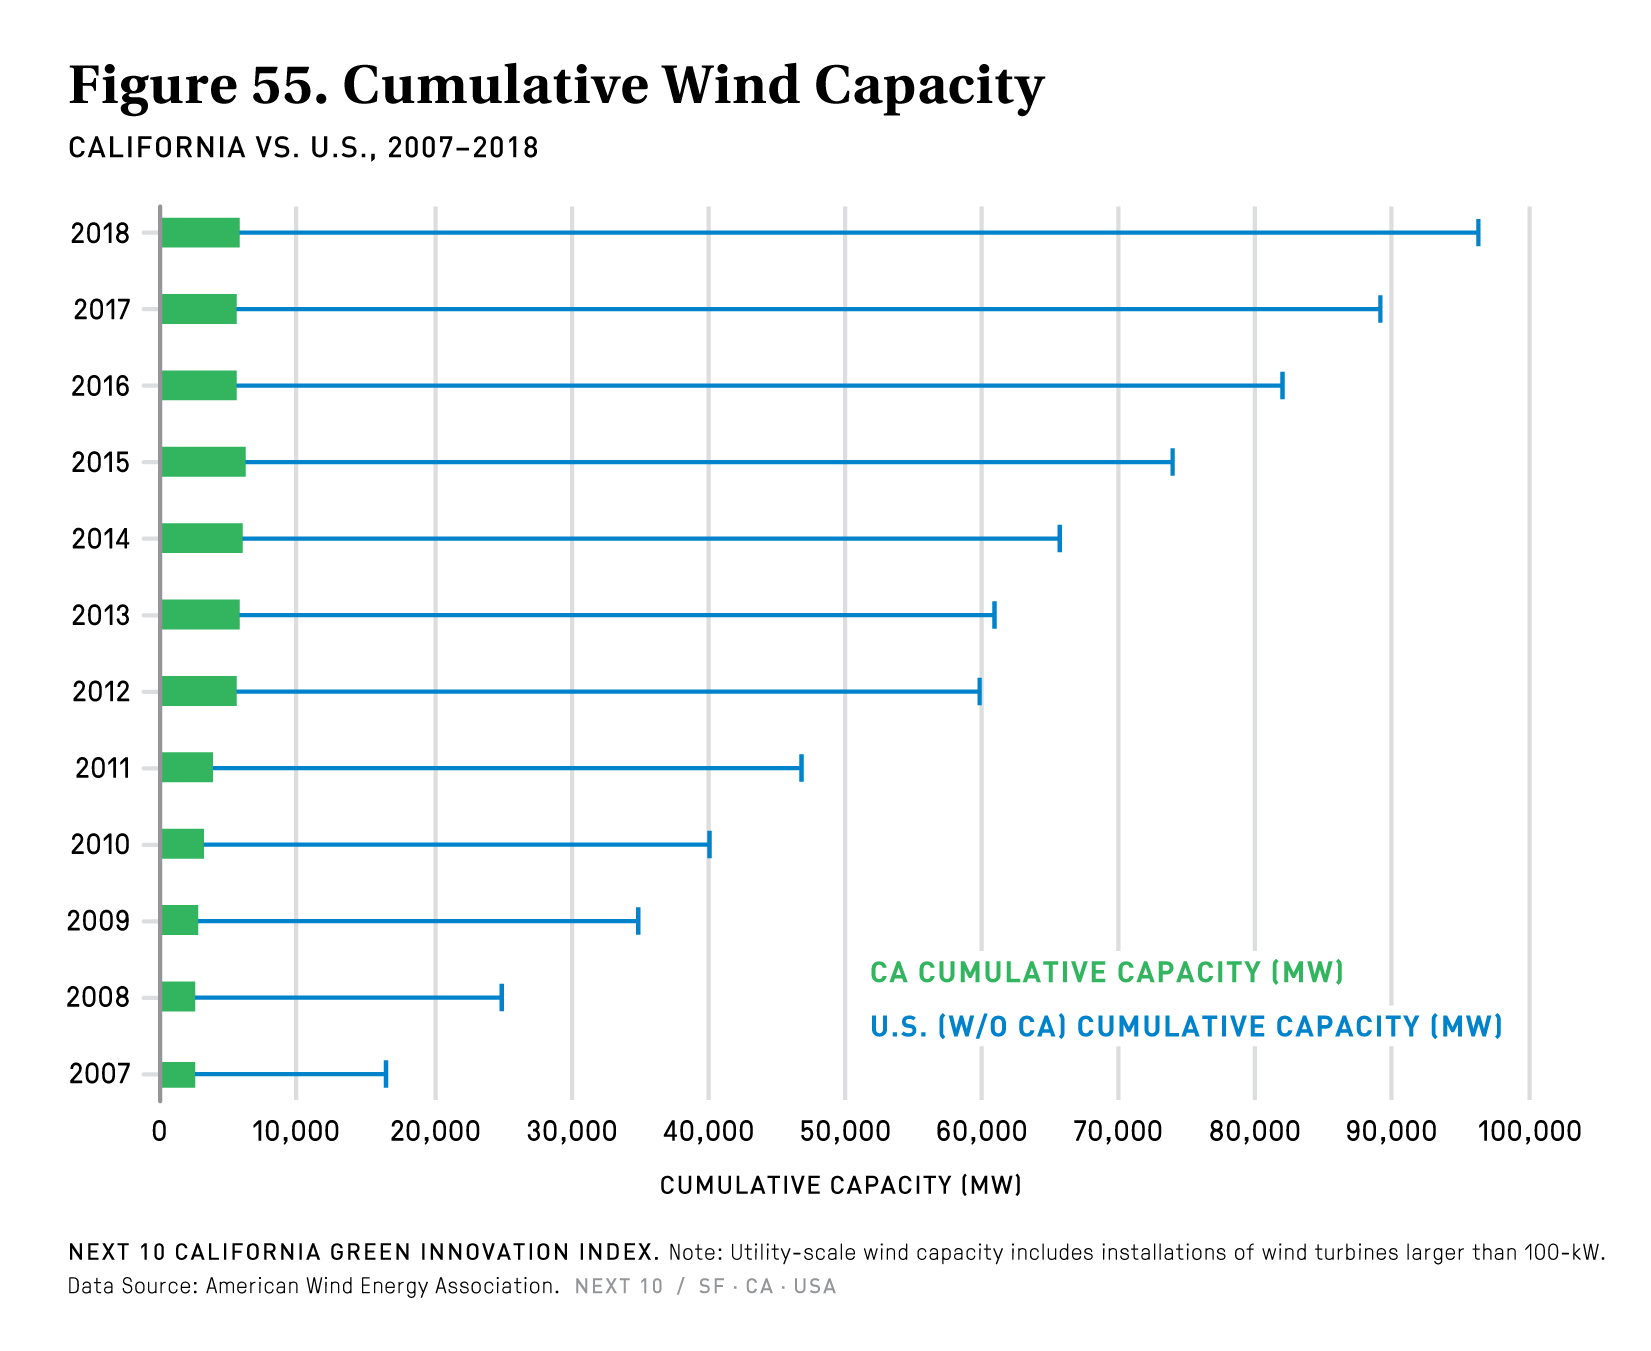
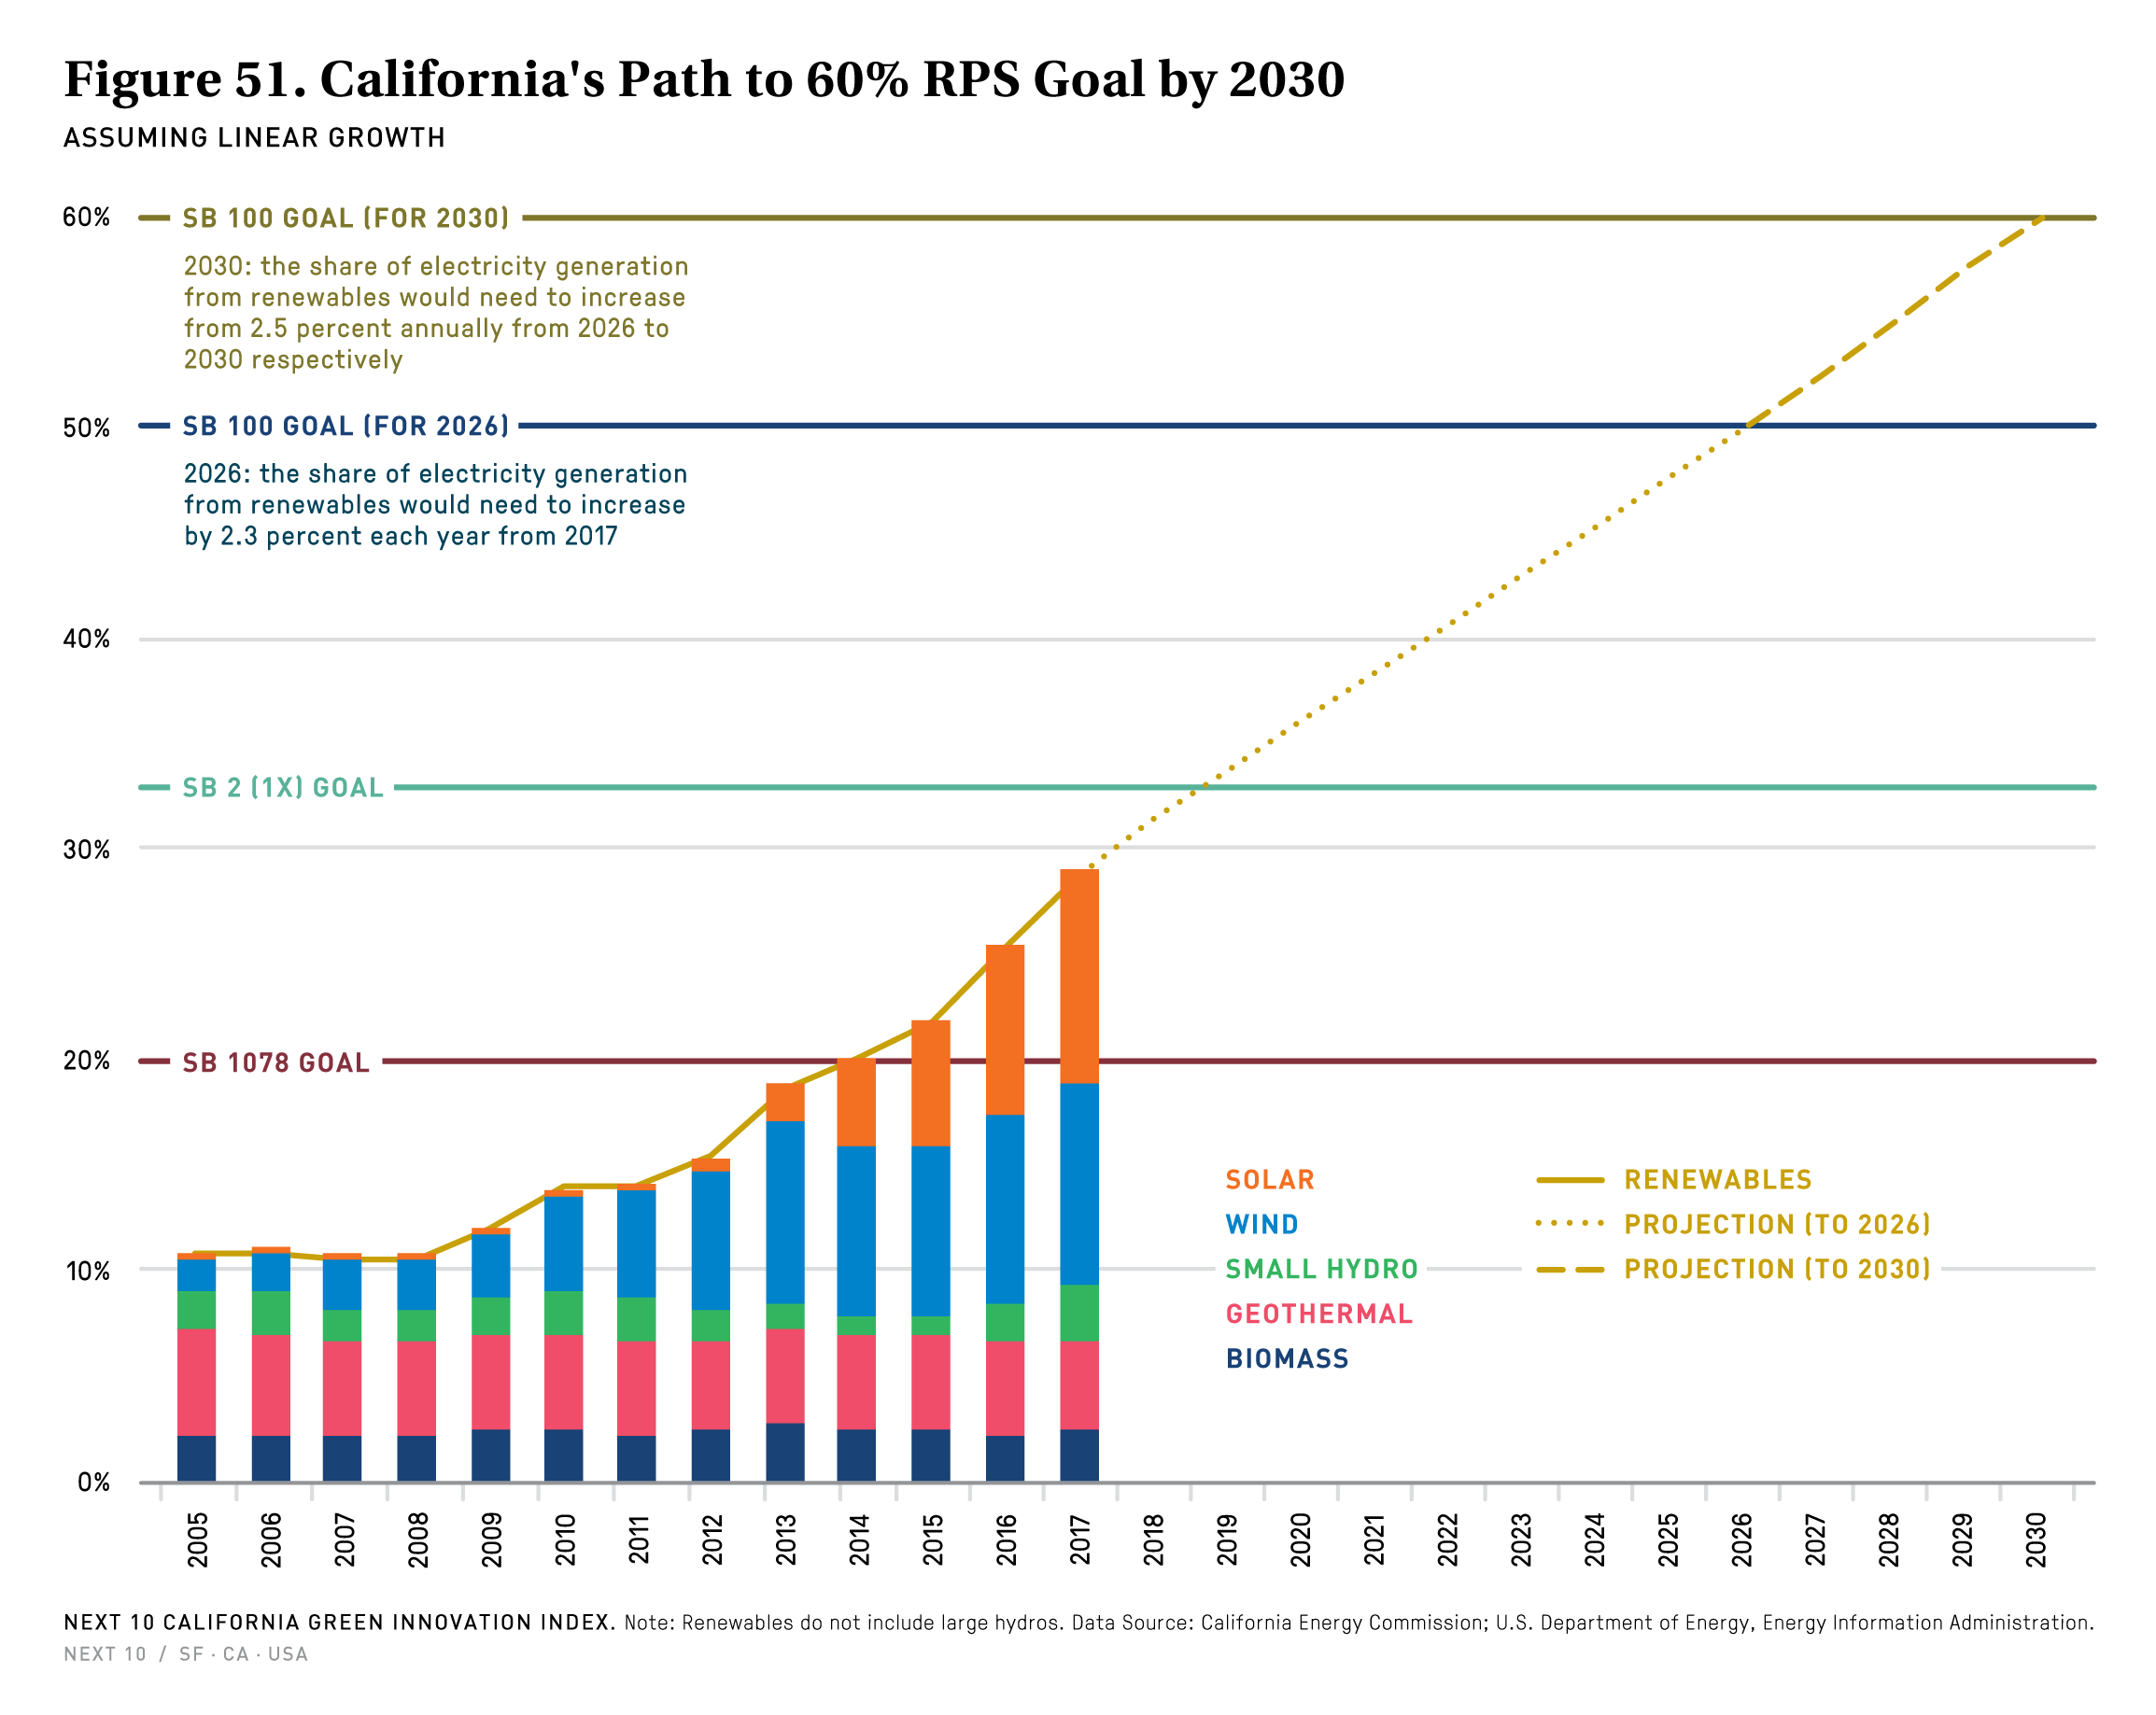
- Hydroelectric, solar, and wind generation are increasingly displacing natural gas. 2017 was the first time that the share of fossil fuel sources—coal, oil, and natural gas—fell below 40 percent of California’s power mix.
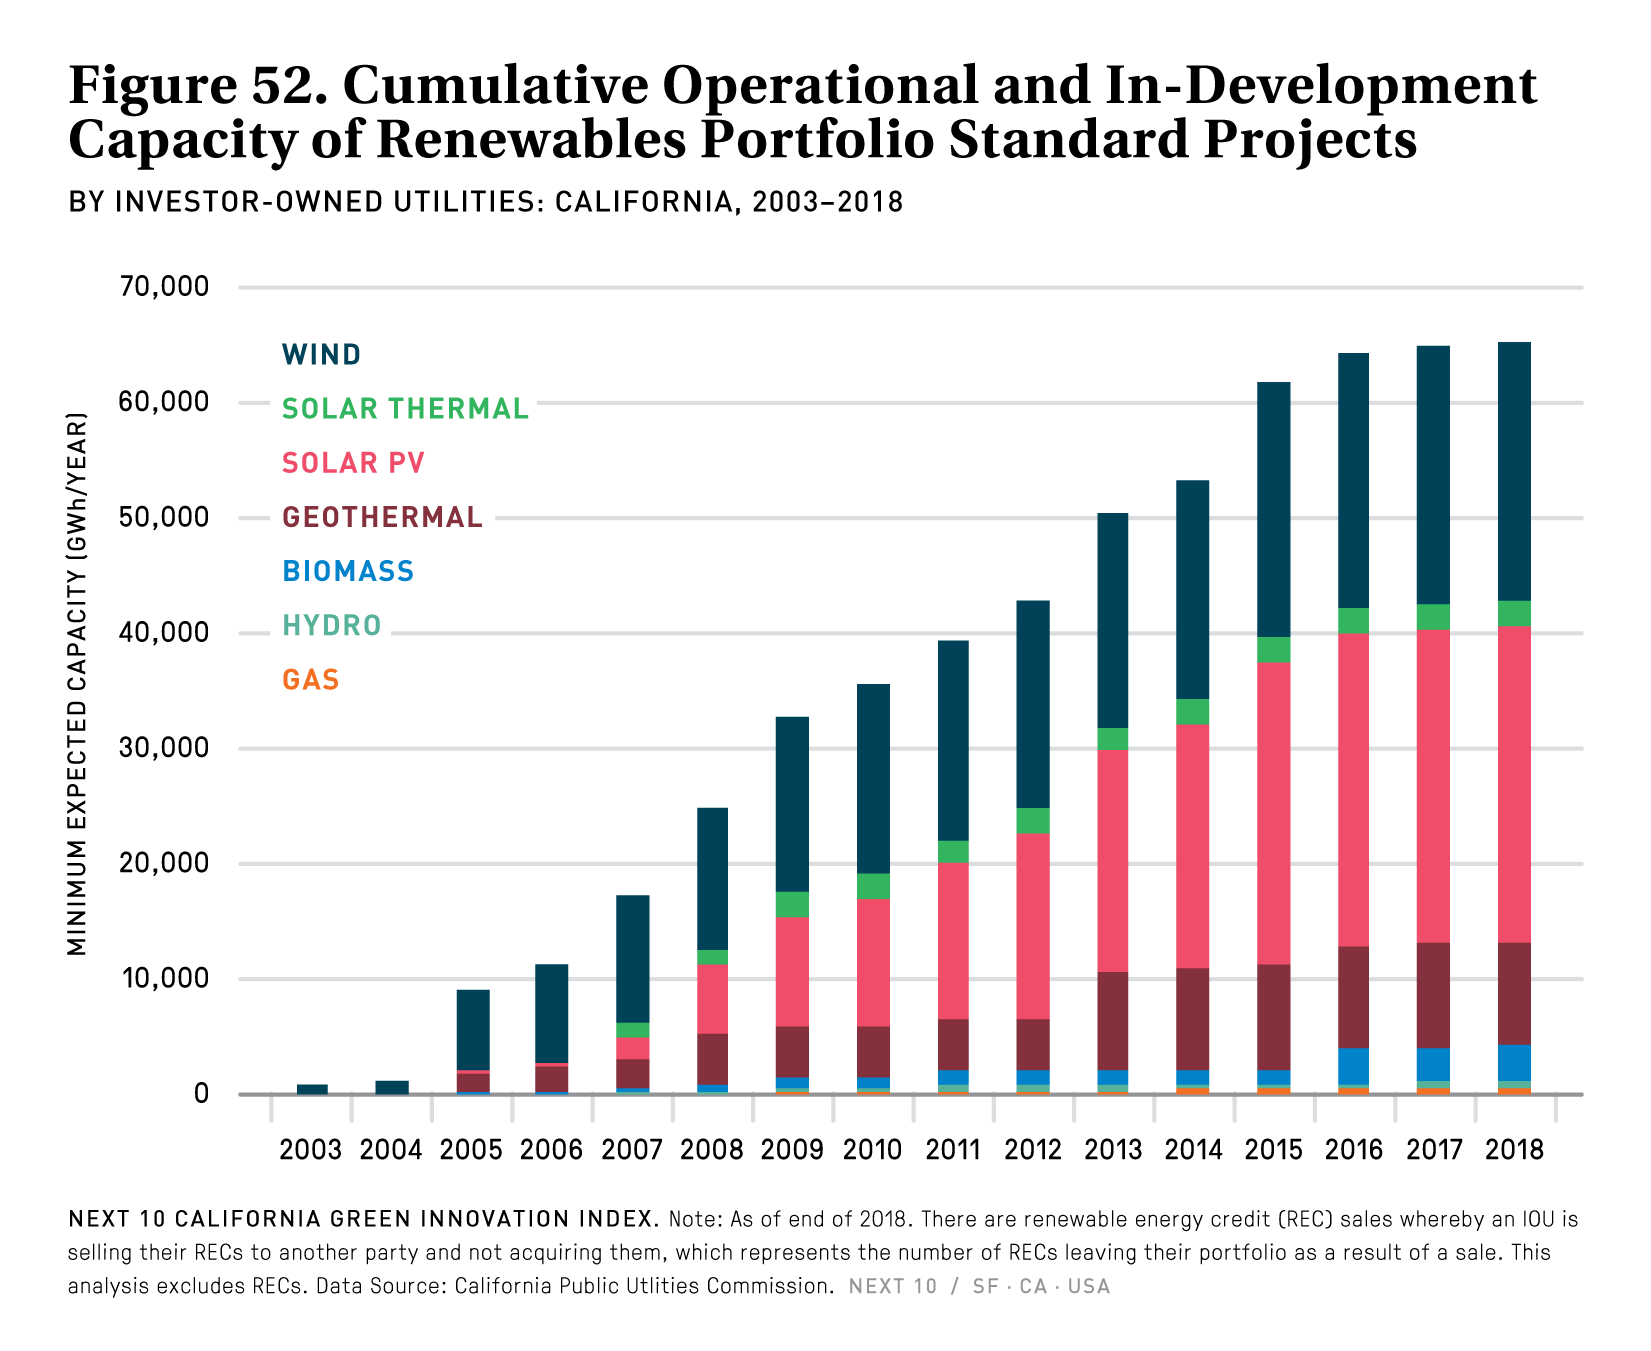
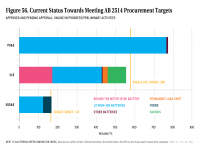
- California’s landmark 2010 energy storage procurement mandate (AB 2514) has helped to expand storage capacity in the state, with investor-owned utilities meeting the 2020 procurement target of 1,325 MW a few years early, but more will need come online in order to hit the 2024 target of 1,325 MW energy storage capacity installed.
- As the energy storage market grows and matures, the technology is becoming increasingly cost-competitive with natural gas. In Moss Landing, two lithium-ion batteries were approved this past fall to replace retiring gas generators. When they come online, the batteries will be the two largest in service in the world.
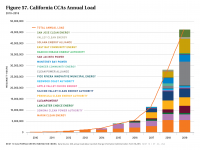
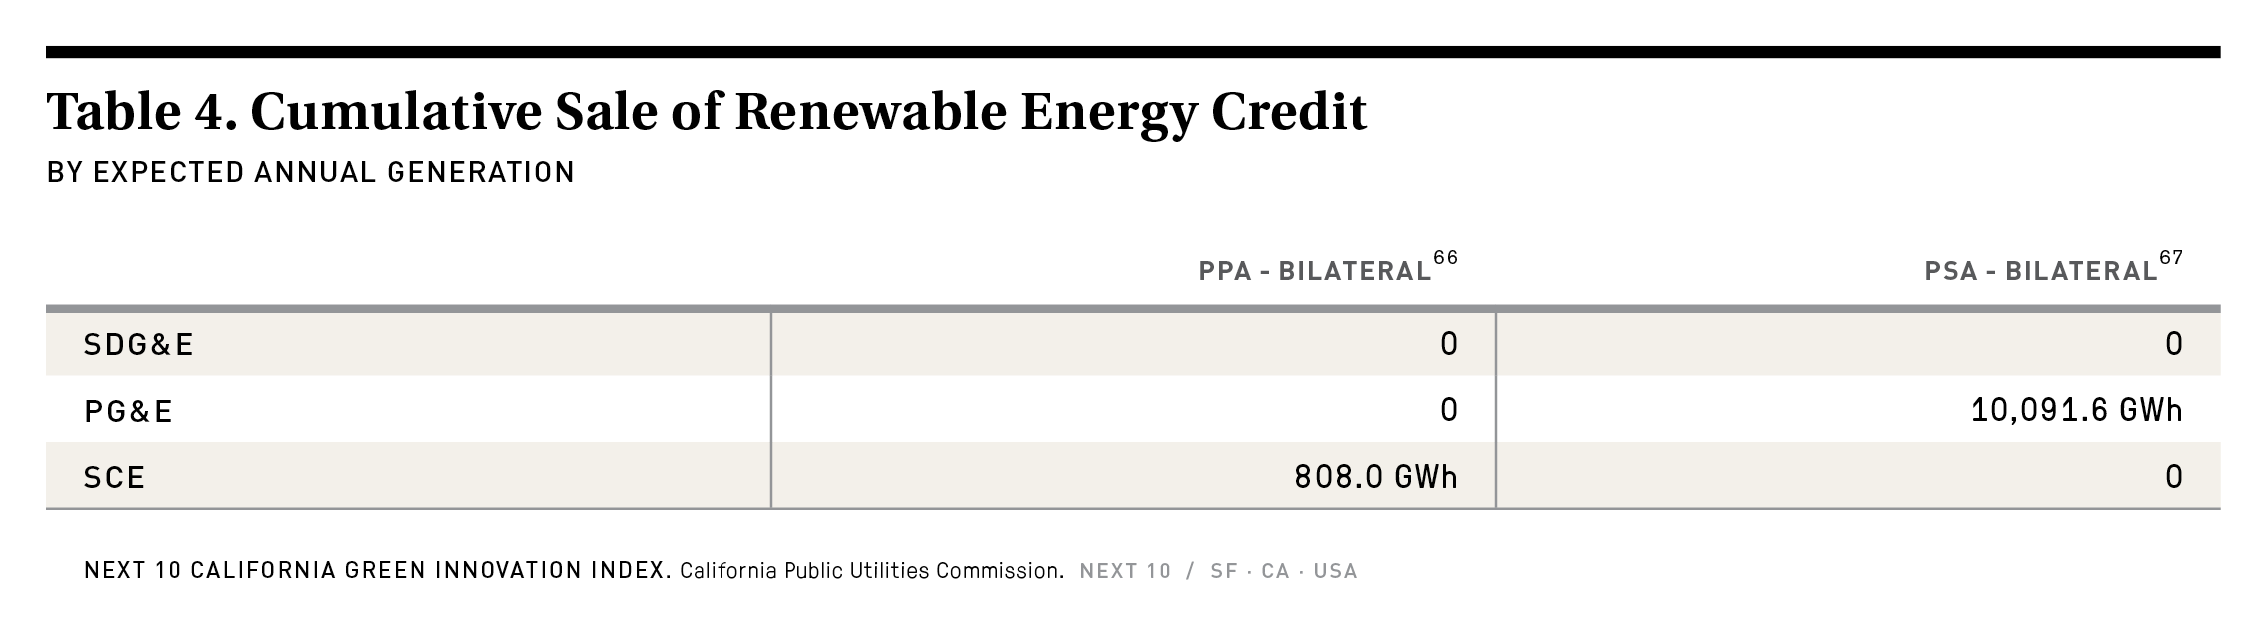
- While Community Choice Aggregators (CCAs) are quickly growing, the California Public Utilities Commission notes that CCAs would have to procure roughly twice the amount of clean energy they have procured to-date by 2022 and close to six times as much by 2030 in order to meet our clean energy and climate goals.
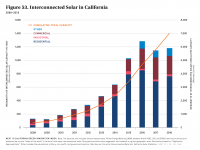
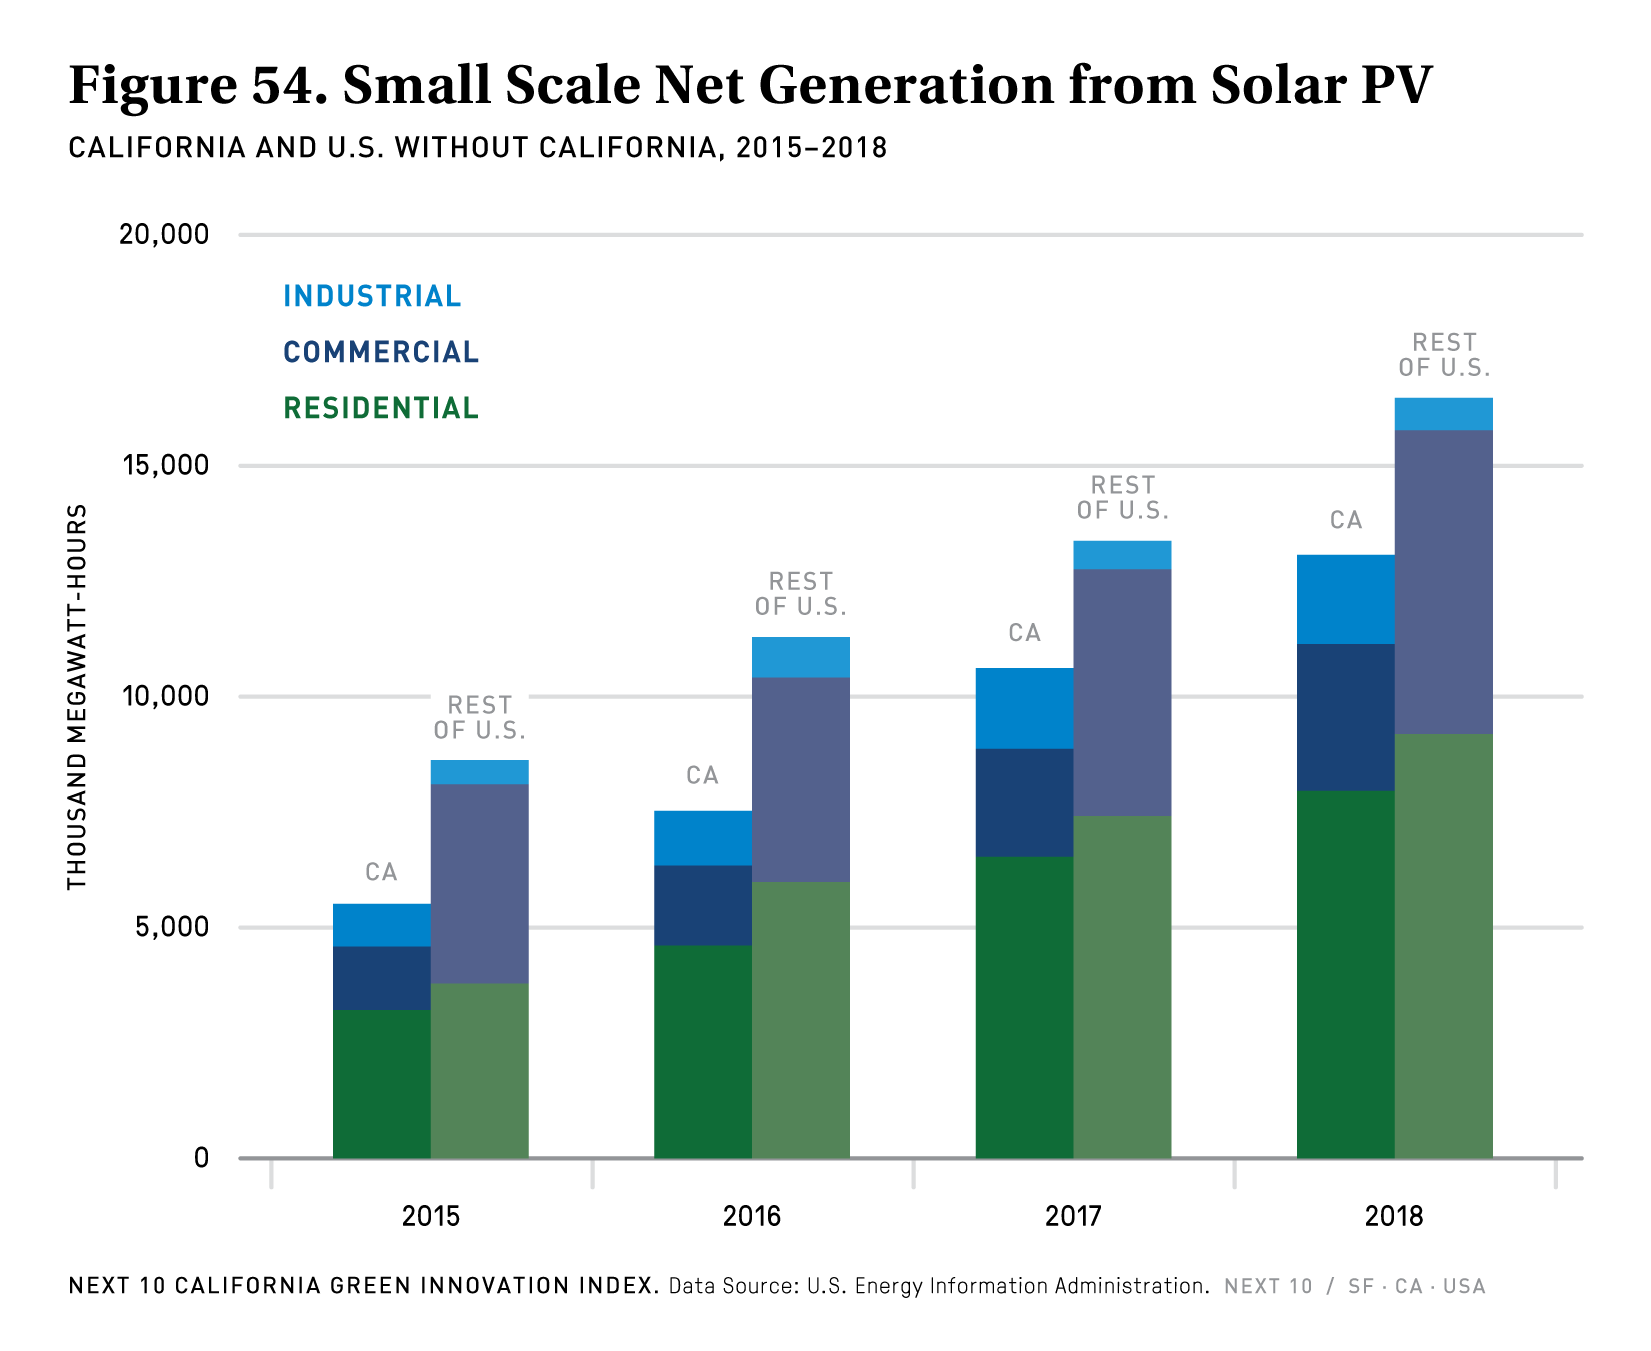
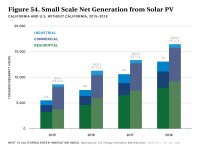
- As of the end of 2018, California accounted for 44 percent of all small-scale solar photovoltaic (PV) net generation in the U.S. Small scale-solar PV generation increased 23 percent from 2017 to 2018 in both California and the rest of U.S.
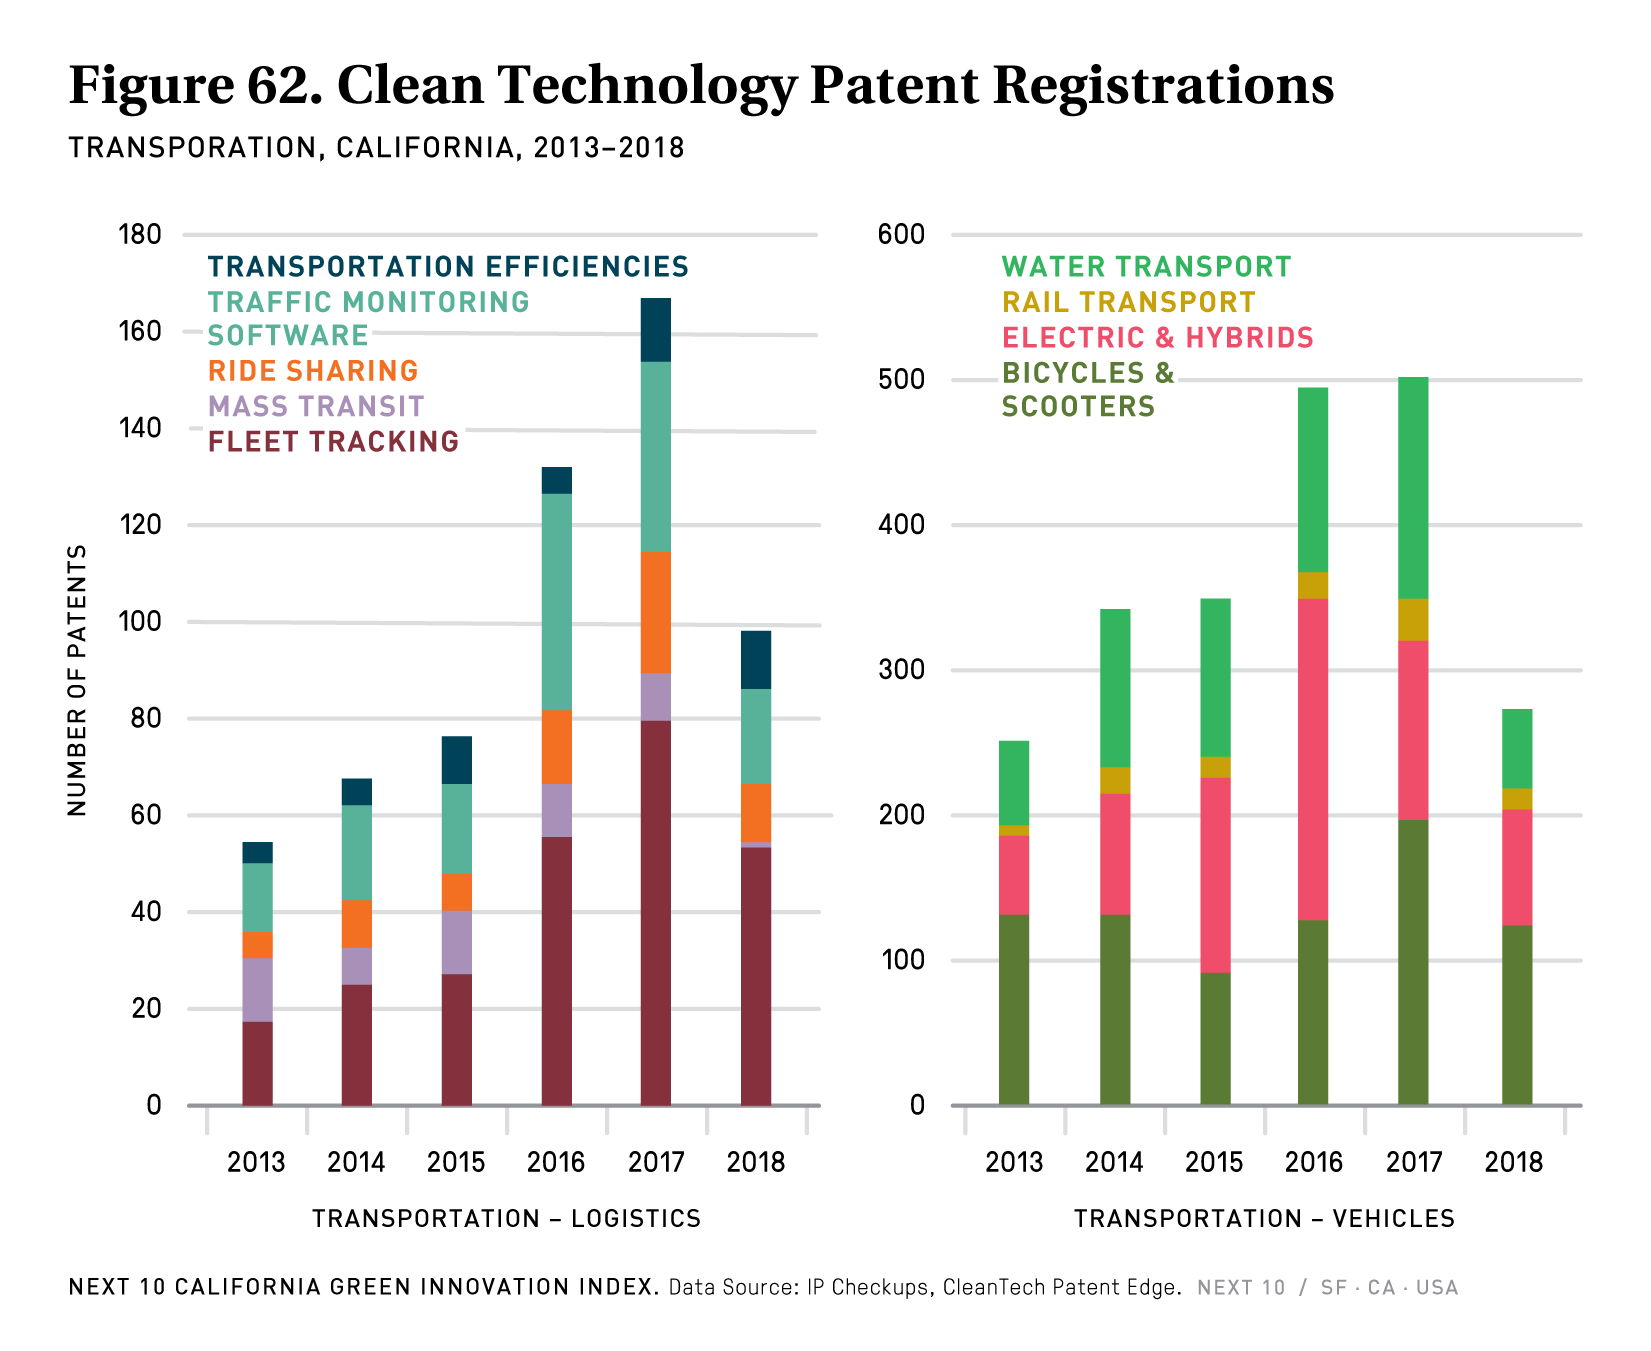
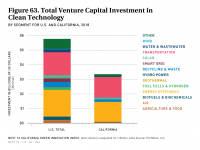
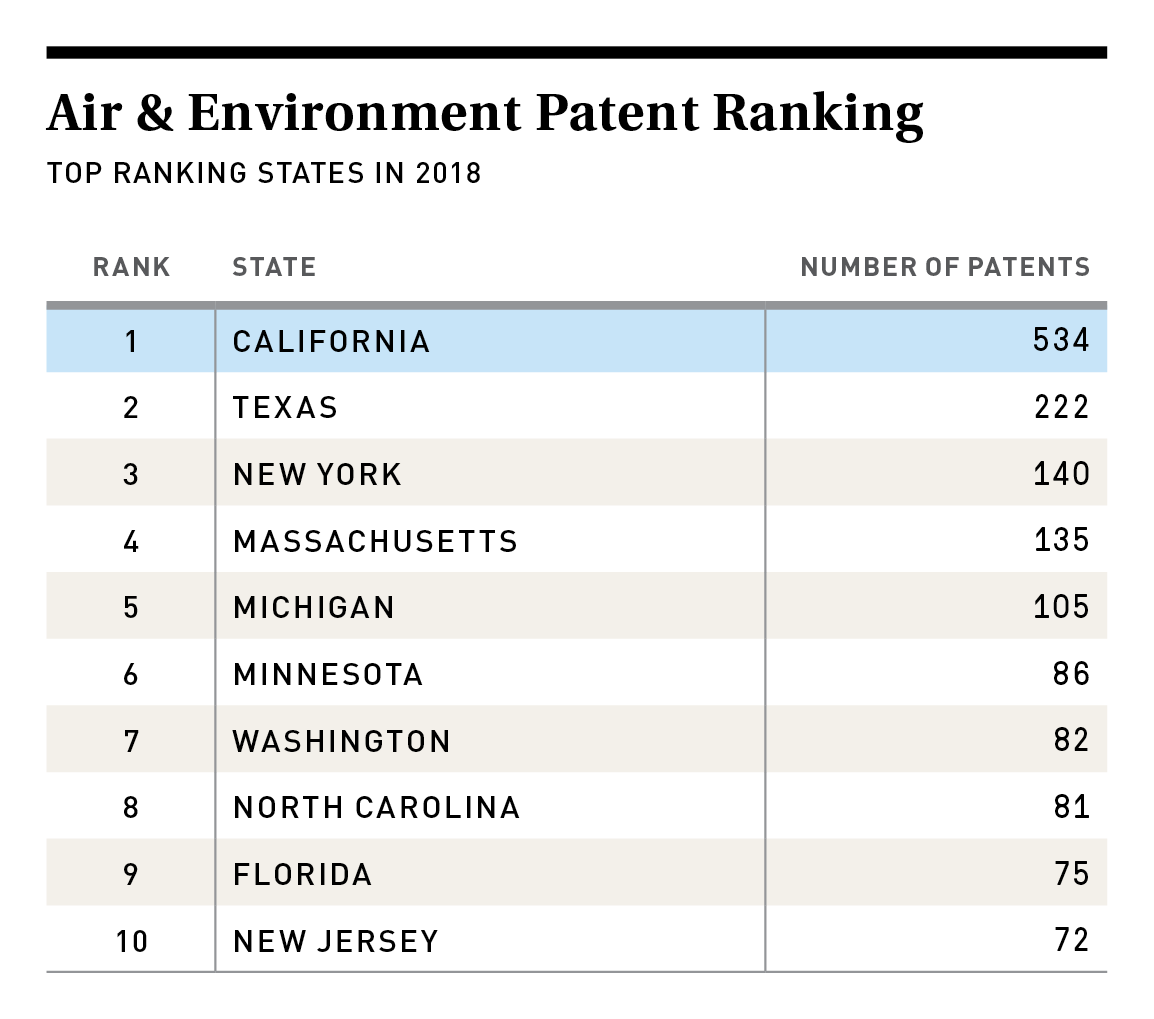
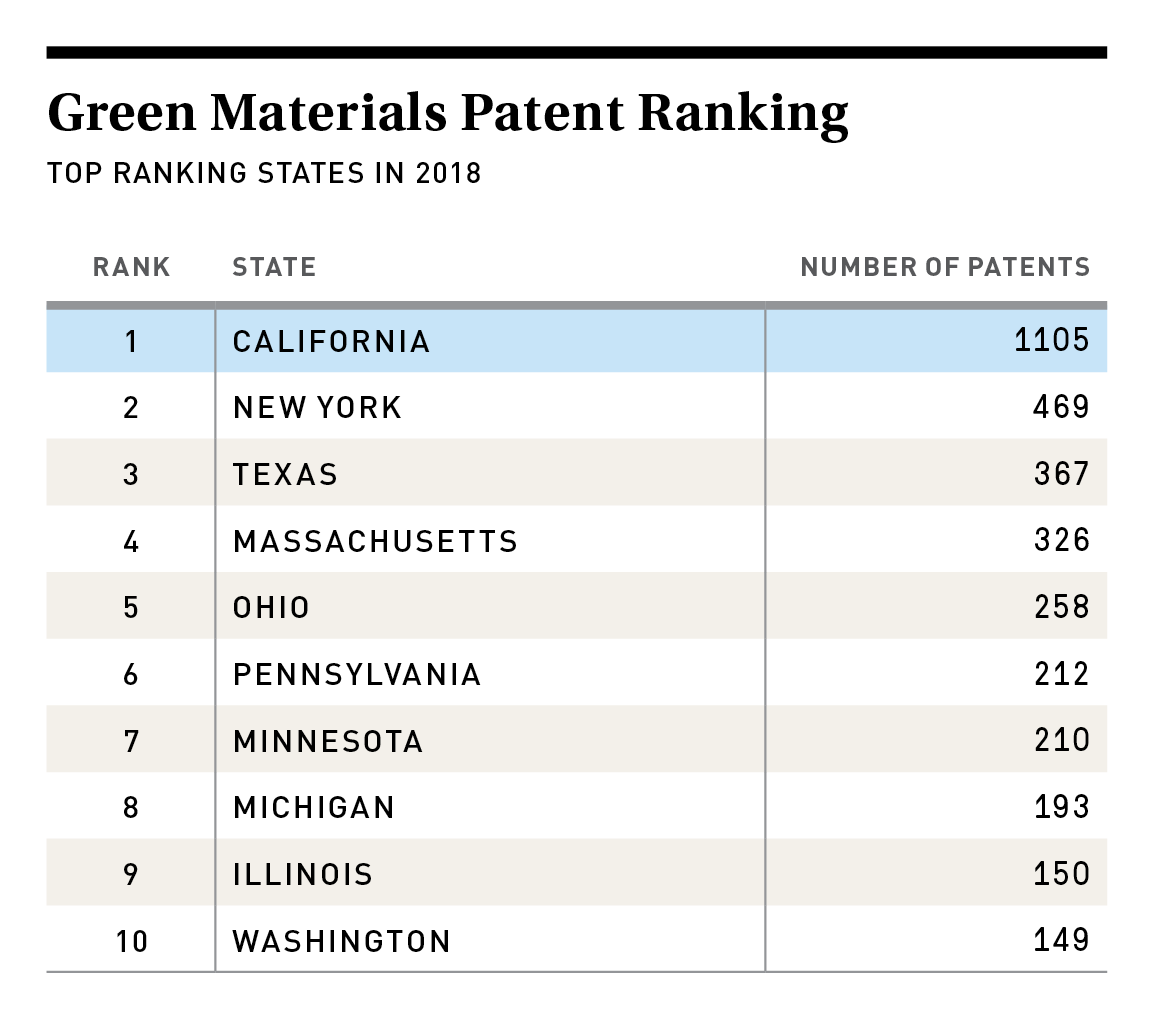
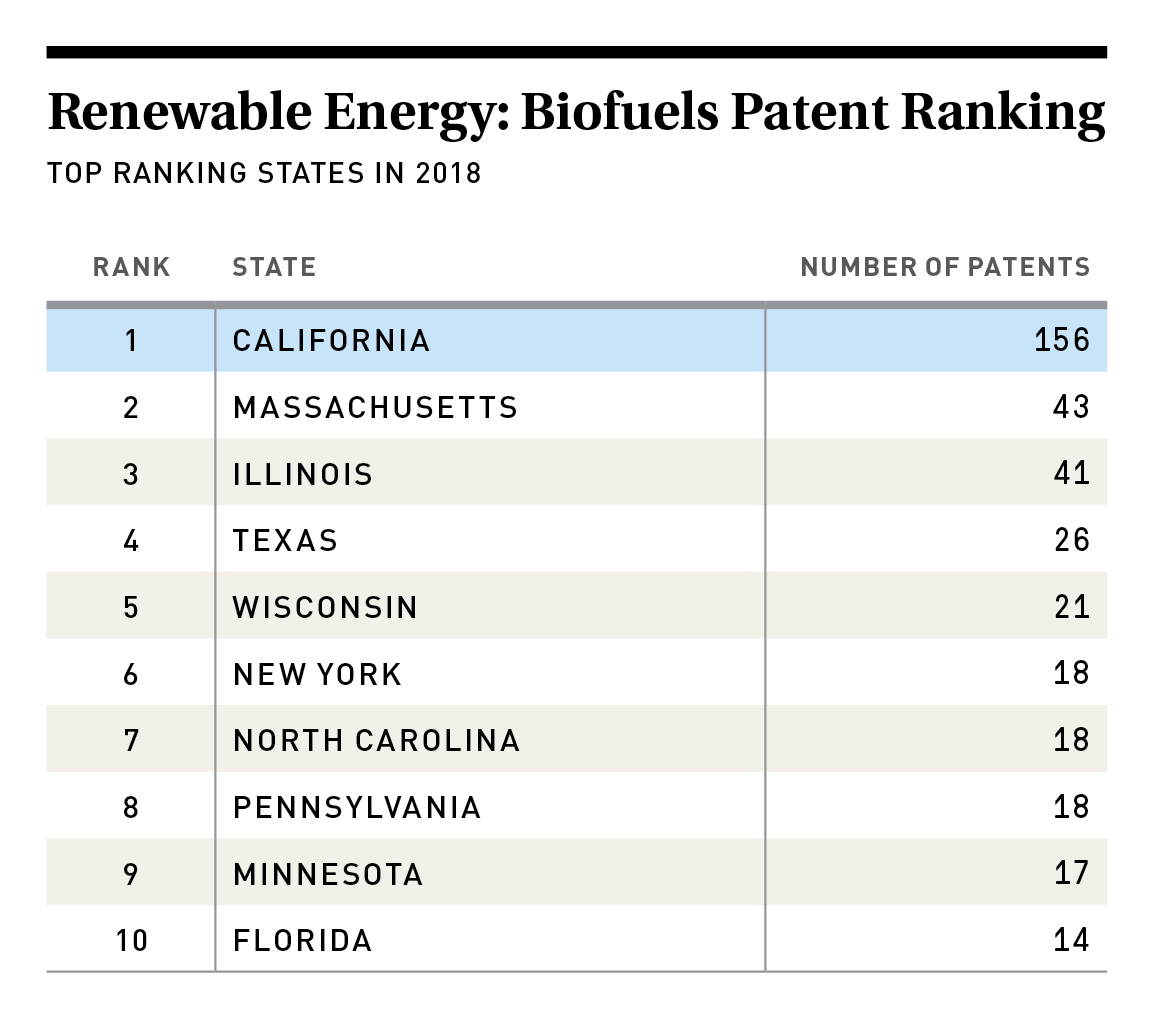
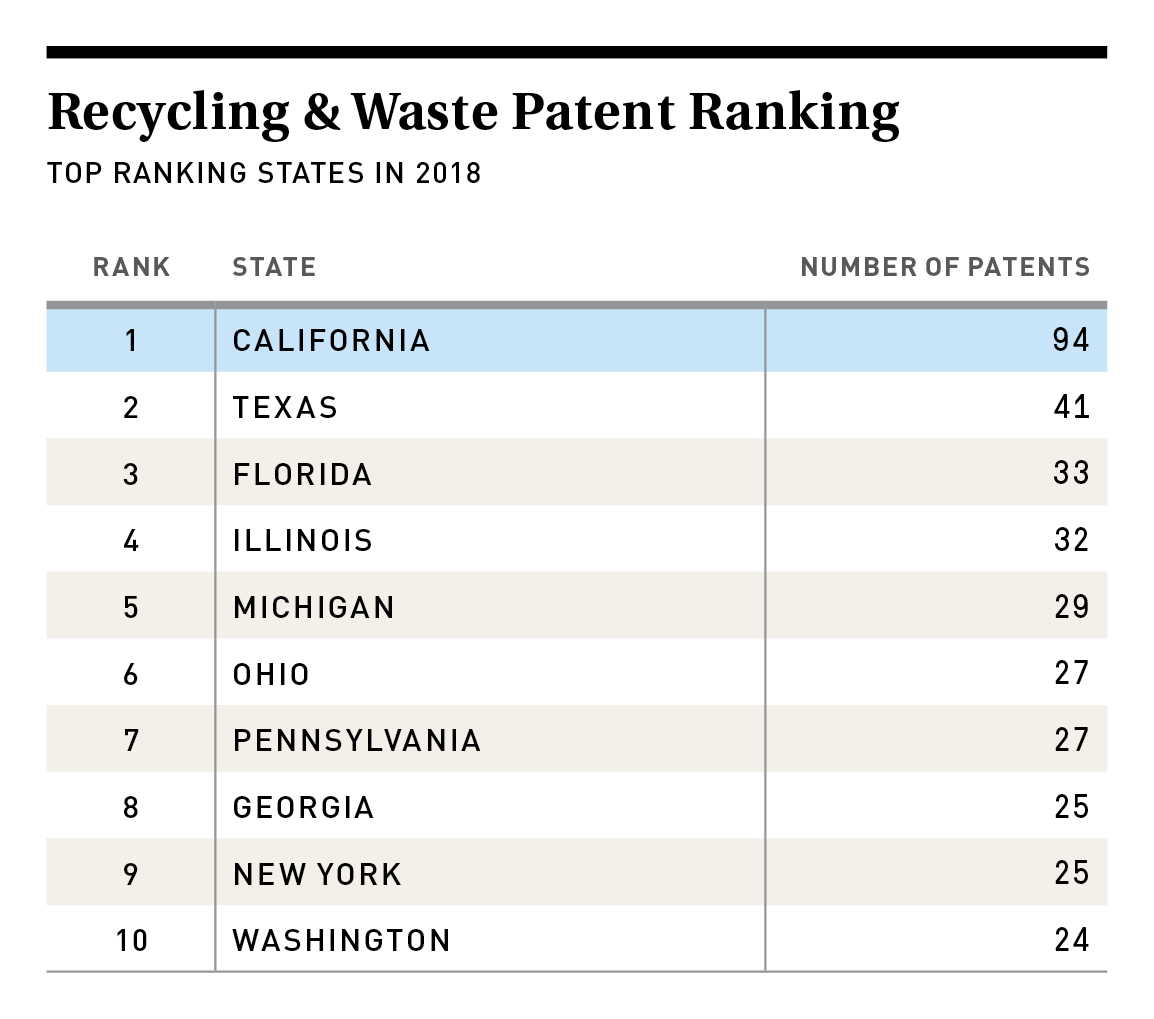
Clean Technology Innovation
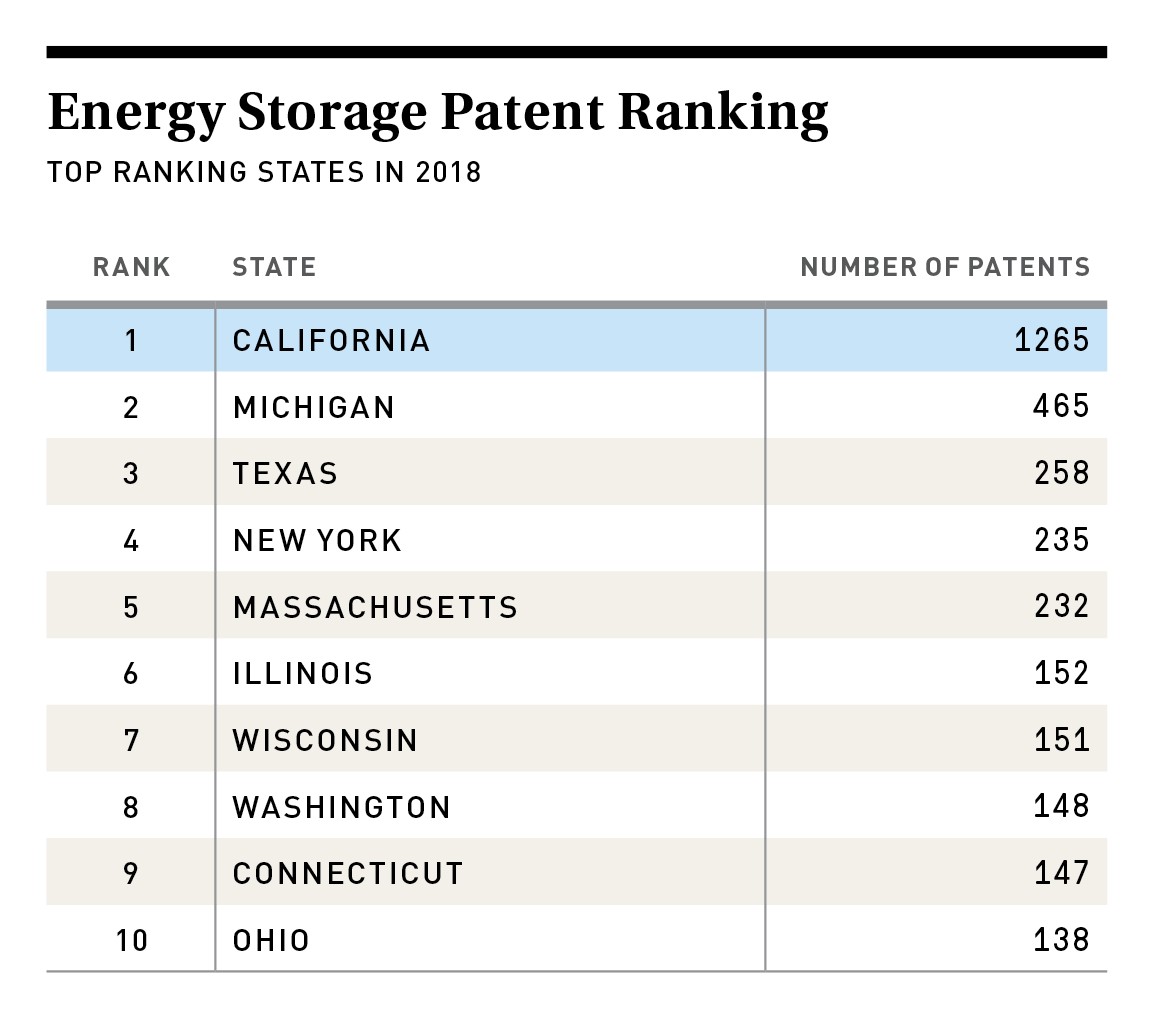
- Energy storage patents in California increased 65.6 percent from 2017 to 2018.
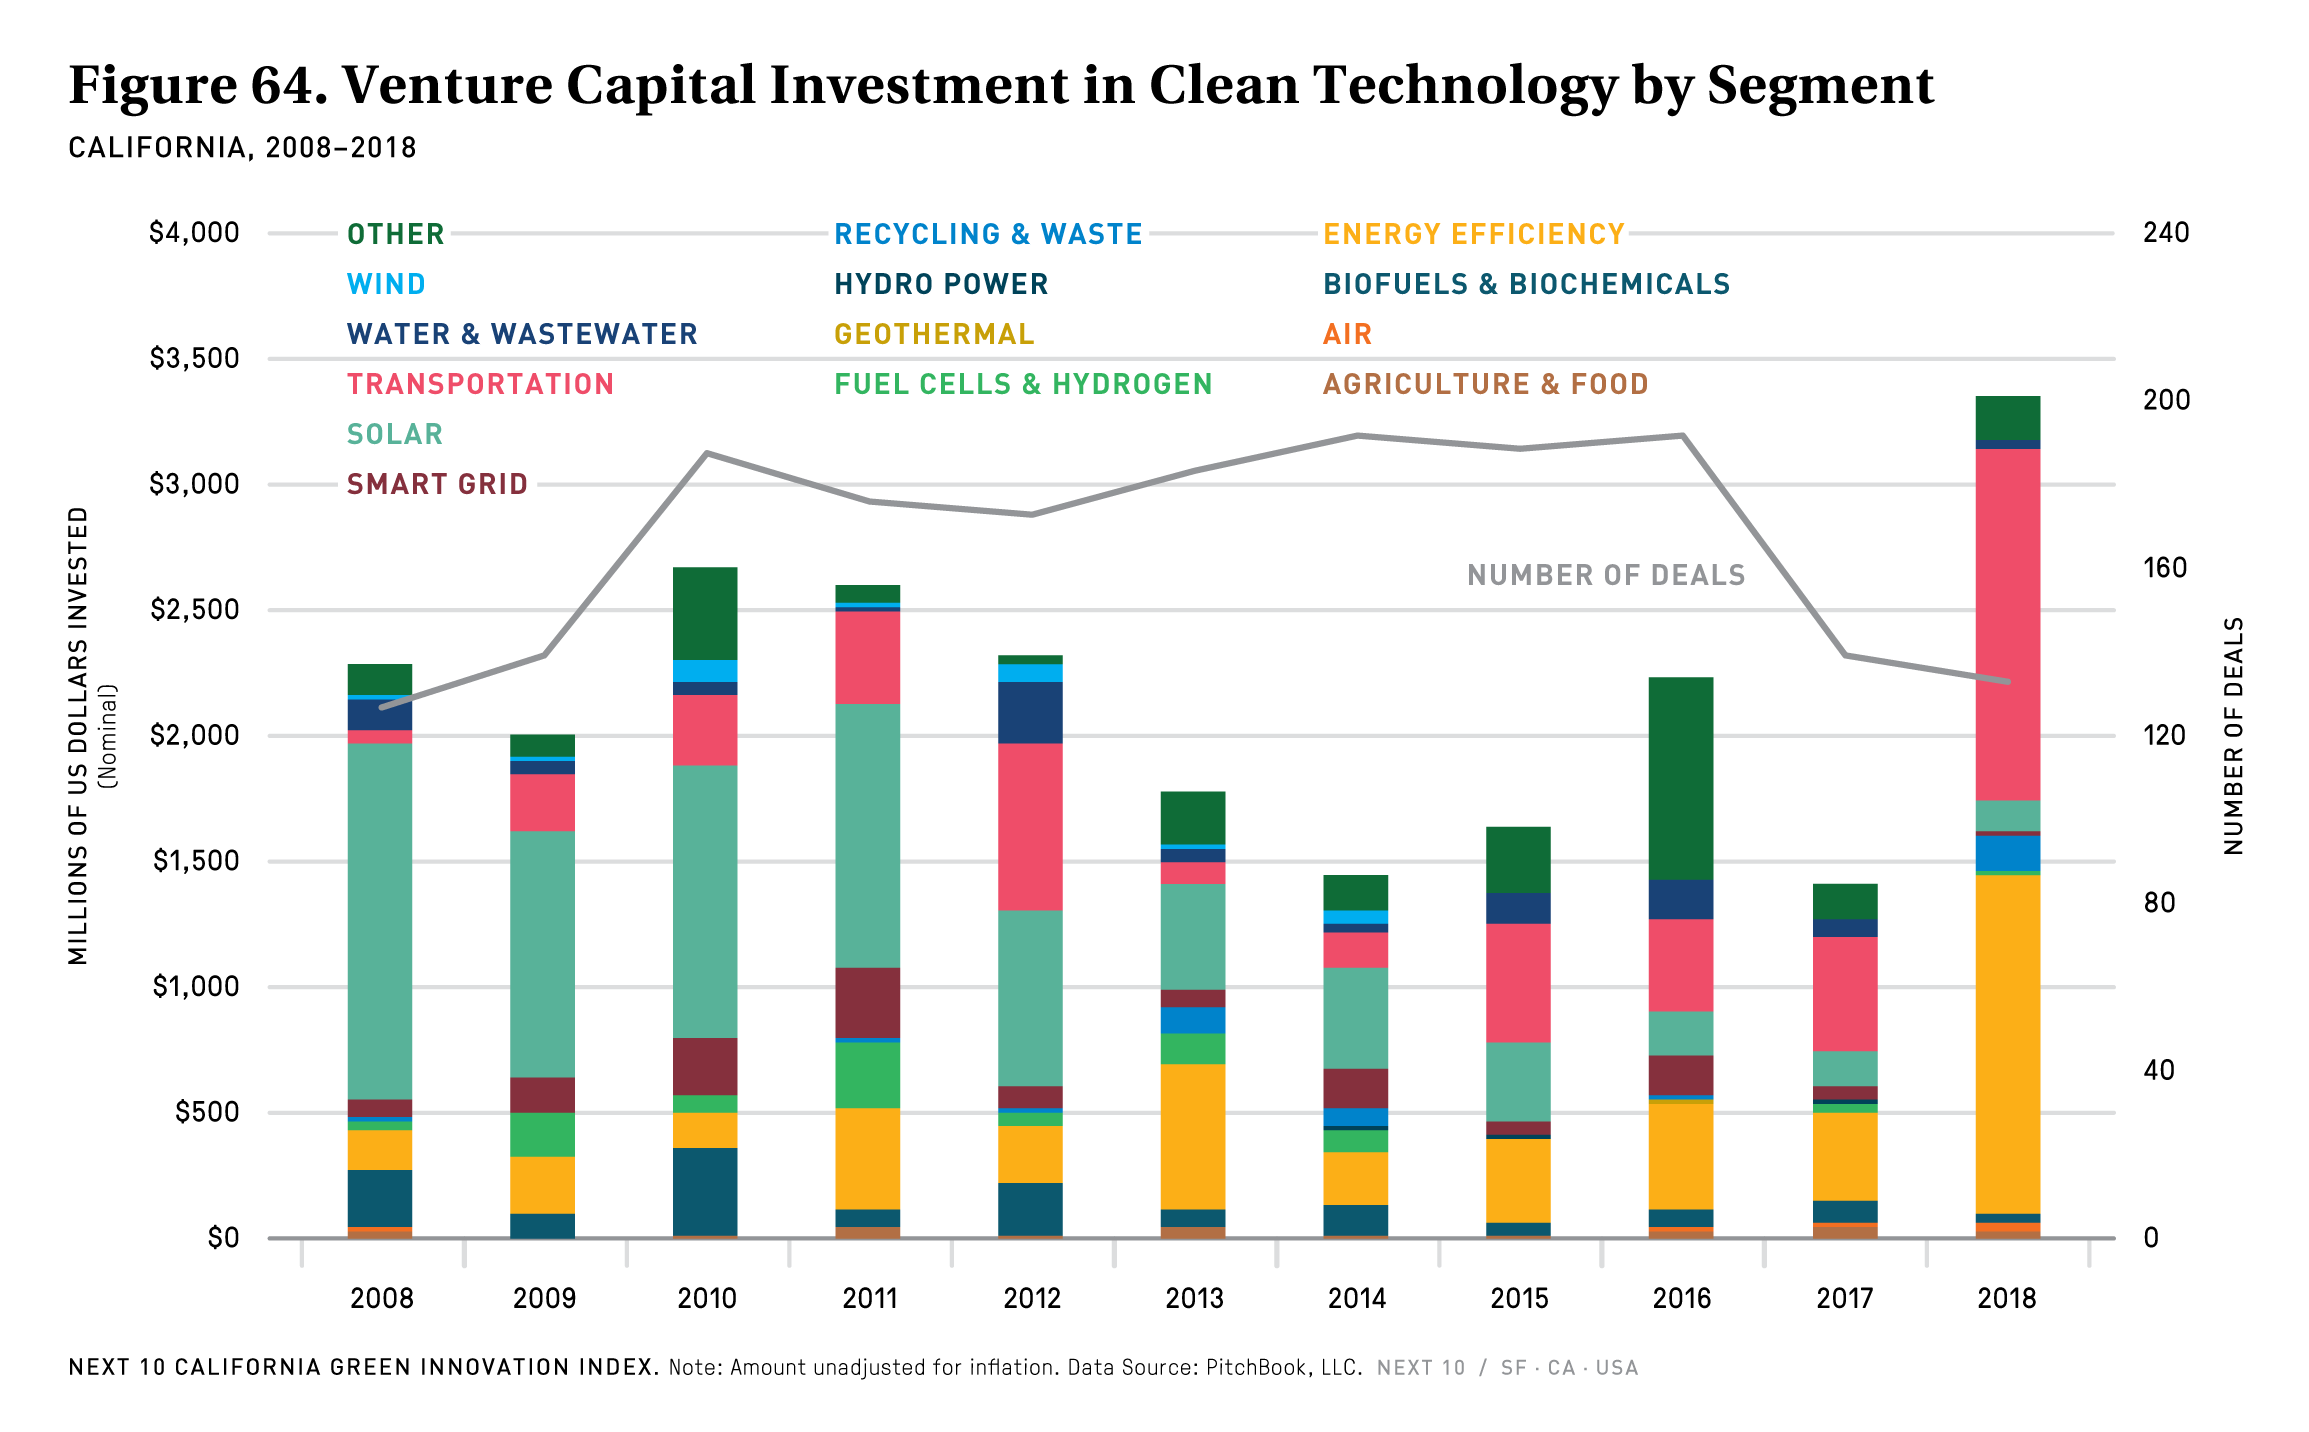
- Compared to 2017, the dollar amount invested in California increased 137.1 percent, reaching $3.4 billion in venture capital (VC) funding.
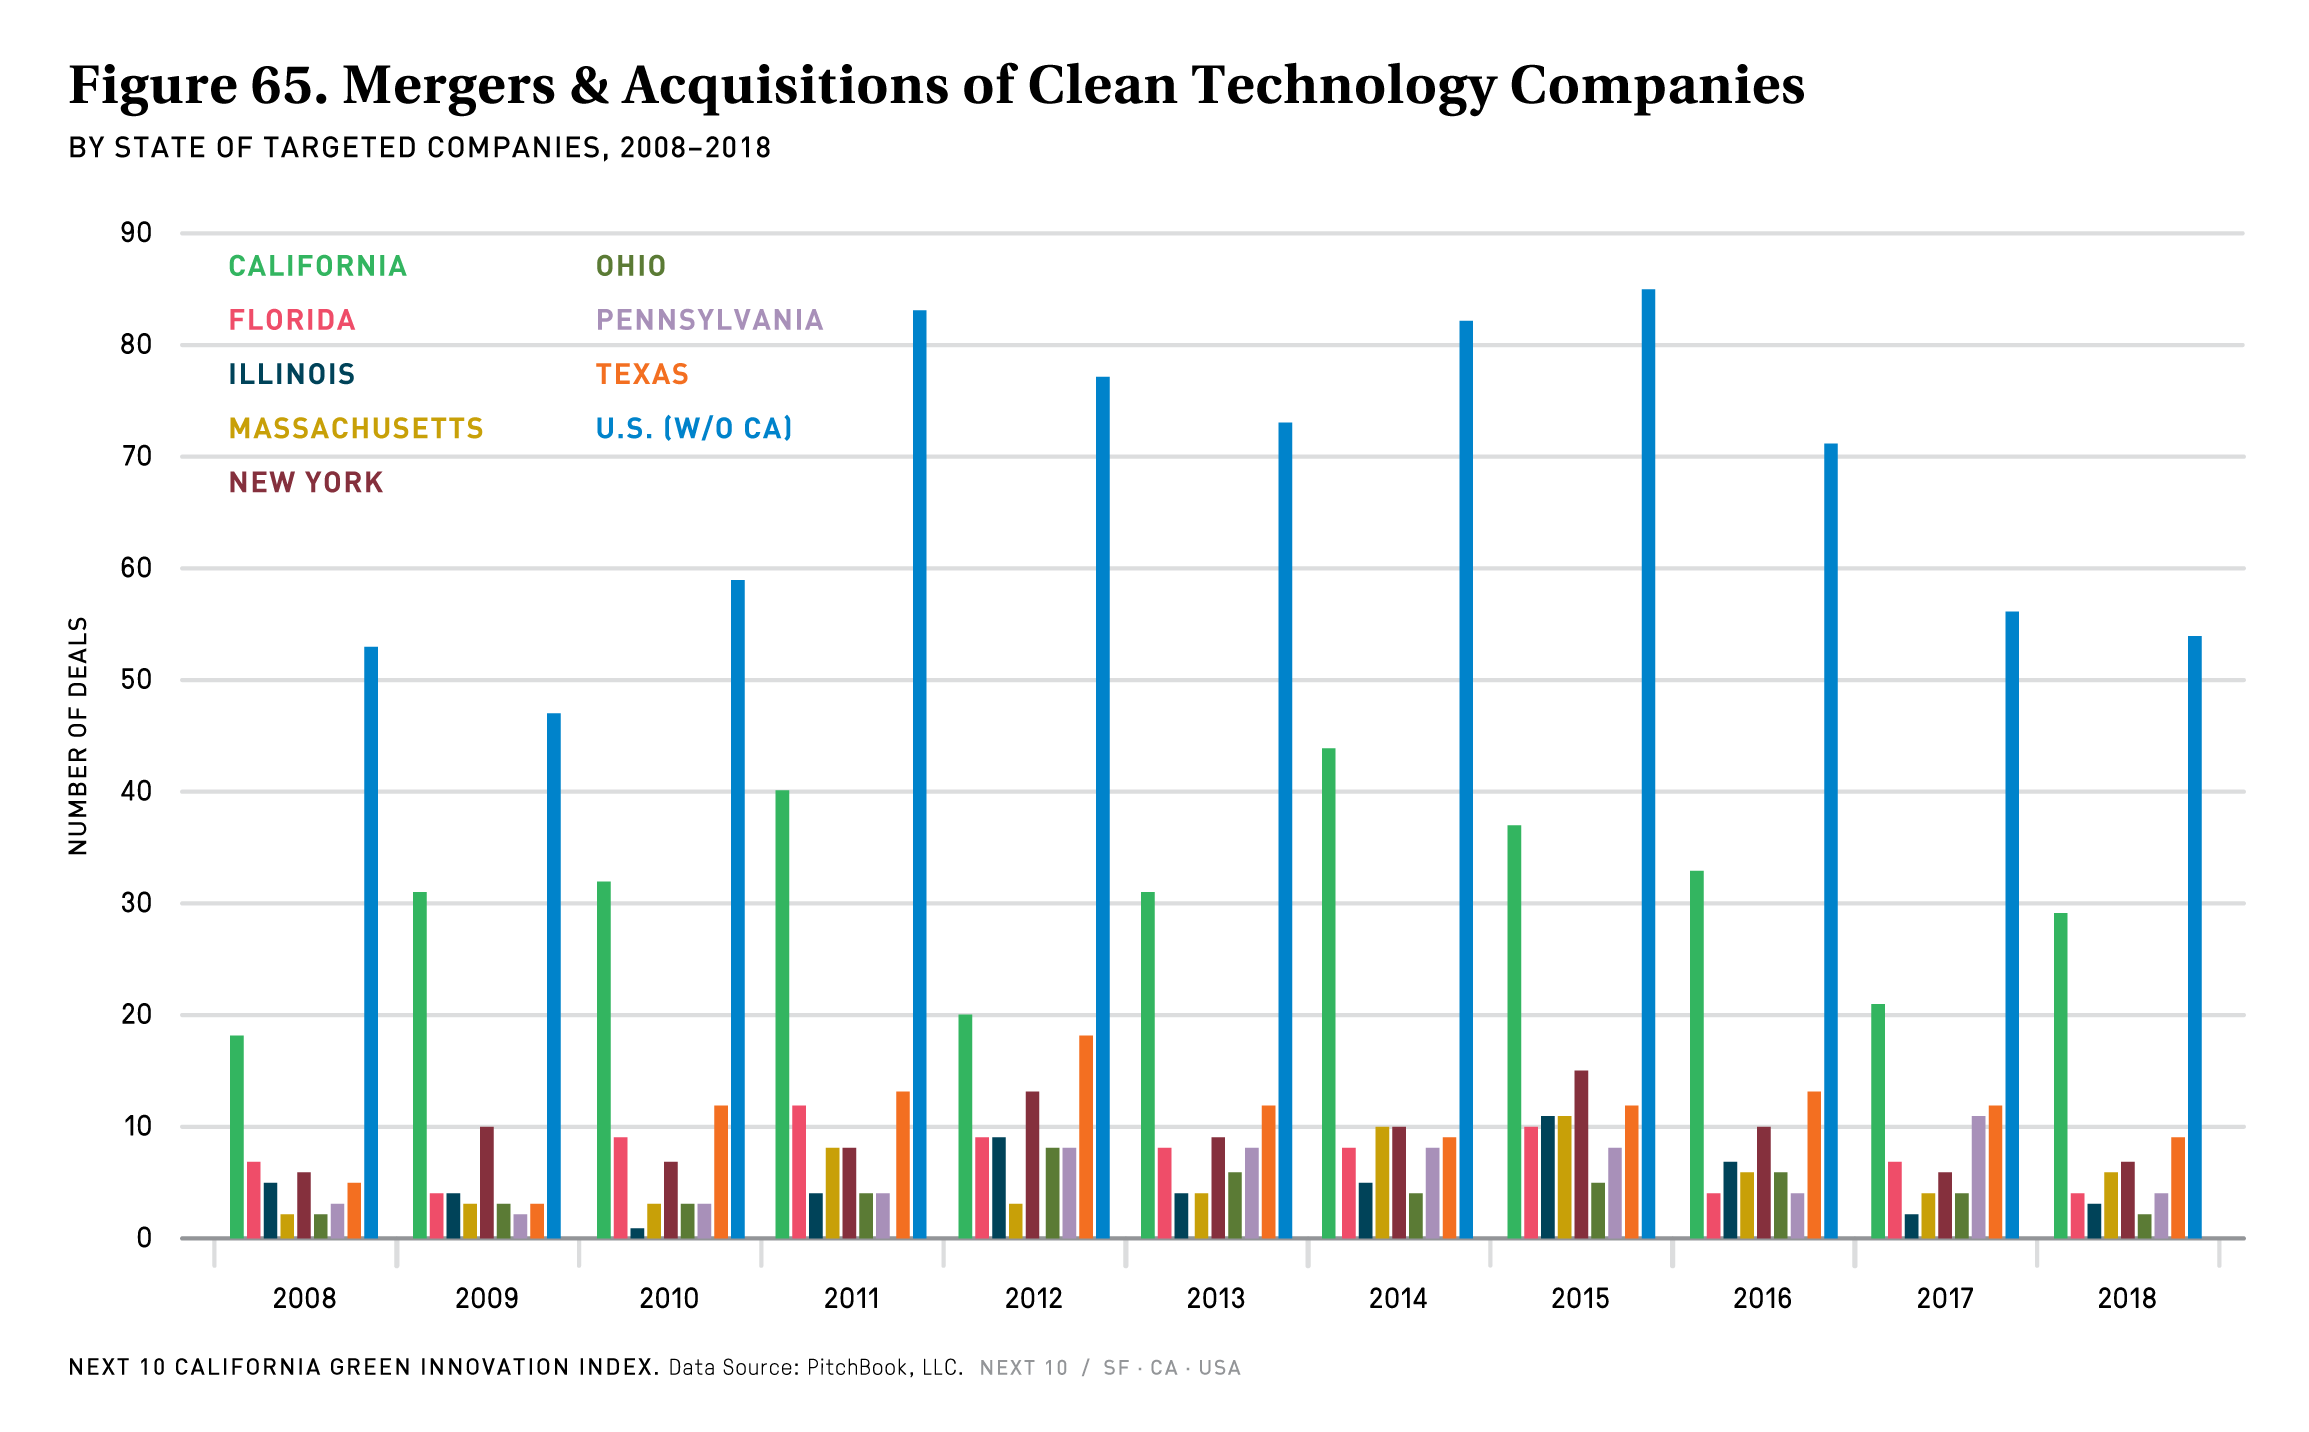
- Venture capital investment in clean technologies totaled $5.8 billion in the U.S. in 2018, of which 58 percent ($3.4 billion) was invested in California.
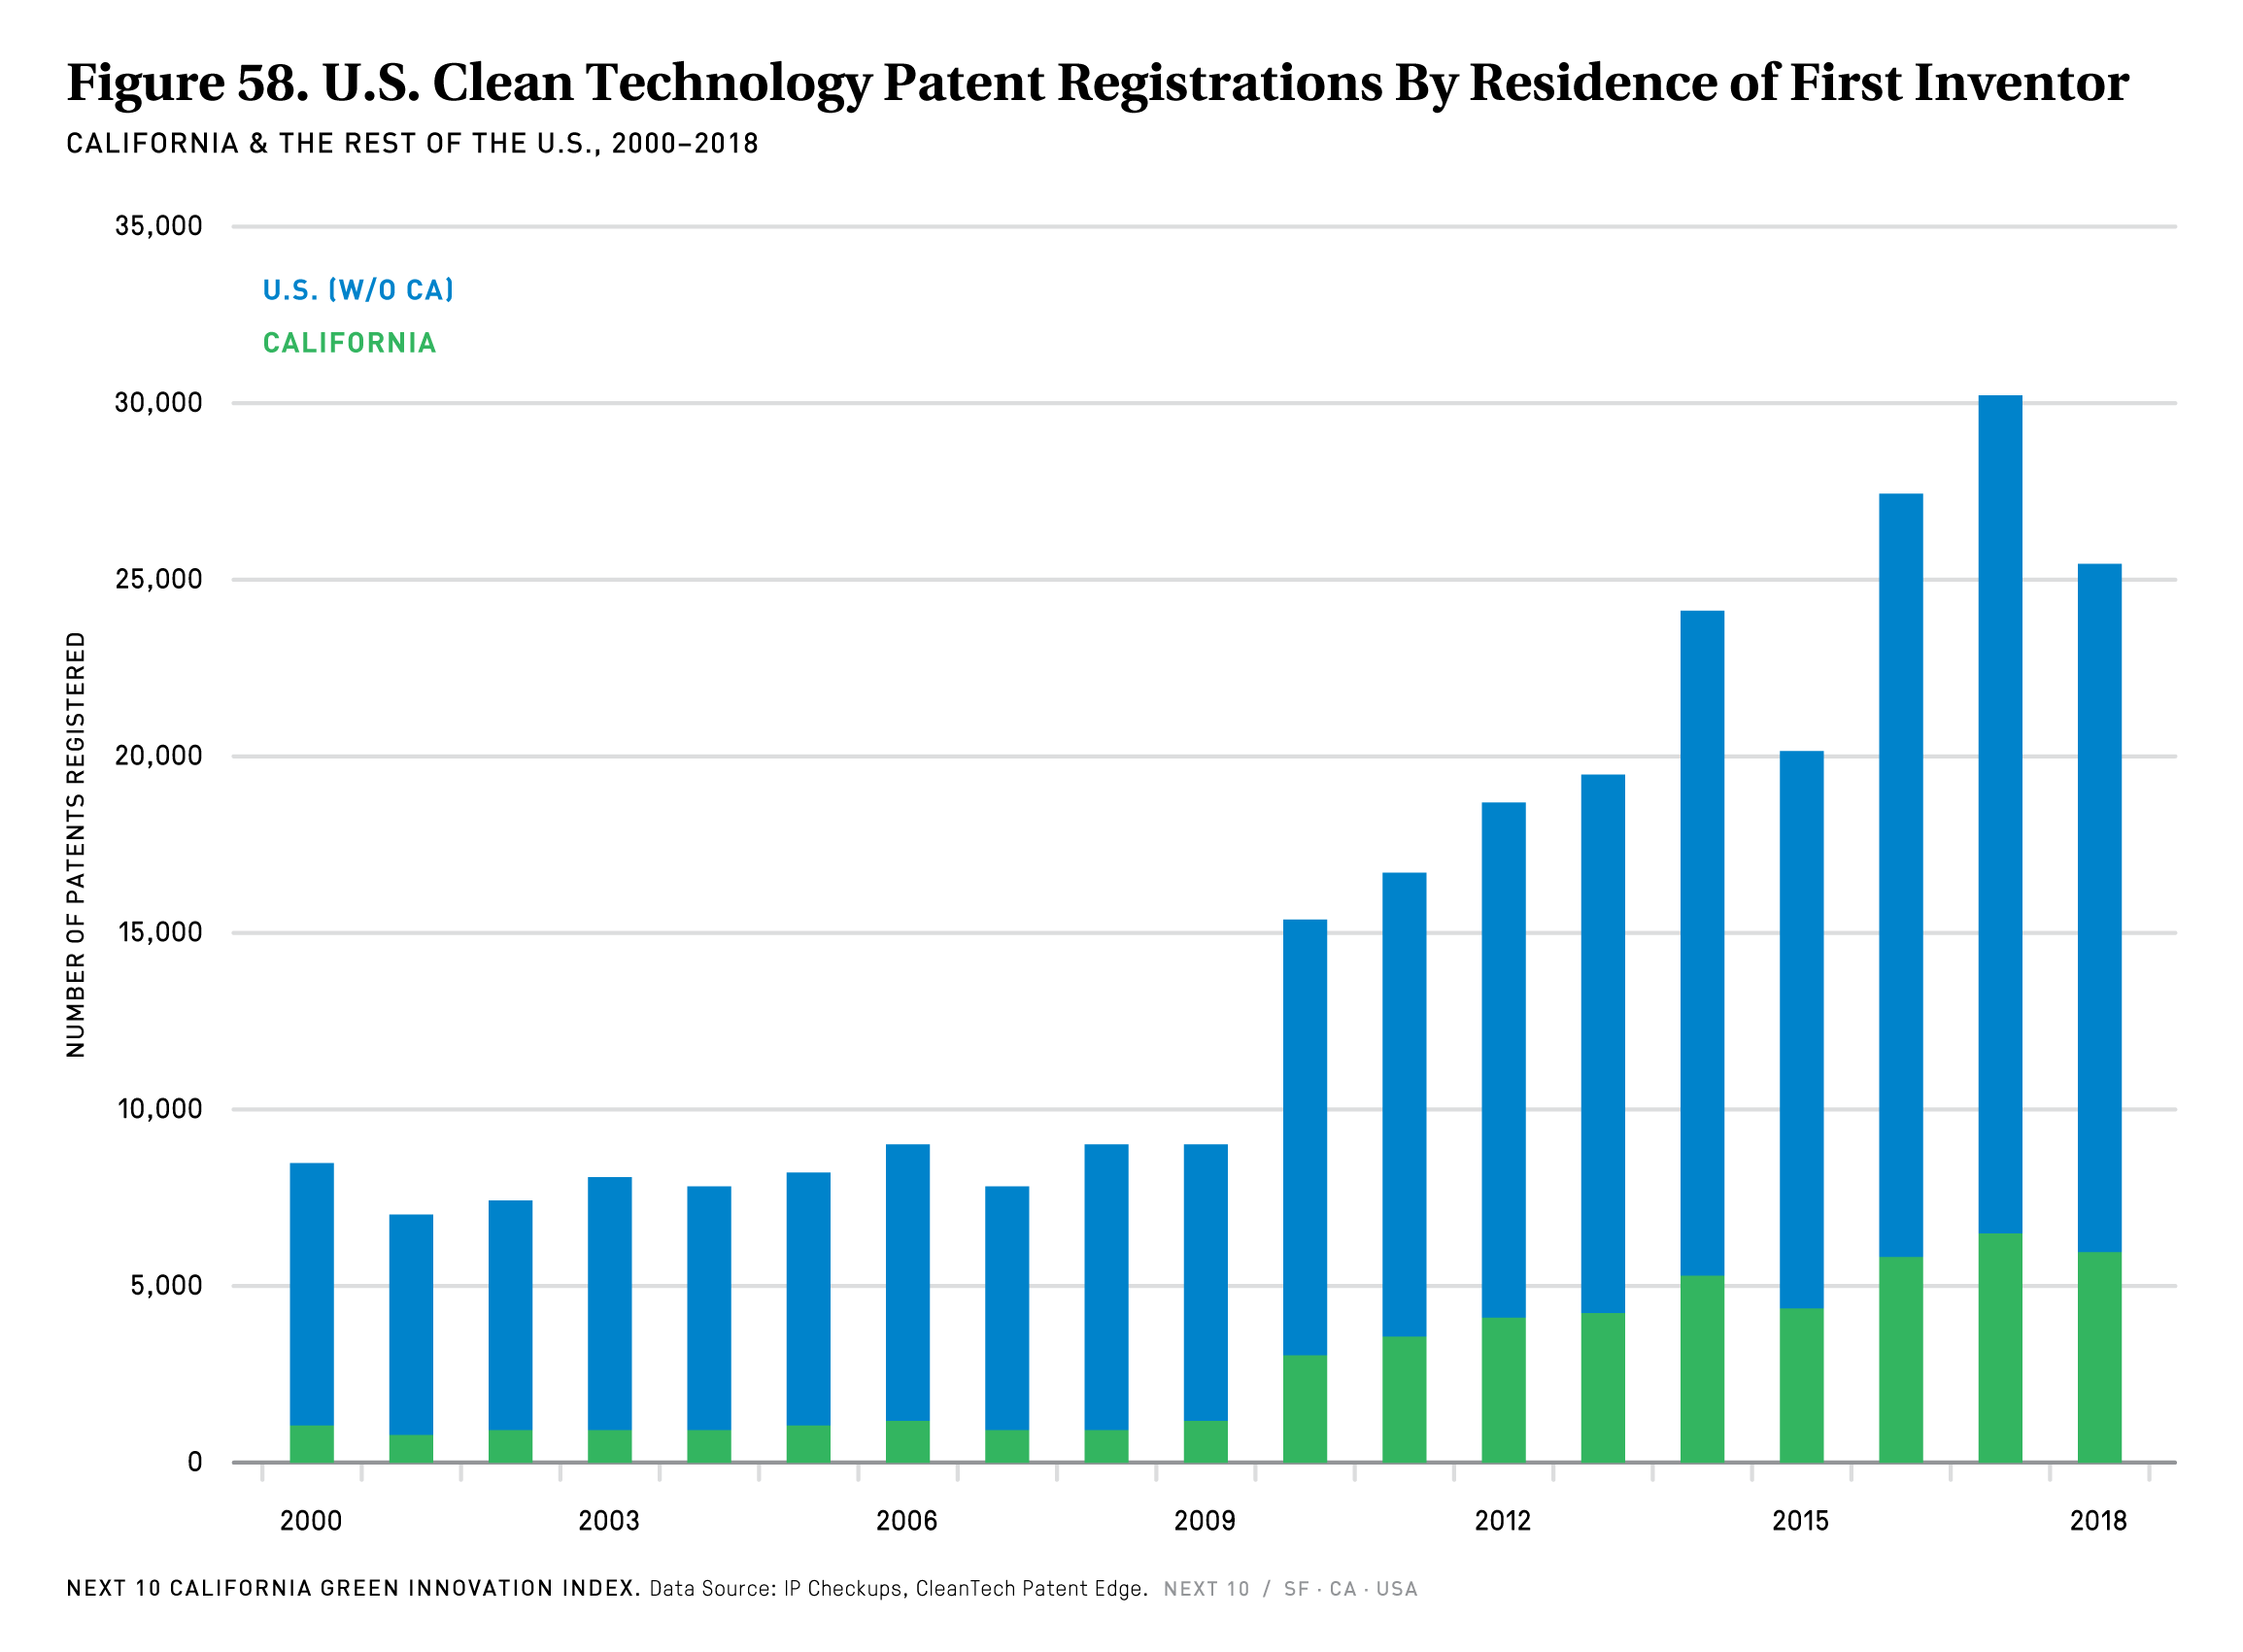
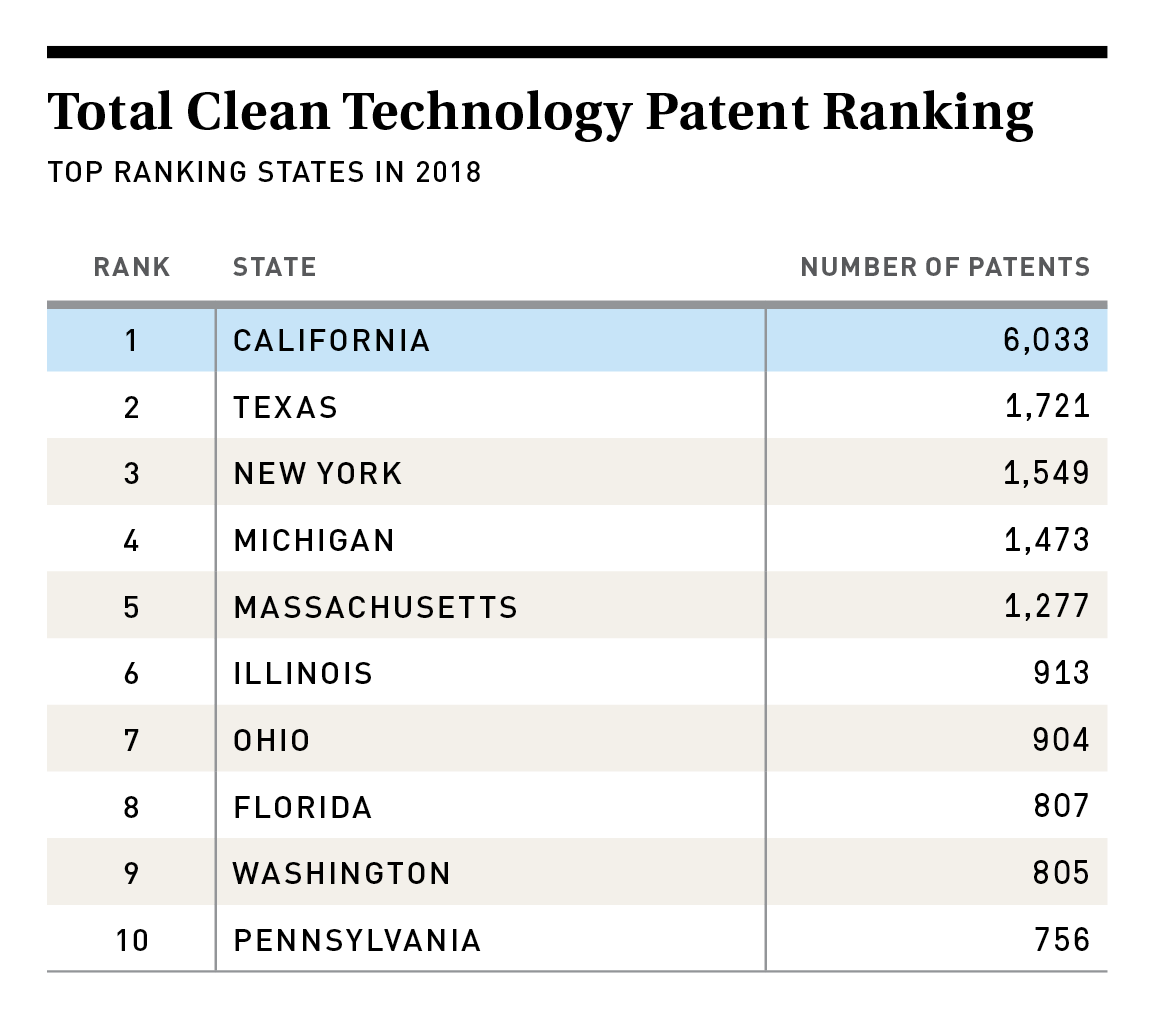
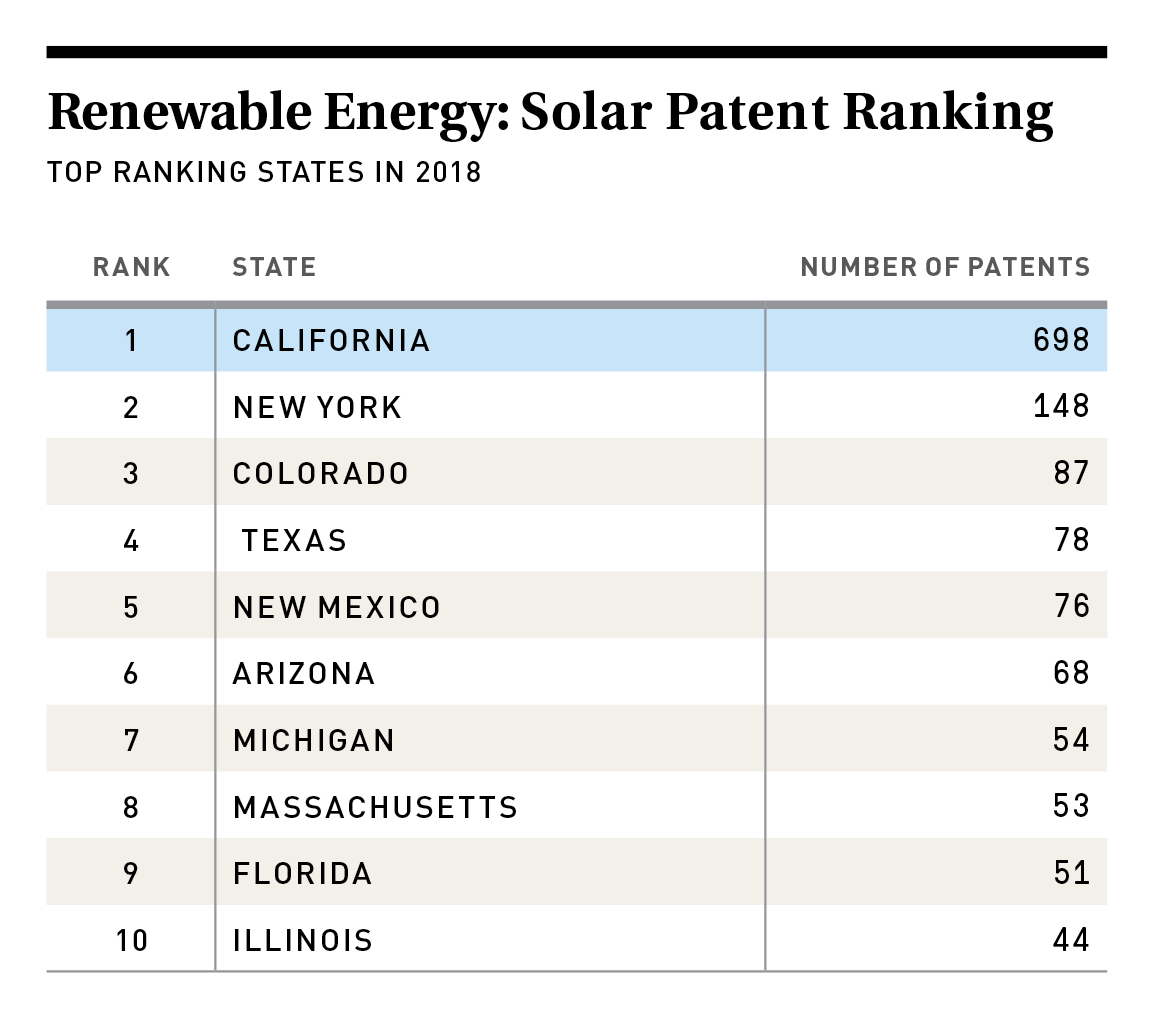
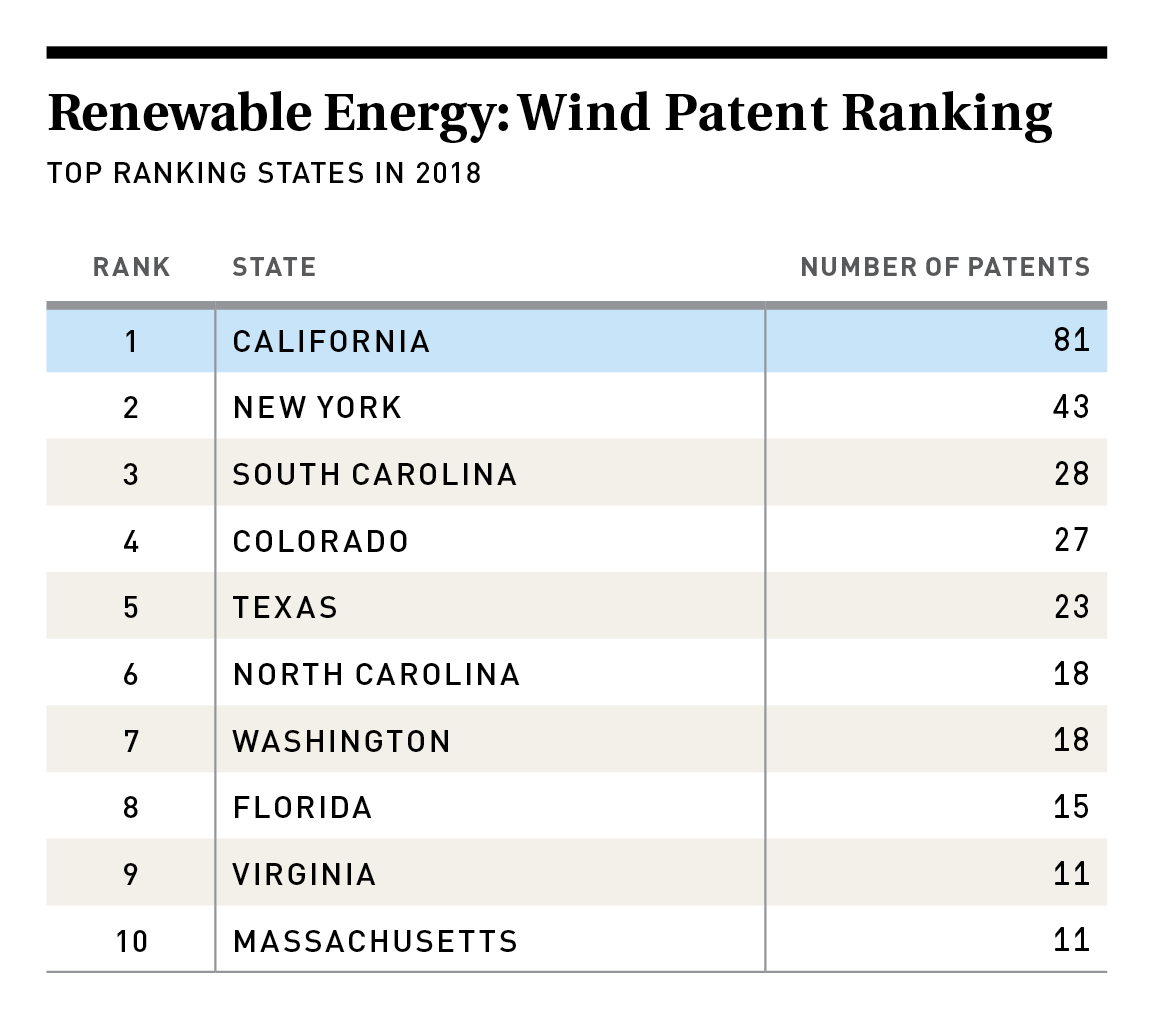
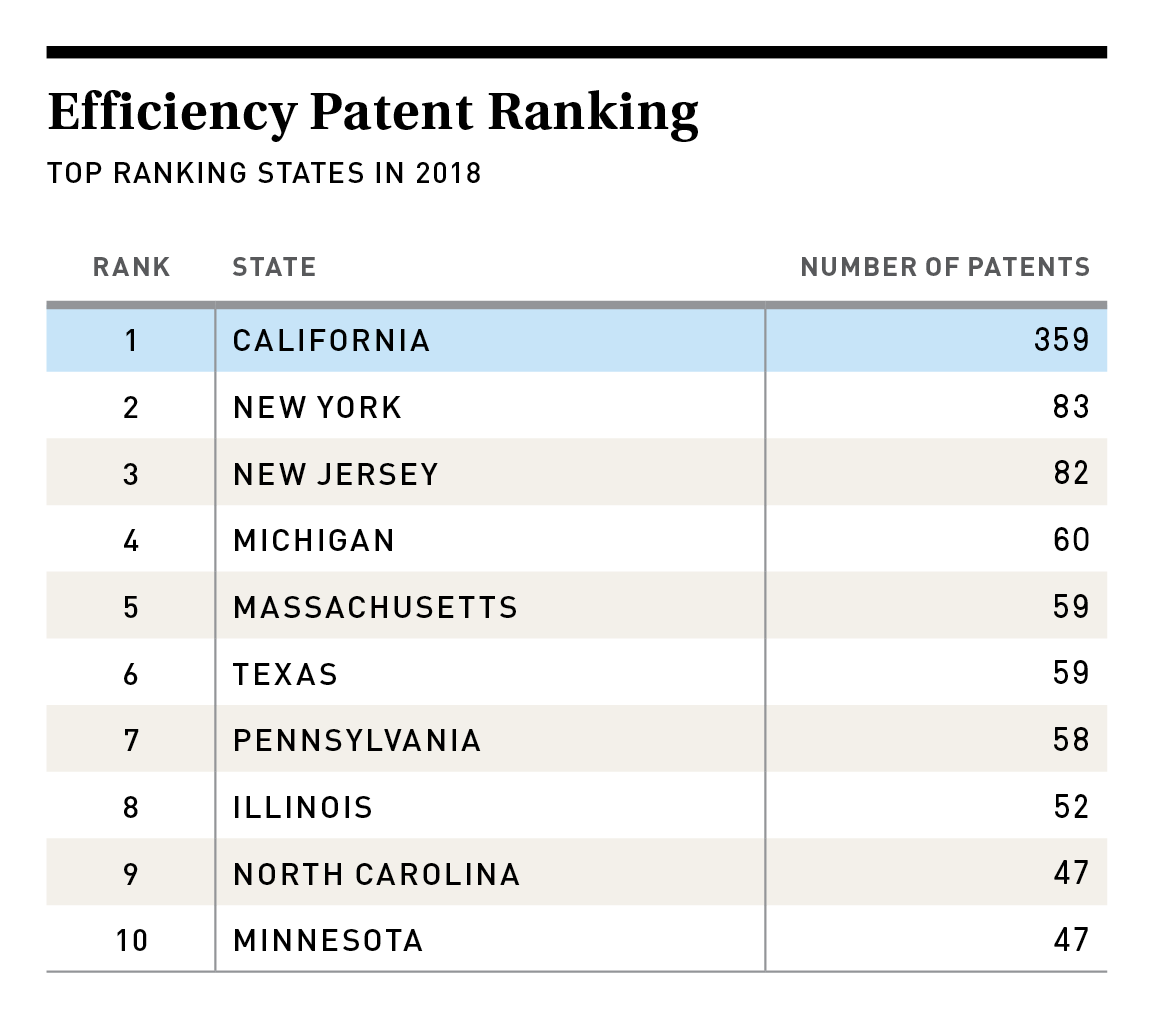
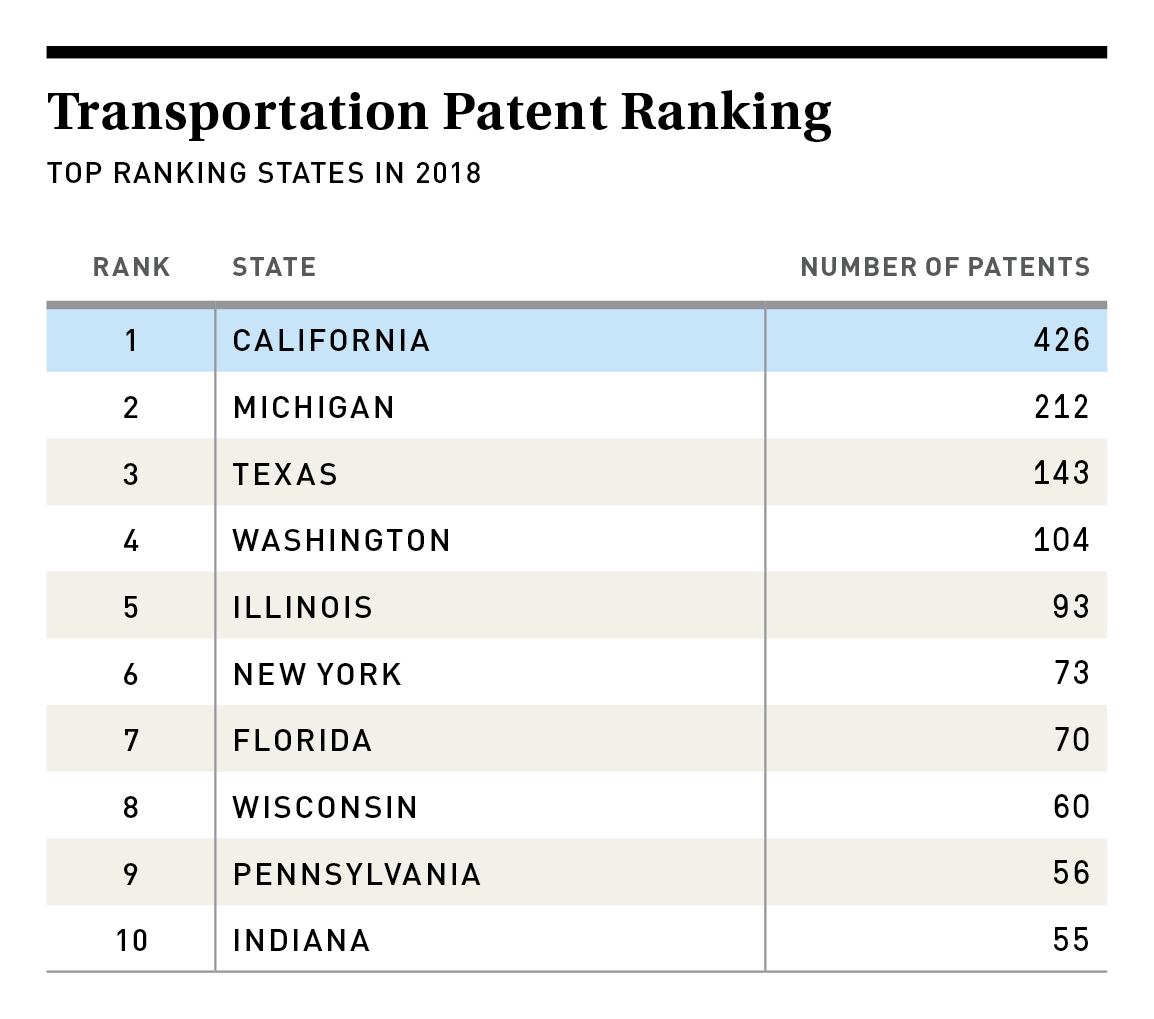
- California is the clear leader in clean tech patent registration in all major clean technology categories. For every one patent registered in Texas, the state with the second-most patents registered in 2018, California had 3.5 patents.
- Venture capital investment in solar totaled just $122.2 million in California in 2018, less than one-tenth of the $1.43 billion investment the state saw in that sector in 2008. Only 22.6 percent of the deals made in the U.S. were in California in 2018, down slightly compared to 23.5 percent in 2017.
- The dip in the number of patents registered in 2018 (compared to 2017 and 2016) might signal a slowdown in clean tech patent applications, not just in the U.S., but globally.
Next 10 owns the copyright to all graphics in this section, and they are available for download and limited use, subject to our Terms of Use. Please contact Next 10 at info@next10.org with any questions.